Temporal Geomorphological Changes in Nanak Sagar Reservoir (INDIA) Using Satellite Data
Nandkishor A. Ingole1 * , R.N. Ram1 , A.S. Nain2 and Prem Kumar3
http://dx.doi.org/10.12944/CWE.11.2.14
An attempt was made to assess the sedimentation in Nanak Sagar reservoir using multi-dated Remote Sensing (RS) images. IRS LISS III and Landsat-8 (OLI) remote sensing data were taken in the year 2007 and 2015, respectively. The original capacity curve (1962) was optimized for the study of the capacity loss to various water levels. Results showed that the morphology of the reservoir has been changed significantly due to sedimentation from 1962 to 2015. The reservoir has lost a total of 2934.64 hectares (ha) by dint of sedimentation which is accounted for 59.89 % of the total water spread area during last 53 years and average deposition was computed as 1.13% per year. From the year1962 to 2007 maximum siltation deposited in Full Storage Level (FRL) of the reservoir and from 2007 to 2015 in Dead Storage Level (DRL)in the period 2007 to 2015. It can be concluded that multi-dated remote sensing images can be used as a valuable tool for the study of temporal as well as spatial changes in any large water body.
Copy the following to cite this article:
Ingole N. A, Ram R. N, Nain A. S, Kumar P. Temporal Geomorphological Changes in Nanak Sagar Reservoir (INDIA) Using Satellite Data. Curr World Environ 2016;11(2) DOI:http://dx.doi.org/10.12944/CWE.11.2.14
Copy the following to cite this URL:
Ingole N. A, Ram R. N, Nain A. S, Kumar P. Temporal Geomorphological Changes in Nanak Sagar Reservoir (INDIA) Using Satellite Data. Curr World Environ 2016;11(2). Available from: http://www.cwejournal.org/?p=15324
Download article (pdf) Citation Manager Publish History
Introduction
The purpose of creating reservoirs are for irrigation, drinking water, hydropower generation, and fish production. The reservoirs in the world are subjected to sedimentation with a rate of approximately 1% per year (WCD, 2000). The rates of sedimentation in reservoirs have the direct relationship with the type and size of the drainage basin.
Sediment deposited encroach not only the dead storage portion but also the live storage of the reservoir. Various processes like soil erosion in the catchments, changes in land use, until age practices, deforestation and lack of soil conservation measures in the catchments speed up the rate of sedimentation in the reservoir and subsequently causes are reduction in the capacity of the reservoir (FAO, 2001). Any diminution in water spread area at a specified elevation over a period is indicative of sediment deposition at this level. Remote sensing and Geographical Information Systems (GIS) can play a vital role in assessment and management of water resource for inland fisheries and aquaculture. In fisheries perspective, important reservoirs of the Tarai region are Naitaal, Tumaria, Haripura, Baur, Baigul, Dhaura, Nanaksagar and Sarda Sagar, which are located at 280 25' to 290 55' N latitude and 780 18' to 790 55' E longitude (Ingole et al., 2015). Remote sensing and GIS are decision supporting technical tools that provide spatial and temporal variations in water bodies (Chowdhury et al. 2009). Thus, the mapping of fisheries resources would provide substantial evidence for sustainable water management for the socio-economic perspective from them. Remote sensing and GIS are very useful when resources are remotely located.
Several workers such as Best and Moore (1979) and Eckhaedr and Lirke (1988) used remote sensing and GIS as tools to assess the water bodies. Nanak Sagar reservoir located in Tarai region of India and imperative for fisheries activities. The aim of present study is to assess the temporal geomorphological changes in Nanak Sagar for a sustainable fishery and water management.
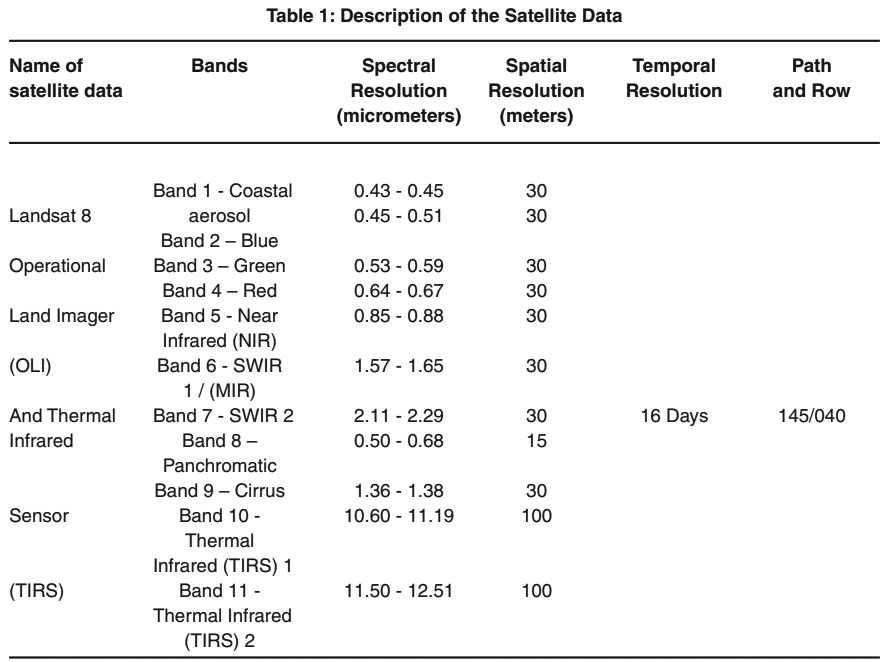 |
Table 1: Description of the Satellite Data Click here to view table |
Material and Methods
Study Area
The Nanak Sagar reservoir was created in 1962 by constructing an earth dam of 19.20 km length across river Deoha. The reservoir is located in between (28° 56' to 28° 58' N and 79° 49' to 79° 52' E) in Udham Singh Nagar district of Uttarakhand. The water spread area at full reservoir level (FRL) is 215.19m at elevation and Dead Storage Level (DRL) is 208.61m at elevation.
Satellite Data
Multi-dated satellite images of LANDSAT 8 Operational Land Imager (OLI) and Thermal Infrared Sensor (TIRS) for the year 2014-2015 of the study area were freely downloaded from the USGS Glovis website (http://glovis.usgs.gov) in the "GeoTIFF plus Metadata" format, all images are available in terrain corrected format. LANDSAT 8 images consist of nine spectral bands with a spatial resolution of 30 meters for Bands 1 to 7 & 9, except the thermal infrared and panchromatic (bands 10, 11 and 8) respectively, has been shown in Table 1were used for present study.
Image Processing Software
Environment for Visualizing Images (ENVI 4.8) was used to the process of satellite imageries. Here five images of landsat-8 were processed in same software on different dates. (When an input data file is opened, its bands are stored in a list where data can be accessed for all system functions.
Atmospheric Correction Techniques
Atmospheric Correction for Satellite Imagery is a method used to reduce atmospherically and illumination effects from remotely sensed data to retrieve physical parameters of the earth's surface.
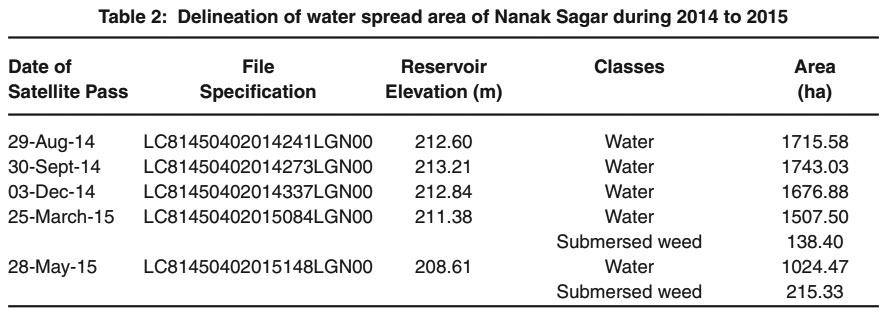 |
Table 2: Delineation of water spread area of Nanak Sagar during 2014 to 2015 Click here to view table |
Quick Atmospheric Correction (QUAC)
QUAC is a visible-near infrared through shortwave infrared (VNIR-SWIR) atmospheric correction method for multispectral and hyper-spectral imagery. Atmospheric corrections were carried out using ENVI-4.8 image processing software.
Training of Software
Training of I/P software (ENVI-4.8) is the process by which the software is trained to recognize the spectral signatures of various target objects. To provide training, supervised classification scheme was employed by creating Region of Interests (ROIs) of various target objects and spectral signatures were recorded. Multiple ROIs were drawn in the zoom window of ENVI.
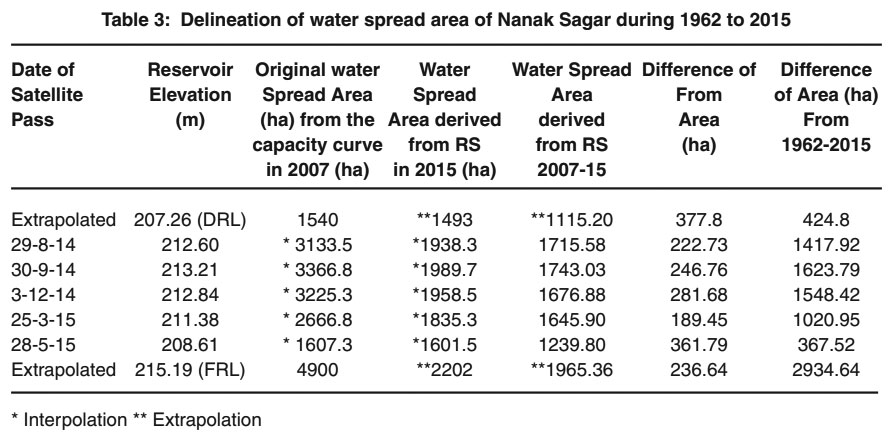 |
Table 3: Delineation of water spread area of Nanak Sagar during 1962 to 2015 Click here to view table |
Estimation of Water Spread Area (WSA)
These registered images for five different dates about study area were used to estimate water spread area through supervised classification. The pixels representing water spread area of the reservoir were clearly distinguishable in the False Color Composition (FCC). Remote sensing data represent the elevation level in between207.26m and 215.19m. Interpolation and extrapolation techniques were also used to derive the required water spread area at different elevations. Derived volume of water at a different elevation from the remote sensing data was compared with original volume at the same elevation. The difference between original volume and derived volume is the capacity loss of reservoir obtained due to sedimentation (Kumar et al., 2013).
Results
Delineation of Water Spread Area
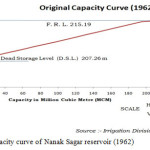
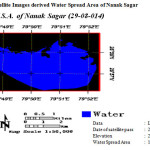
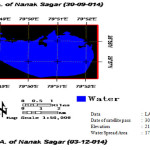
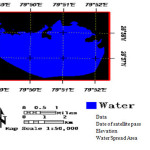
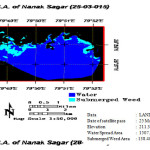
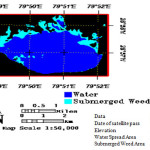
The water spread area of the reservoir in the different dates during 2014-15 of satellite pass dated was delineated, which is depicted in Table 2. The original areas of the particular elevation during the satellite pass in a reference to the year of establishment of the reservoir were calculated from the original capacity curve using interpolation technique (Figure1). The maps of the classified images are depicted in the Figure 2-6 showed water spread area of the reservoir. The elevation 213.21m corresponding to 30-Sept-14 satellite overpass is closer to Full Reservoir Level (FRL) 215.19m, whereas elevation 208.61m corresponding to 28-May-15 is lowest amongst all the satellite overpass elevation. The complete set of data can be used for assessing the sedimentation rate.
 |
|
 |
|
 |
|
 |
|
 |
|
 |
|
Estimation of water spread area and Temporal changes
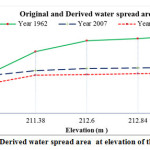
The water spread area of the reservoir was obtained from the classified satellite images of different dates. The water spread areas of the Full Reservoir Level and Dead Storage Level were interpolated and extrapolated from the available data. Original water spread at full reservoir level was 4900 ha which has been reduced to 2202 ha in 2007 (Ingole, 2012) and 1965.36 ha in 2015 assessed through satellite remote sensing data at the same elevation. The water spread area for the original data and derived one at the same elevation of satellite passing date shown in Table 3.
Discussion
That maximum siltation deposited on the upper region (riverine zone) of the reservoir by the huge difference between original water spread area and derived water spread area at a corresponding high elevation of the reservoir in the first interval from 1962-2007. But in second interval (2007-2015), maximum siltation deposited on lacustrine and transitional zones at low elevation, might be because of riverine zone already silted and very shallow, hence silt deposited into next zones shown in Figure7. The reservoir has lost a total of 2934.64 ha by dint of sedimentation which is accounted for 59.89 % of the total area during last 53 years and average deposition was computed as 1.13 % per year. In a previous hydrographical survey conducted by U.P. Irrigation Research Institute, Roorkee it was revealed that the sedimentation in the live storage was found 4.53% during the period June 1992 to June 2008.
 |
|
Ingole et al. (2015) have been calculated as 26.78% area loss out of total area of the reservoir an average silt deposition of 0.59% during 1962 to 2007. The sedimentation rate of Nanak Sagar was computed as 1.13 % per year of the total area. Several workers had studied on the different reservoirs such as Jain et al. (2002) for Bhakra reservoir during 1965-1997(0.29%); Nagaanupama (2005) for Ujjani reservoir during 1977-2003 (1.8%); Mukharjee et al., 2007 for Hirakud reservoir during 1957-1989 (0.75%); Kumar, 2008 for Sarda Sagar reservoir during 1962-2006-07 (0.26%). Further, National Remote Sensing Centre (2003) observed sedimentation rate per year for different reservoirs in India as Kuttiyadi (0.12%) during 1989-1995; Sriram Sagar (1.0%);Bargi (0.07%) during 1990-2000 during 1970-2002. He has been concluded that the result of the Nanak Sagar falls within the range at national level studies.
Conclusion
The average sedimentation rate for 53 years was 1.13% per year, and area loss of 2934.64 ha (59.89%) from 1962 to 2015. The maximum siltation deposited on the lower region in second interval (2007-2015) at a corresponding elevation of the reservoir as observed. Final it is concluded that multi-dated Remote Sensing (RS) images can be used for the study of temporal as well as spatial information of any large water bodies.
Acknowledgement
Authors are thankful to Dean, College of Fisheries for providing necessary facilities to carry out the present study. The financial assistance in term of fellowship offered by G.B. Pant University of Agri. & Tech., Pantnagar, India, is also greatly acknowledged.
References
- Best RG, Moore D.G.Landsat interpretation of prairie lakes and wetlands of Eastern South Dakota. Satellite hydrology. In: Proceedings of the 5th Willian T. Pecora memorial symposium on remote sensing, Sioux Falls, South Dakota U.S.A. August 1979, American Water Resources Association, Bethesda, MD, pp 499–506.(1979)
- Chowdhury A, Jha MK, Chowdary VM, Mal B.C.Integrated remote sensing and GIS based approach for assessing groundwater potential in West Medinipur district, West Bengal. India. Int J Remote Sens 30(1):231–250(2009)
CrossRef - Eckhaedr DW, Lirke D.W. Estimation of reservoir surface areas using satellite imagery. Upper Gunison Basin, Colorado. Conference on water data for water resources management, Tucson, Arizona, U.S.A. August 1988. American Water Resources Association, Bethesda, MD, pp 691–702 (1988)
- FAO. Dam, Fish and Fisheries Opprotunity, Challenges and Conflict Resolution (Marmulla, G) FAO Fish. Tech. Paper. No. 419. Rome, Italy (2001).
- Ingole N A, Ram R N, Rajeev Ranjan and Shankhwar A K. Advance application of geospatial technology for fisheries perspective in Tarai region of Himalayan state of Uttarakhand. Sustain. Water Resour. Manag.1:181–187 (2015).
CrossRef - Ingole N.A., Ram R.N. and Kumar Prem. Assessment of sedimentation in Nanak Sagar reservoir of Uttarakhand, INDIA: using remote sensing technique, J Envi. Bio-Sci. Vol. 29 (1):17-21 (2015).
- Ingole, N. A. Assessment of sedimentation status using Remote Sensing data and its impact on ichthyofaunal diversity in Nanak Sagar reservoir of Tarai region of Uttarakhand, M.F.Sc. Thesis, G.B. Pant University of Agri.& Tech., Pantnagar, Uttarakhand, INDIA. (2012).
- Jain, S. K., Singh, P. and Seth, S. M. Assessment of sedimentation inBakraReservoir in the western Himalayan region using remotely sensed data, Hydrological Science Journal. 47(2):203-212 (2002).
​​​​​​​CrossRef - Kumar P., Saxena, K.K., Tyagi, B.C., Nayak, A.K., Pandey, N.N., Haldar, R.S. and Mahanta P.C. Remote sensing study on geomorphological degradation of Sarda Sagar reservoir, J. of Environ. Bio. 34:1065 (2013).
- Kumar, P. Spatial database on fish and fisheries resources of Sarda Sagar reservoir, Tarai region of Uttarakhand and UP, India, PhD Thesis M.J.P. Rohilkhand University, Bareilly, UP. (2008).
- Mukharjee, S., Veer, V., Tyagi, S. K. and Sharma, V. Sedimentation Study of Hirakud Reservoir through Remote SensingTechniques.Journal of Spatial Hydrology. 7(1):122-130 (2007).
- Nagaanupama, A. Reservoir sedimentation using satellite Remote Sensing. Projectreport, V. N.R.V.J. Institute of Engeenring and Tech. (Affiliated to JNTU,Hyderabad) (2005).
- National Remote Sensing Centre. Reservoir Sedimentation Assessmen using satellite Remote Sensing Technique- Expertise & Experience of NRSA Water Recourse Division, NRSA (Dept. of Space), Hyderabad (2003).
- WCD. Dams and development. A New Framework for Decision-Making. Earth scan Publications Ltd, London, 356 pp. (2000).


