To Study the Temporal Variation of Capacity Utilization Factor (CUF) of PV Based Solar Power Plant with Respect to Climatic Condition
Ramesh Harajibhai Chaudhar1 * , Bharat Hakmabhai Chaudhari1 , Pratiksinh Dilipsinh Chavda1 and Vijya Leela bhai1
1
College of Renewable Energy & Environmental Engineering,
Sardarkrushinagar Dantiwada Agricultural University,
S.K.Nagar,
385506
Gujarat
India
http://dx.doi.org/10.12944/CWE.11.2.38
Performance, quality and reliability of technology are becoming more and more important for the emerging photovoltaic markets worldwide. In this experiment the monitoring of climatic factors like, solar radiation, Ambient Temperature, Module Temperature, Relative Humidity and Wind Speed was carried out on daily basis for six months, between 7:00 A.M to 6:00 P.M. Data was measured with SCADA system. This analysis was carried out by monitoring the fluctuation in power output of the system with climatic factors. From the results, there is direct proportionality between the power output of the system and the climatic factors. The correlation between ambient air temperature, PV module temperature and CUF is strongly positive. The other climatic factor like wind speed is does not have much significant effect on CUF. The Relative humidity is negatively correlated with CUF. The correlation between solar radiation and the CUF is strongly positive.
Copy the following to cite this article:
Chaudhari R. H, Chaudhari B. H, Chavda P. D, Aal V. L. To Study the Temporal Variation of Capacity Utilization Factor (CUF) of PV Based Solar Power Plant with Respect to Climatic Condition. Curr World Environ 2016;11(2) DOI:http://dx.doi.org/10.12944/CWE.11.2.38
Copy the following to cite this URL:
Chaudhari R. H, Chaudhari B. H, Chavda P. D, Aal V. L. To Study the Temporal Variation of Capacity Utilization Factor (CUF) of PV Based Solar Power Plant with Respect to Climatic Condition. Curr World Environ 2016;11(2). Available from: http://www.cwejournal.org?p=908/
Download article (pdf) Citation Manager Publish History
Introduction
The sun provides a plentiful resource for generating clean and sustainable electricity without global warming emissions or toxic pollution. A device that converts solar energy into electricity is known as solar cell.1 They produce electricity directly when sunlight penetrate on semiconductor is generate pairs of electrons (-) and protons (+) in the PV cells through photovoltaic effect. The basic process of solar photons energy convert in to electromagnetic energy, through which a PV cell converts sunlight into electricity, is known as photovoltaic effect.2 Sunlight is composed of photons, or particles of solar energy. A PV cell is typically made from crystalline silicon of 12 centimeters in diameter and 0.25 millimeters thickness. In full sunlight, it generates 4 amperes of (DC) direct current at 0.5 volts or 2 watts of electrical power.3
The climatic factor is known as physical conditions that determine the climate in a given area. The solar photovoltaic cells output performance varies with atmospheric factors. Since sunlight is intermittent, solar cells cannot generate electricity at a constant rate and the power delivered at a certain instant is still very much a function of weather factors.4 Solar light intensity, temperature, relative humidity and wind speed are factors that affect the output performance of solar photovoltaic system.5
Temperature is a physical property of matter that quantitatively expresses the common sentiments of hot and cold object. As the PV cell temperature rises above the standard operating temperature of 25ËšC, the system operates less efficiently and the voltage decreases. In this case heat can be considered as resistance to flow of electrons so effective current may also decrease. A panel temperature between 80 to 90ËšC, 0.5 % losses in efficiency per every degree rise in temperature.6 In solar systems without batteries, temperature rise is more noticeable hence airflow above and under the panel is critical to remove heat.7 Relative humidity defined as the ratio of water vapor actually in the air to the maximum water vapor the air can hold at a given temperature.8 When air is relatively dry compared to its capacity then the relative humidity percentage is low. The percentage of humidity reduce the amount of visible solar radiation reception, while humidity and wind speed both acts as cooling agents that increase the output of a PV module by reducing the module temperature.9
The speed and direction of the wind is called wind velocity. Photovoltaic plant provides the possibility of freely orientating the panels according to sun angles. The solar panels are typically mounted at an angle of 30 degrees, with a light steel structure to keep them in position.10 One traditional approach for smaller module installations has been to assume the highest wind load coefficients found in the wind action guidelines, a clearly uneconomical approach. The limited residual load capacity of module, combined with the use of ballast instead of penetrative fastenings, makes economical wind load coefficients desirable and often necessary.11 The functioning of PV modules at any time depends on various ambient variables including majorly temperature, humidity, light intensity, wind velocity, and other factors.12 Sometimes we want to get the value of instant efficiency to test the functioning of module at that instant, the main aim of this paper is to solve this kind of various problems, here an attempt has been made to obtain an equation among efficiency, temperature, humidity, light intensity and wind velocity, so that instant efficiency of module can be estimated by knowing temperature, humidity, wind velocity, light intensity using simple devices.13
Capacity utilization factor is a concept which refers to the extent to which a nation or a unit actually uses its installed productive capacity.14 Thus, it refers to the relationship between actual output that is produced with the installed equipment and the potential output which could be produced with it, if capacity was fully used. CUF is the most overused word when it comes to measuring a solar power plant performance.15 For a Solar Photovoltaic (SPV) project, Capacity Utilization Factor (CUF) is the ratio of actual energy produced by SPV plant over the year to the equivalent energy output at its rated capacity over the yearly period.16
So on the other side is CUF that completely ignores all these factors and also the de-rating or degradation of the panels. Therefore we are not convinced that the CUF is a good tool to provide insights into a solar PV system.
The aim of present study is to determine the temporal variation of capacity utilization factor (CUF) of PV Based Solar Power Plant with Respect to Climatic Condition.
Materials and Methods
The study of Climatic Factors and Capacity utilization Factor of Photovoltaic Based Solar Power Plant in natural scenario was studied and determined with effect of climatic factors.
The study area falls at 23° 33' 35" N latitude, 73° 17' 07" E longitude, a PV based solar power plant is located at Village- Bhatkota (Modasa) Gujarat. The monitoring of climatic factors like, solar radiation, wind velocity, Humidity and Temperature was carried out on daily basis for six months between 7:00 A.M to 6:00 P.M.
The technical information about solar PV based power plant’s detail is given in table 1.
Table 1.1: Technical information of 3 MW Solar Power Plant
|
Type of PV Module |
Polly Crystalline PV |
|
Capacity |
3 MW |
|
Capacity of Each Module - 230Wp - 240Wp - 280Wp |
Nos. 5,926 1,232 4,820 |
|
Inverters Capacity |
6 Inverters of 500KWp each |
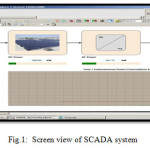
All the data was measured with the help of standard instruments and data was recorded on computer with the help of SCADA system. An integrated SCADA shall be supplied which should be capable of communicating With 6 nos 500 KW inverters and provide information of each 500 KW Power Conditioning Unit (PCU) and the Entire 3 MW Solar PV Grid connect power plant. The SCADA shall also provide Information of the instantaneous output energy and cumulative energy for each of the Inverters as well as for the 3 MW grouped Solar PV Grid connect power plant.
 |
|
Result and Discussion
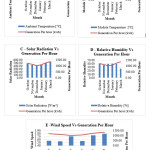
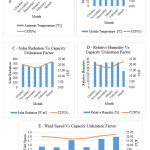
The comparative account of data analyzed is given in figure 2. The temporal variation of the capacity utilization factor with different climatic factor is shown in figure 3. The average values of the data are shown in the table 2. The correlation analysis for the data is shown in table 3. Collected data was analyzed by using standard Microsoft Excel. And also found the correlation between power generation and capacity utilization factor respectively.
The average Solar Radiation varied from 424.26 W/m² to 531.48 W/m²for the duration of October 2012 to March 2013. The minimum (424.26 W/m²) and maximum (531.48 W/m²) average Solar Radiation was recorded in December 2012 and March 2013 respectively.
The average ambient air temperature varied from 22.70 oC to 30.30 oC for the duration of October 2012 to March 2013. The minimum (22.70 oC) and maximum (30.30 oC) average ambient air temperature was recorded in January 2013 and March 2013 respectively.
The average Module air temperature varied from 28.87 oC to 38.84 oC for the duration of October 2012 to March 2013. The minimum (28.87 oC) and maximum (38.84 oC) average Module air temperature was recorded in January 2013 and March 2013 respectively.
The average Relative Humidity varied from 25.44 % to 40 % for the duration of October 2012 to March 2013. The minimum (24.44 %) and maximum (40 %) average Relative Humidity was recorded in March 2013 and October 2012 respectively.
The average Wind Speed varied from 1.54 m/s to 1.79 m/s for the duration of October 2012 to March 2013. The minimum (1.54 m/s) and maximum (1.79 m/s) average Wind Speed was recorded in November 2012 and March 2013 respectively.
The average Total Generation varied from 12209.46 KWh to 16137.80 KWh for the duration of October 2012 to March 2013. The minimum (12209.46 KWh) and maximum (16137.80 KWh) average Total Generation was recorded in December 2012 and March 2013 respectively.
The Capacity Utilization Factor (CUF) varied from 16.96 % to 22.41 % for the duration of October 2012 to March 2013. The minimum (16.96 %) and maximum (22.41 %) Capacity Utilization Factor (CUF) was recorded in December 2012 and March 2013 respectively.
From the correlation coefficient analysis it is been revealed that the ambient air temperature and PV module temperature is highly correlated whereas ambient air temperature and humidity and wind speed is negatively correlated. The PV module shows the similar co relation with humidity and wind speed as the ambient air temperature. The correlation between ambient air temperature, PV module temperature and capacity utilization factor was found positive. Where on other hand the correlation of wind speed and capacity utilization factor was not so significant. The correlation between relative humidity and capacity utilization factor was found negative. The correlation between solar radiation and capacity utilization factor was found strongly positive.
 |
|
 |
|
Table 2: Average data of Climatic Factors
|
Month |
Solar Radiation [W/m²] |
Ambient Temp. [°C] |
Module Temp. [°C] |
Relative Humidity [%] |
Wind Speed [m/s] |
Total Generation |
CUF [%] |
|
October |
481.53 |
29.41 |
37.76 |
40.00 |
1.56 |
14428.73 |
20.04 |
|
November |
432.98 |
26.06 |
32.82 |
35.85 |
1.54 |
13485.10 |
18.73 |
|
December |
424.26 |
24.10 |
30.53 |
38.94 |
1.71 |
12209.46 |
16.96 |
|
January |
446.37 |
22.70 |
28.87 |
39.94 |
1.55 |
12919.95 |
17.94 |
|
February |
486.25 |
25.00 |
31.51 |
38.90 |
1.74 |
15008.25 |
20.84 |
|
March |
531.48 |
30.30 |
38.84 |
25.44 |
1.79 |
16137.80 |
22.41 |
Table 3: Co relation co efficient analysis between climatic factors and capacity utilization factor (CUF)
|
Ambient Temperature [°C] |
Module Temperature [°C] |
Solar Radiation [W/m²] |
Relative Humidity [%] |
Wind Speed [m/s] |
CUF [%] |
|
|
Ambient Temperature [°C] |
1 |
|||||
|
Module Temperature [°C] |
0.99 |
1 |
||||
|
Solar Radiation [W/m²] |
0.74 |
0.75 |
1 |
|||
|
Relative Humidity [%] |
-0.63 |
-0.63 |
-0.67 |
1 |
||
|
Wind Speed [m/s] |
0.25 |
0.24 |
0.56 |
-0.56 |
1 |
|
|
CUF [%] |
0.76 |
0.75 |
0.96 |
-0.67 |
0.51 |
1 |
Conclusion
From the above study it can be concluded that there is significant temporal variation in capacity utilization factor with respect to climatic condition. The variation of CUF is highly correlated with solar radiation and the correlation coefficient derived between solar radiation and CUF was found strongly positive. The CUF variation was also compared with ambient air temperature and module temperature, the variation was moderately positively correlated. While the variation among humidity and wind velocity did not affect much to the CUF variation and they are found negatively correlated to each other.
References
- Huang B.J., P.E. Yang, and Y.P. Lin, Solar cell junction temperature measurement of PV module, International Solar Energy Society, 85(2) :388–392 (2010)
CrossRef - Hussain M. Z., Omar A. M., Zain Z. M., Shaari S. Performance of Grid-Connected Photovoltaic System in Equatorial Rainforest Fully Humid Climate of Malaysia, International Journal of Applied Power Engineering 2(3):105-114 (2010)
- Jafari Fesharaki, Majid Dehghani, The Effect of Temperature on Photovoltaic Cell Efficiency, Proceedings of the 1st International Conference on Emerging Trends in Energy Conservation – ETEC Tehran, Tehran, Iran, 20-21 (2011)
- Israel-Cookey, Omubo-Pepple and G. I. Alaminokuma., Effects of Temperature, Solar Flux and Relative Humidity on the Efficient Conversion of Solar Energy to Electricity, European Journal of Scientific Research, 35(2), 173-180 (2009)
- Skoplaki, J.A. Palyvos, Temperature dependence of photovoltaic module electrical performance: A review of efficiency/power correlations. Solar Energy, 83(9):614–624 (2008)
- Malik Q, Lim Chee Ming, Influence of Temperature on the Performance of Photovoltaic Polycrystalline Silicon Module in the Bruneian Climate. Asian Journal of Science and Technology, 26 (2):61-72 (2010)
- Makhlouf, F.Messai, H.Benallai, Modeling and simulation of grid-connected photovoltaic distributed generation System, 45 (2), 2012.
- Ettah B., Udoimuk A.B., J. N. Obiefuna, F. E. Opara. The Effect of Relative Humidity on the Efficiency of Solar Panels, Universal Journal of Management and Social Sciences. 2(3): 2216-2247 (2012)
- Rahnuma Siddiqui, Usha Bajpai, Statistical Analysis of Solar Photovoltaic Module Output with Temperature, Humidity and Wind Velocity in Composite Climate, European Journal of Scientific Research, 80(4): 447-456 (2009)
- Robert N. Meroney and David E. Neff, Wind effects on roof-mounted solar photovoltaic arrays: CFD and wind-tunnel evaluation, The Fifth International Symposium on Computational Wind Engineering (CWE 2010).
- Qingrong Liu, Effects of Photovoltaic System Introduction in Detached Houses with All-Electrified Residential Equipment in Japan (2008)
- Safak S., Meteorological Parameters Effects on Solar Energy Power Generation, 10(9): 637-649 (2011)
- Jasvir Singh, Study and Design of Grid Connected Solar Photovoltaic system at Patiala, Punjab”, Thesis, Thapar University, Patiala (2010)
- Randall J. JACOT the performance and modeling of photovoltaic material under variable light intensity and spectra, International Journal of Research in Mechanical Engineering & Technology, 1(1): 332-342 (2011)
- Mohamed Ali Mussa, Ibrahim M. saleh, studied on the Impact of temperature variation on PV-module parameters and performance, Center for Solar Energy Studies, Tripoli – Libya, 112-115 (2012)
- Katkar A.A, N.N. Shinde, Dr.P.S. Patil, Performance & Evaluation of Industrial Solar Cell Temperature and Humidity, International Journal of Research in Mechanical Engineering and Technology, 1(1): 69-73 (2011)


