Carbon Sequestration Potential and Edaphic Properties Along the Plantation Age of Rubber in Tripura, Northeastern India
Bal Krishan Choudhary1 * , Koushik Majumdar2 and Badal Kumar Datta1
1
Department of Botany,
Tripura University,
Suryamaninagar,
799 022
Tripura
India
2
Centre for Bamboo Cultivation and Resource Utilisation,
Tripura University,
Suryamaninagar,
799022
India
http://dx.doi.org/10.12944/CWE.11.3.10
India is voluntarily committed towards reducing carbon emission. Rubber plantation could be an important means for carbon sequestration at state and national level. Tripura holds second position as rubber grower state in India, spreading over 72273 hectare areas. Present study designed to estimate the carbon storage potential, sequestration rate and some selected edaphic properties under four different aged rubber plantations viz. HB05, HB10, HB15 and HB20, following stratified random sampling methodology. Total, 40; 100×10 m transects were laid for estimation of biomass carbon stock and transects were further subdivided in to five equal quadrates 20×10 m sized for sampling soil. The stand structural variables like mean girth size, height, basal area, tree carbon and overall carbon stock significantly varied among the different aged rubber plantations. The periodic annual increment in terms of carbon sequestration was estimated at the rate of 2.97, 3.30, 3.14 and 2.82 (Mg C ha-1 yr-1). The result indicated that total carbon stock in rubber plantation was 202.48 Mg ha-1, out of which tree carbon shared 41.85 and Soil Organic Carbon (SOC) 160.71 Mg ha-1 respectively. SOC did not show any significant variation along the plantation ages. The study suggested that the potentiality of carbon sequestration of rubber plantation in Tripura has immense scope for future carbon credit and incentives.
Copy the following to cite this article:
Choudhary B. K, Majumdar K, Datta B. K. Carbon Sequestration Potential and Edaphic Properties Along the Plantation Age of Rubber in Tripura, Northeastern India. Curr World Environ 2016;11(3). DOI:http://dx.doi.org/10.12944/CWE.11.3.10
Copy the following to cite this URL:
Choudhary B. K, Majumdar K, Datta B. K. Carbon Sequestration Potential and Edaphic Properties Along the Plantation Age of Rubber in Tripura, Northeastern India. Curr World Environ 2016;11(3). Available from: http://www.cwejournal.org/?p=16369
Download article (pdf) Citation Manager Publish History
Introduction
The Kyoto Protocol is an international treaty, which extends the 1992 United Nations Framework Convention on Climate Change (UNFCCC). India is listed in Non-Annexure I parties without binding target. In recognition of the growing problem of Climate Change, India declared a voluntary goal of reducing the emissions intensity of its Gross Domestic Product (GDP) by 20–25%, over 2005 levels, by 2020, despite having no binding mitigation obligations as per the convention.each 29 state of the country are having State Action Plan on Climate Change (SAPCC) are envisioned to encompass the vision of the National Action Plan for Climate Change (NAPCC). Key sectors covered by SAPCCs include agriculture, water, habitat, forestry, and health and disaster management among others.
India has a vision to create an additional carbon sink of 2.5 to 3 billion tonnes of Carbon dioxide (CO2) equivalent through additional forest and tree cover by 2030. To meet that vision rubber plantation could be considered as Kyoto forest to harvest atmospheric CO2.In the past two decades (1990–2010), global demand for tree cash crop products has increased dramatically, for example a production area for rubber has increased by 143% (9.4 Million hectare).1 Despite the large extension of land covered by rubber,the environmental and socioeconomics impacts of rubber expansion have recently been explored at variousscales.2,3,4
It is matter of concern that land-cover transitions to rubber monocultures may result in significant losses of above ground5 and below ground6 carbon stocks and biodiversity.7,8 Deforestation and burning of natural tropical forests has significant impact on the global carbon cycle by decreasing the above- and below-ground carbon stocks and by increasing rates of carbon emissions to the atmosphere.9 The negative ecological and environmental implications of converting primary and secondary forests into rubber plantations have been suggested asloss of biodiversity10 and total carbon biomass,11 alteration of the hydrological cycle8 and rapid soil erosion12,13 Globally, carbon stocks in terrestrial vegetation are 466 giga tons carbon and in the soil down to a depth of 1 meteris about 2011 giga tons carbon.14 Moreover, some studies also reported that rubber plantations have the greater potentially for sinking of atmospheric carbon.15 Southeast Asia regionhave stocked above ground carbon in mature rubber plantations in the range between 25 to 143 Mg ha-.16 In Tripura, a north eastern state of India, rubber plantation was introduced in 1963 by the forest department to check soil degradation due to slash and burn agriculture practiced by the local tribal people.17 Rubber is an important cash crop in the economy of Tripura, cultivated in more than 70,000 hectare area over hill slopes, hillocks and plains.18 During 2010-11, about 11,673 ha land was brought under natural rubber plantation, which produced 1595 million tonne rubber with a value of 41.22 crore. Upto 2015, total 72,273 ha (more than 8 %) of land planted with rubber, which produced around 40,000 tons of rubber worth rupees 480 crore.19 Some studies have acknowledged that the rubber plantations have immense potentially for sinking of atmospheric CO2.15,20 Tripura has drastically adopted rubber cultivation, initiated by the forest department to check soil degradation due to slash and burn agriculture practices followed by the local tribal people, and also as a part of their rehabilitation programme.18 The biomass stocked by rubber trees is highly variable, depends upon plant age, species, density, health and nutritional state, environmental condition and management techniques.In background of the above information we tried to (1) estimate the carbon sequestration potential different aged plantations; (2) to analyse edaphic properties in plantations (3) to analyse the relationship between plantation age, ecosystem carbon and edaphic properties.The study will increase the understating in rubber plantations, especially in northestern part of India.
Methodology
Study Area
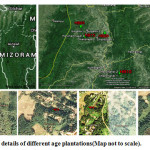
Tripura is the India’s second largest producer of rubber, located in the northeast part of the country. The State lies approximately between the latitudes 22º 56' and 24º 32' N and between longitudes 91º0' and 92º 22' E in the north east extension ranges of Himalaya. It is bound on the North West, south and south-east by Bangladesh, where as in the east it has a common boundary with Assam and Mizoram. It is the land of high hills, hillocks and patches of plains interspersed with rivers and valleys having moderately warm and humid climate.
 |
|
According to the census report 2010-2011 the total population of the state was 36.71 lakh. The indigenous tribal populations living in the hills have traditionally derived their livelihood from floral and faunal resources of the state. The present study was conducted in Gournagar Rural Development Block of Unakoti Districts of Tripura (Figure 1).The climate of the whole year of the state may be divided into four seasons. December to February is the cold season which is followed by summer season (March-May), June to September is the monsoon season and October to November is the post monsoon period. The cold weather starts by the end of November and continues to February with daily maximum temperature of 26ºC and minimum 8-4ºC. During summer season (March-May), maximum temperature is 38ºC. Humidity is high throughout the year and in summer season the relative humidity ranges 50-75% while in monsoon period they are over 85%. State receives an average of 247.9 cm rains within a year. About 63% of the annual rainfall is caused by the south-west monsoon. The mean wind speed is 7.1 km hr-1, with maximum of 13.1 kmhr-1 in May and minimum of 3 kmhr-1 in December.
 |
|
Rubber biomass carbon estimation
The quantification of the aboveground tree biomass was completed in February 2013. At the time of sampling the plantations were 05, 10, 15 and 20 year old. Stratified random sampling methodology was adopted for the study.In four aged rubber plantation, 40 permanent plot of 50x20 m (0.1 hectare) were fixed and further divided in to five equal areas of 20x10 m set for soil sampling. Out of 40 transects, 10 transects were laid in each aged plantation. In each transact, circumference at breast height (CBH) and tree height using altimeter was measured. The following regression model was used for the estimation of biomass of different aged Hevea brasiliensis plantation: Y = –3.84 + 0.528 • BA + 0.001 • BA2 (R2= 0.99); where, Y = aboveground dry matter, kilogram per tree and BA= basal area per tree.21 The basal area was calculated as CBH2/ 12.56.22 The present growth rate of a stand at any particular age is often abbreviated as Cumulative Annual Increment (CAI) orPeriodic Annual Increment (PAI). The Periodic annual increment was calculated as PAI= (B2-B1)/ (Y2-Y1); where, Where: B1 is the biomass stocked at times 1 and 2 and T1 represents the year starting the growth period, and T2 is the end year23. The total carbon stock and annual sequestration rate was estimated using plantation area and average value of biomass carbon in different aged plantation.
Soil sampling and analysis
Soil cores were divided into four depth profiles of 0–10, 10–30, 30–50 and 50-100cm from four locations (5 position x5 layer x 4 aged plantations = 100 soil samples). Soil was thoroughly mixed and the large fragments of plant materials, roots were removed by hand-sorting. Field-moist samples were gently crumbled manually and sieved to remove root material. Samples were homogenized and air-dried, ground and passed through 2 mm sieve and five replicates of each sample were analyzed. Undisturbed soil core samples were used for field bulk density analysis. For each depth five replicates of each composite were analyzed. The SOC was estimated by wet oxidation method.24 Dry soil bulk density (g cm-3) at 105ºC was estimated by the core method.25 Soil texture analysis was done by Bouyocucos hydrometer method.26 Texture class was determined using the triangular diagramme by Tropical Soil Biology and Fertility (TSBF) manual.6 The stock value on mega gram per hectare (Mg C ha-1) basis was calculated by following standard method.6 Soil pH was measured in 1M KCl suspension of 1:5 (soil: liquid) using a pen type digital pH meter (Hanna- Hi96107). Soil moisture was calculated on dry weight basis27and soil temperature for each depth profile was measured using soil thermometer (Model 6310). One way analysis of variance (ANOVA) was done to compare the means of structural variables, carbon pools and other edaphic properties in different aged group rubber plantations. All statistical analysis was performed by PAST version 1.89.28
Results and Discussion
Stand Structure and Carbon Stock
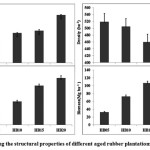
The details of the values for different structural variables and carbon stock are given in Table 1& Figure 2. The mean girth in different plantation age significantly differed (ANOVA, F 3, 36 = 2125; p <0.01) and its value ranged from 37.96±0.64 (HB05) to 96.77±2.44 (HB20).The mean tree height of the rubber varied significantly (ANOVA, F 3, 36 = 336.6; p <0.01) (from 37.96±0.64 cm to 96.77±2.44 cm and 5.36±0.08 meter to 12.25±0.25 in HB05 and HB20 respectively. The basal area ranged from 6.10±0.98 (HB05) to 38.47±5.77 (HB20) and its value also significantly varied among the plantations (ANOVA, F 3, 36 = 67.45; p <0.01). The variation in structural variables may be attributed to stand age. The stand density did not showed any variation ((ANOVA, F 3, 36 = 1.90; p <0.15) and its value ranged from 519.00±75.93 (HB05) to 502.00±76.99 (HB20). This may be attributed to the management practice of rubber plantation, where uniform tree density is recommended.
Table 1: Showing the value (Mean± SD) of carbon stock and sequestered in different aged rubber plantations.* Means are significantly different ANOVA (df-3, 36; p< 0.05).
|
Structural Properties |
HB05 |
HB10 |
HB15 |
HB20 |
ANOVA |
|
|
F value |
P value |
|||||
|
Mean CBH (cm) |
37.96±0.64 |
67.83±2.35 |
93.87±1.31 |
96.77±2.44 |
2125 |
<0.01* |
|
Mean Ht(m) |
5.36±0.08 |
7.65±0.31 |
8.22±0.97 |
12.25±0.25 |
336.6 |
<0.01* |
|
Density (stand ha-1) |
519.00±75.93 |
505.00±73.37 |
460.00±71.49 |
502.00±76.99 |
1.90 |
<0.15 |
|
BA(m2 ha-1) |
6.10±0.98 |
19.21±3.29 |
32.22±4.11 |
38.47±5.77 |
67.45 |
<0.01* |
|
Tree Carbon (Mg C ha-1) |
16.34±2.54 |
36.23±5.89 |
53.35±7.68 |
61.53±9.20 |
99.09 |
<0.01* |
|
SOC(Mg C ha-1) |
160.63±27.02 |
144.83±19.48 |
162.03±16.90 |
176.74±6.66 |
2.19 |
<0.14 |
|
Total Stock (Mg C ha-1) |
176.98±26.20 |
187.09±25.70 |
215.48±27.64 |
237.04±25.04 |
9.01 |
<0.01* |
The tree carbon stock varied significantly ((ANOVA, F 3, 36 = 99.09; p <0.01) was lowest for HB05 (16.34±2.54 Mg C ha-1) and highest for (61.53±9.20 Mg C ha-1), with a mean value of 41.85±6.33 Mg C ha-1. The total carbon stock among the four aged rubber plantation also varied significantly (ANOVA, F 3, 36 = 9.01; p <0.01) ranged from 176.98±26.20 Mg C ha-1 (HB05) to 220.04±25.04 Mg C ha-1 (HB20) with a mean value of 176.98±26.14 Mg C ha-1. The soil organic carbon stock did not showed significant variability (ANOVA, F 3, 36 = 2.19; p <0.01) and its value ranged from 144.83 Mg C ha-1 in HB10 to 176.74 Mg C ha-1 in HB20.
Carbon sequestration potential
The carbon stock in tree layer ranged from 16.34±27.02 (HB05) to 61.53±9.20.This result falls in the range of other reported values of biomass as the calculated one time averaged rubber biomass value was 97 Mg C ha-1 in a Xishuangbanna study site for a 25-year period.29 The tree carbon shared about 9.30, 20.36, 25.30 and 25.86% of total carbon stock in HB05, HB10, HB15 and HB20 aged rubber plantation with a mean value of 20.87%. The periodic annual increment analysis showed that the four aged rubber plantation accumulated 3.17, 3.98, 3.42 and 1.64 Mg C ha-1 yr-1. With increase in age, the carbon sequestration potential was decreasing. This result is similar to other study as in north east India, Dey20 estimated total biomass accumulation rate for 6 year and 17 year old rubber plantation was 3.58 megagram per hectare per year (Mg ha-1 yr-1) and 4.48 Mg ha-1 ya-1 respectively. Whereas total reported value for above ground biomass in Tripura is 44.4 and 170 Mg ha-1 for 6 year and 17 year rubber plantation, respectively20. The estimation of CO2 equivalent carbon sequestration revealed that HB05, HB10, HB15 and HB20 sequestrated 58.81, 130.41, 192.05 and 221.50 Mg CO2 equivalent ha-1 yr-1, with a mean value of 140.49 Mg CO2 ha-1 yr-1. The rate of periodic annual CO2 equivalent carbon sequestration was 11.67, 14.32, 12.33 and 5.89 megagram CO2 equivalent ha-1 yr-1 for HB05, HB10, HB15 and HB20 with a mean value 11.39 megagram CO2 equivalent ha-1 yr-1. It shows a steady increase in the CO2sequestration and increase of carbon stock in young and mid-age rubber plantations.
Soil Texture
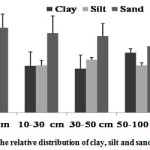
The soil texture is the important indicator of soil health.30 It is relatively stable natural attributesreflecting soil parent material sources and some characteristics derived from pedogenesis. The soil texture was estimated only for HB20. The soil of the HB20 ranged from loam to sandy loam texture. The clay, silt and sand content were 24.84, 28.41 and 46.75%, respectively (Figure3).The percent clay content increased (21.9-26.8) with increase in soil depth (0-10 to 50-100 cm), silt content remains unchanged and sand content decreased (49-46.75) with increase in soil depth (0-10 to 50-100 cm). Relation between soil organic carbon and soil texture has been attributed to chemical stabilisation of soil organic carbon by physico-chemical adsorption of soil organic carbon on soil clay or mineral surface.31 These relations have showed that clayey soil has more potential for carbon storage than sandy soil.32 Therefore the percentage of clay content or alternately clay and silt are good predictor for carbon.32 The reported value of soil particles is comparable to other study. Yasin et al., (2014)32 have reported that the sand content was relatively high in 10(25.99%) and 15(25.08%) year old rubber plantation than 20 years (24.0%). Clay content decreased with increase in age from 10 to 15 years. This was may be due to fact that open canopy directly led to washout of clay particle due to leaching from top to lower layers. Chaudhuri et al., (2013)18 have reported that soil texture changed along with the age and loamy sand soil (with sand, silt and clay content 78.18, 6-11 and 5-15%, respectively for 3 and 10 year old rubber plantation. The 14 and 20 year old year old plantation had sandy soil (sand (86-90%), silt (5-7%) and clay (4-7%).Joshi et al., (1993)33 reported that the loss of soil fine particle may led to reduction in the soil moisture content.
 |
|
Soil pH
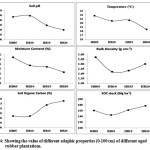
The study area was having low value of pH and soils were highly acidic in nature. In complete profile, soil pH did not varied significantly (ANOVA, F 3, 16 = 3.14; p =0.06) among the plantations. The region experiences high rain fall, which may washout the aluminium content from the soil, leads to high acidity or low pH value. In complete profile, the soil pH ranged from 4.93±0.61 (HB05) to 4.40±0.18 (HB20) and with increase in the age, its value decreased (Figure 4). This result indicates that decomposition product of organic matter such as organic acids in soil also can play a role as soil pH regulator.This may be due to addition of different phenolic compounds through leaf litter decomposition. The process of extensive humification and acidification is common phenomena in rubber plantation which led lower the value of soil pH.34,35 Varghese36 in their study on five year old Rubber Plantation from Tripura showed that there was not any definite pattern of pH across soil depth (range 4.22 to 4.80) but percentage of carbon decreases with depth and it varies from 0.97 (0-18 cm) to 2.11 (36-54 cm). The other study from Tripura also reported that the soil of the mixed forests in surrounding of rubber plantation was highly acidic (pH 4.62 ± 0.006) and sandy clay loam in texture.37 In this study, soil pH decrease with increase in temperature. This result is contrary to the finding of other study, where increase in soil temperature led to decline in soil pH.38 Yasin et al., (2014)32 reported that soil pH increased following the age of rubber plantation from 5 to 20 years, whereas Chaudhuri et al., (2013)18 reported that pH did not show any definite pattern with increase in the age of rubber plantation.
Soil Temperature
Soil temperature is the important as it controls many biophysical processes occurring in to the soil. Soil temperature is inversely related with soil carbon (Burke et al., 1989), but trend is uncertain. The soil temperature did not significantly differed (ANOVA, F 3, 36 = 31.42; p <5.78) and its value ranged from 21.80±0.7 (HB05) to 18.44±0.2 (HB20) (Figure 5). The high temperature in young plantations can be explained by the fact that young aged group were having lower leaf area index than older one. In fact older rubber plantations usually have lower leaf area index than natural forests39 (Figure 4).We did not investigate the relation between soil temperature and soil texture, but other study confirms that there is no relation between these two parameters.38
Moisture Content
Soil moisture content increase with depth and decreased with age groups. Chaudhuri et al., (2013)18 reported that soil moisture increased from 15.80 to 17.41% and soil temperature decreased from 27.14 to 24.81â°C with increase in the age of rubber plantation from 3 to 25 years. The valueof soil moisture content did not significantly varied ((ANOVA, F 3, 36 = 2.84; p = 0.08) among the plantations. The value ranged from 19.46±2.35 (HB05) to 16.31±0.58 (HB20). The increase in soil moisture content with depth was may be due to the fact that in younger rubber plantation maximum root density is found in top 30 cm soil depth. Further the rubber plantation has other concerns over primary forest like high 15-17% high evapo-transpiration rate.13 The physiology of rubber tree is like that, it cannot hold the water in the tree.13
 |
|
Bulk Density
Bulk density is the measurement of compactness of soil particle.It varies spatially and temporally.40 Assessment of soil bulk density is also required if soil carbon is tobe expressed on a volume or area basis if carbon concentration is known. It did not showed any specific trend irrespective of soil depth and age of plantations. The value ranged from 1.57±0.06 (HB05) to 1.42±0.06 (HB10) and its value significantly varied (ANOVA, F 3, 16 = 5.82; p <0.01) among the plantations. Yasin et al., (2014)32 have reported that bulk density gradually decreased from 5 to 20 years rubber plantation in 0-20 cm soil depth. The lower value of bulk density in the young plantation may be due to fact that it was strongly affected by land preparation which may destroy soil structure.
Carbon stock
Soil organic carbon (%)in complete profile increase with increase in age of plantation and its value ranged from 1.02±0.15 (HB05) to 1.18±0.02 (HB20). The carbon content in soil did not varied significantly (ANOVA, F 3, 16 = 1.87; p = 0.18). This result is contrary to the other findings as decrease in carbon is resulted from intensified rubber plantation in Southeast Asia.41 According to Chadwick (1998),42 the major source of organic residues in plantations comes from the decomposition of leaf litter that is accumulated on the surface of the soil.Managing soil carbon is central for sustainable land management as it influences numerous soil properties. Soil organic carbon estimation is crucial parameter in two ways; first it gives information about the soil health and soil qualityand second it tells about the amount of carbon stocked in soil profile. The soil carbon stock in complete profile did not varied significantly (ANOVA, F 3, 16 = 2.19; p = 0.14) ranged from 160.63±27.02 (HB05) to 176.74±6.66 (HB20) (Figure 5). This signifies that carbon content and stock in rubber plantation in not influence by age.
 |
|
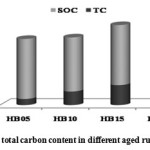
Increasing of carbon content on 20 years old rubber plantation was related to returning of biomass throughleaves and branches which decomposed in site of the land.Improving the predictability of SOC stock changes and their controls are crucial to achieving more robust carbon accounting methods. The carbon stock in soil ranged from 144.83±19.48 (HB10) to 176.74±6.66 (HB20). The highest value of carbon stock potential in HB20 plantation showed that over a period of 20 years the soils of rubber plantation can accumulate considerable amount of carbon.Rubber cultivation is done for improving household income and eliminates poverty, but when it is coupled with carbon stocks and sequestration, it provides a base for carbon trading options. It is estimated that the carbon payments is required to equal the potential rubber revenue for local farmers.42 They conclude that the prices in the carbon market would have to be considerably larger than they are currently to compete with the profitability of rubber.
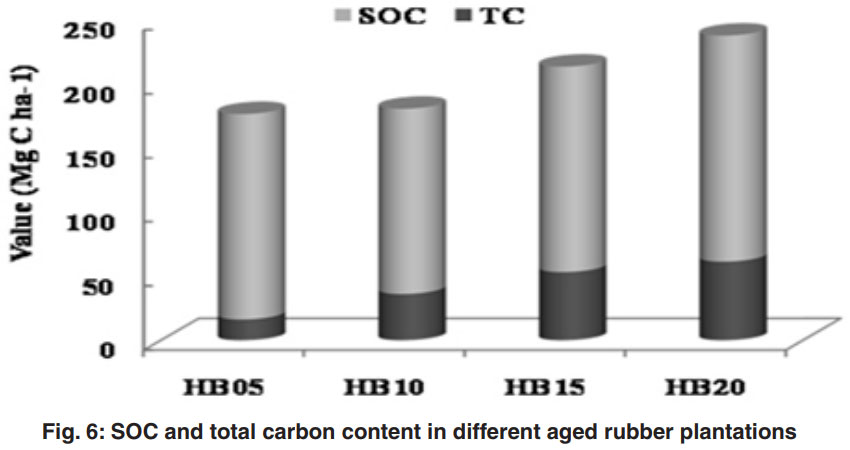 |
Fig. 6: SOC and total carbon content in different aged rubber plantations. Click here to View figure |
Institutional involvement
Rubber board established one man office in Tripura in the year 1967 and set up its regional office in 1979 at Agartala. Rubber has attained the status of the most important plantation crop in the state during the last three decades due to its commercial importance and its successful application for economic rehabilitation of shifting cultivators and weaker section of people. The rubber plantation was started by forest department. Later on (1976), Tripura Forest Development and Plantation Corporation Limited (TFDPCL) was established and during 2014-15, purchased latex from 933 Tribal beneficiaries. Presently TFDPCL has beneficiary plantation over 2116 ha covering 1602 beneficiaries. It also set up a rubber wood factory in 2006, with a production capacity of sawing 2,40,000 cubic feet round log per annum and a production of 24,000 panel board, 6000 beams, 9000 doors, and various other products. Presently the factory has turnover of more than 7 crore. Replanting has done over 235.70 ha area during 2014-15 and 281.60 ha during 2015-16. The employment generation includes 1800 leave card holder worker and more than 3000 casual workers employed regularly. Besides, 51 carpenters and 3 PPP with 12 carpenters have been regularly working in TFDPCL. During 2014-15, man days generation was 6.27 lakhs. Tripura rehabilitation and Plantation Corporation was established in 1983 for Rubber based economic rehabilitation of Jhumia tribal. Presently TRPC Ltd has 7121 ha covering 6381 beneficiaries. Total area identified by the National Bureau of Soil Survey & Land use planning, Nagpur in Tripura is 1 lakh hectare.
Conclusions
This study provides comprehensive estimates of carbon stock and carbon sequestration potential of four different aged rubber plantation. India is to put forests at the centre of its plans to mitigate the worst effects of climate change by encouraging more “green cover” and reducing the carbon intensity of its development. The different aged plantation has considerable amount of carbon stock and sequestration potential, so along with generation of livelihood, the environmental services should be acknowledged.India has been successful in improving carbon stock in its forest by about 5%, from 6,621.5 million tons in 2005 to 6,941 million tonnes in 2013. Initiatives like Green India Mission (GIM) aim to further increase the forest/tree cover to the extent of 5 million hectares (mha) and improve quality of forest or tree cover on another 5 million hectare of forest/non-forest lands along with providing livelihood support. It is expected to enhance carbon sequestration by about 100 million tonnes CO2 equivalent annually. In this study estimated an average value in terms of CO2 sequestration is 536591 Mg yr. Although this is only a conservative estimation the accurate estimation can only be done by estimation of emission of carbon from rubber plantation area of Tripura. The edaphic properties of soils are influenced by the age of rubber plantation. It can be concluded that proper management of rubber plantation could a useful tool for carbon emission mitigation.The information of carbon stock and sequestration should be accomplished by other studies like carbon emission and carbon stock in necromass.Farmers are suffering from the price fall of natural rubber, so incentive should be given to them, which would further improve their life quality.Quantification of rubber plantation carbon stocks and sequestration provides a base for carbon trading options. Yi (2014)43, estimated the carbon payments required to equal the potential rubber revenue for local farmers by comparing three land-use scenarios. They conclude that the prices in the carbon market would have to be considerably larger than they are currently to compete with the profitability of rubber. Environmentalists tend to believe that planting rubber will induce more carbon release, lead to severe drought, and harm the environment, whereas the government states that rubber plantations are forests just like any other natural forest and will not cause any threat to environment. The details of rubber plantation on micro environment have been recently assessed2. Rubber plantation will provides an effective tool for enhancing the economic, social and environmental values but, further investigation on the of socioeconomic and environmental sustainability of rubber plant should further be investigated.
Acknowledgment
The author(s) acknowledge the support and help received from Tripura University, India, Tripura Forest Development & Plantation Corporation Limited, Government of Tripura, Indian Meteorological Department, Agartala station, India. A special thanks goes to Mr. Rameshwar Das, Managing Director, TFDPCL for sharing his experiences.We are also thankful to Mr. Sajal Majumder and Mr. Gopal Das for assisting in field works.
References
- Food and Agriculture Organization (2013), Food and Agriculture Organization of the United Nations Statistical Database (28/09/2009). Available at faostat.fao.org.Accessed March 3, 2015.
- Majumder, A., Datta, S.,Choudhary, B. K. &Majumdar, K.,Do Extensive Rubber Plantation Influences Local Environment? A Case Study from Tripura, Northeast India, Current World Environment, 9(3), (2014)
- Liu, W, Hu, H., Ma, Y., &Li, H., Environmental and socioeconomic impacts of increasing rubber plantations in Menglun Township. Mountain Research and Development,26(3): 245–253(2006)
CrossRef - Li, H., Aide, T.M., Ma, Y., Liu, W., &Cao, M., Demand for rubber is causing the loss of high diversity rain forest in SW China. Biodiversity and Conservation,16(6): 1731– 1745 (2007)
CrossRef - Bunker, D.E., DeClerck, F., Bradford, J.C., Colwell, R.K., Perfecto, I., Phillips, O.L., Sankaran, M.,& Naeem, S., Species loss and aboveground carbon storage in a tropical forest. Science,310: 1029– 1031 (2005)
CrossRef - Guo, L.B., &Gifford, R.M., Soil carbon stocks and land use change: a meta-analysis. Global Change Biology,8: 345–360(2002)
CrossRef - Li, H., Ma, Y., Aide, T.M., &Liu, W., Past, present and future land use in Xishuangbanna, China and the implications for carbon dynamics. Forest Ecology and Management,255(1): 16–24 (2008)
CrossRef - Ziegler, A.D., Bruun, T.B., Guardiola-Claramonte, M., Giambelluca, T.W., Lawrence, D.,& Nguyen, ThanhLam., Environmental consequences of the demise in Swidden agriculture in SE Asia: geomorphological processes. Human Ecology,37(3): 361– 373(2009a)
CrossRef - Houghton, R.A., &Hackler, J.L., Emissions of carbon from forestry and land use change in tropical Asia. Global Change Biology,5:481–92(1999)
CrossRef - Wu, Z. L., Liu, H. M., &Liu L.Y., Rubber cultivation and sustainable development in Xishuangbanna, China. International Journal of Sustainable Development and World Ecology,8: 337–345(2001)
CrossRef - Mann, C.C.,Addicted to rubber, Science, 325, 564–566(2009)
CrossRef - Qiu, J., Where the rubber meets the garden. 457: 246–247(2009)
- Tan, Z.H., Zhang, Y.P., Song, Q.H., Liu, W.J., Deng, X.B., &Tang, J.W., Rubber plantations act as water pumps in tropical China.Geophysical Research Letters,38:L24406(2011)
CrossRef - Bolin, B., Sukumar, R., Ciais, P., Cramer, W., Jarvis, P., Kheshgi, H., Nobre, C., Semenov, S., Steffen, W., Global perspective. In: Watson, R.T., Noble, I.R., Bolin, B., Ravindranath, N.H., Verardo, D.J.,&Dokken, D.J. (Eds.), Land Use, Land-Use Change, and Forestry: A Special Report of the Intergovernmental Panel on Climate Change. Cambridge University Press, New York, pp. 23–51(2000)
- Wauters, J.B., Coudert, S., Grallien, E., Jonard, M., &Ponette, Q., Carbon stock in rubber tree plantations in Western Ghana and Mato Grosso (Brazil). Forest Ecology and Management, 255, 2347-2361(2008)
CrossRef - Ziegler, A. D., Fox, J. M., & Xu, J., The rubber juggernaut. Science,324, 1024-1025(2009)
CrossRef - Gupta, A. K.,. Shifting cultivation and conservation of biological diversity in Tripura, Northeast India.Human Ecology, 28(4), 605-629(2000)
CrossRef - Chaudhuri, P.S., Bhattacharjee, S., &Dey, A., Chattopadhyay, S.,& Bhattacharya, D., Impact of age of rubber (Heveabrasiliensis) plantation on earthworm communities of West Tripura (India).Journal of Environmental Biology, 34: 59-65 (2013)
- TFDPCL(Tripura Forest Development and Plantation Corporation Limited), Departmental Report, (2015)
- Dey, S.K, A Preliminary estimation of carbon sequestered through (Rubber) plantation in north east region of India. The Indian Forester, 131; 1429-36,(2005)
- Schroth, G., D’Angelo,S.A., Teixeira,W.G.,Haag,D.,&Lieberei,R., Conversion of secondary forest into agroforestry and monoculture plantations in Amazonia: Consequences for biomass litter and soil carbon stocks after 7 years. Forest Ecology and Management,163: 131-150(2002)
CrossRef - Chaturvedi, A. N., & Khanna, B. L., Forest MensurationInternational Book Distributors.Dehradun.406(1982)
- IPCC, IPCC Good Practice Guidance for LULUCF (1996)
- Walkley, A., & Black, I. A., An examination of the Degtjareff method for determining soil organic matter, and a proposed modification of the chromic acid titration method.Soil science, 37(1), 29-38(1934)
CrossRef - Black, G.R.,&Hartge, K.H., Bulk density. In: Klute, A., ed. Methods of soil analysis. Physical and mineralogical methods. 2nd Madison, American Society of Agronomy, Part 1. p.363-375(1986)
- Woomer, P. L., Okalebo, J. R., & Gathua, K. W, Laboratory methods of soil and plant analysis: a working manual(2001)
- Allen, S.E., Chemical analysis of ecological materials, 2nd Oxford- Blackwell, London(1989)
- Hammer, Ø., Harper, D. A. T., & Ryan, P. D., Paleontological Statistics Software: Package for Education and Data Analysis.Palaeontologia Electronica,(2001)
- Yang, X., Cadisch, G., Blagodatsky, S., &Xu, J., Evaluation ofcarbon stock changes in Naban River Watershed NationalNature Reserve, Xishuangbanna using Rapid Carbon Stock Appraisal.Poster presented at Tropentag 2013,“Agricultural development within the rural-urban continuum”,Stuttgart-Hohenheim, Germany (2013)
- Doran, J.W., & T.B. Parkin., Defining and assessing soil quality. p. 3-21. In: J.W. Doran et al., (ed.) Defining Soil Quality for a Sustainable Environment. SSSA, Soil Science Society of America., Spec. Publ. No. 35 (1994)
- Feller, C., &Beare, M.H., Physical control of soil organic matter dynamics in the tropics. Geoderma,79, 69–116(1997)
CrossRef - Yasin, , Adrinal, Junaidi, Wahyudi E., Silvia Herlena&Darmawan., Changes of Soil Properties on Various Ages of Rubber Trees in Dhamasraya, West Sumatra, Indonesia. Journal of Tropical Soils, 15(3): 221-227 (2010)
- Joshi, M., Singh, R.P., &Bargali, S.S., Changes in soil characteristics in eucalypt plantations replacing natural broad- leaved forests. Journal of Vegetation Science, 4: 25-28 (1993)
CrossRef - Zhang, M., Schaefer, D.A., Chan, O.C., &Zou, X., Decompositiondifferences of labile carbon from litter to soil in a tropical rainforest and rubber plantation of Xishuangbanna, southwestChina. European Journal of Soil Biology, 55:55–61(2013)
CrossRef - Cheng, C.M., Wang, R.S., &Jiang,J.S.,Variation of soil fertilityand carbon sequestration by planting Hevea brasiliensis inHainan Island, China. Journal of Environmental Sciences, 19:348–52(2007)
CrossRef - Varghese, P., Rao, D.V..K.N., Varghese, M., Vinod, K.K.,Pothen, J.,&Krishnakumar, A.K., Spatial distribution of roots and nutrients in soil under Rubber plantations in Tripura. Indian Journal of Natural Rubber Research, 9(2) : 106-111 (1996)
- Chaudhuri, P. S., Nath, S., Pal, T. K., & Dey, S. K., Earthworm casting activities under rubber (Hevea brasiliensis) plantations in Tripura (India).World Journal of Agriculture Sciences, 5, 515-521(2009)
- Fissore, C., Giardina, C. P., Kolka, R. K., Trettin, C. C., King, G. M., Jurgensen, M. F., ... & McDowell, S. D., Temperature and vegetation effects on soil organic carbon quality along a forested mean annual temperature gradient in North America.Global Change Biology, 14(1), 193-205(2008)
- Rusli, N., &Majid, M.R., Monitoring and mapping leaf area index ofrubber and oil palm in small watershed area. IOP ConferenceSeries: Earth and Environmental Science,18 : 012036(2014)
- Wuest, S.B., Correction of bulk density and sampling method biases using soil mass per unit area. Soil Science Society of America Journal,73:312–316(2009)
CrossRef - Brunn, T.B., Andreas, N., Deborah, L.,&Ziegler, A. D., Environmental Consequences of the Demise in Swidden Cultivation in Southeast Asia: Carbon Storage and Soil Quality. Human Ecology, 37:375-88 (2009)
CrossRef - Chadwick, D.R., Ineson, P., Woods, C., &Piearce, T.G., Decomposition of Pinus sylvestris litter in litter bags: influence of underlying native litter layer. Soil Biology and Biochemistry,30, 47-55(1998).
CrossRef - Yi, Z.F., Wong, G., Cannon, C.H., Xu, J., Beckschafer, P., &Swetnam, R.D., Can carbon-trading schemes help to protectChina’s most diverse forest ecosystems? A case study from Xishuangbanna, Yunnan. Land Use Policy,38:646–56 (2014)
CrossRef


