Delineation of Supply chain of Pangasius in India – A case of Andhra Pradesh
Pankajkumar Mugaonkar1 * , Nalini Ranjan Kumar1 , Gauri Shelar1 , R. S. Biradar2 and K. Gopal Rao3
http://dx.doi.org/10.12944/CWE.11.3.26
The paper delineates the distribution, communication and price transmission along the supply chain. Pangasius was mainly produced and supplied from state of Andhra Pradesh to several states in India. The major share of Pangasius traded to West Bengal (73.29%) and Maharashtra (16.4%) and hence the study was restricted to these two states. The three marketing channels were identified (A, B and C) and the major volume was transacted through the channel (B). The stakeholders identified in marketing were farmers, broker, transporters, packers, ice providers, wholesalers, secondary wholesalers and retailers. Exchange of information among actors, was mainly focused on quality, quantity, prices, time of delivery and arrangements with supporting intermediaries. The every intermediary added a cost and moved it further to respective stakeholder after earning some returns. In channel (B), the profit of wholesalers and retailers was Rs. 3.08 and Rs. 6.85 per Kg, respectively whereas in channel (C), primary wholesaler, secondary wholesaler and retailer realised profit in rupees per kg of Rs. 2.31, Rs. 4.5 and Rs. 8.15, respectively. Channel (A) had shown direct sell to consumers. Price spread reflects Channel (B) (Rs. 31.2/Kg) was efficient than (C) (Rs. 34.95/Kg). Farmers opined that negligible local demand compelled farmers to sell Pangasius in distant market. Promotion of Pangasius consumption in home state and nearby states will go a long way in improving local demand and to ensure better prices. This may realise sustainable development of Pangasius in India.
Copy the following to cite this article:
Mugaonkar P, Kumar N. R, Shelar G, Biradar R. S, Rao K. G. Delineation of Supply chain of Pangasius in India – A case of Andhra Pradesh. Curr World Environ 2016;11(3). DOI:http://dx.doi.org/10.12944/CWE.11.3.26
Copy the following to cite this URL:
Mugaonkar P, Kumar N. R, Shelar G, Biradar R. S, Rao K. G. Delineation of Supply chain of Pangasius in India – A case of Andhra Pradesh. Curr World Environ 2016;11(3). Available from: http://www.cwejournal.org/?p=16423
Download article (pdf) Citation Manager Publish History
Introduction
Pangasius was introduced in India during 1995-96 from Thailand through Bangladesh. Sturdy nature and its compatibility to polyculture made this fish popular for aquaculture. The Pangasius, has emerged as one of the major candidate species in freshwater aquaculture system of Andhra Pradesh. Andhra Pradesh is also the largest farmed– fish producing state in the country. Fish farmers of Andhra Pradesh have initiated the pond farming of Pangasius since the year 2004, with a view to diversify their carp-based aquaculture, and to harness its high yield potential for domestic as well as export market. Andhra Pradesh produces more than 0.5 million tonnes of Pangasius per annum from 32000 ha of pond area, with productivity of 12.5 to 50 tonnes/ha/year.14 The Pangasius produced in Andhra Pradesh is ice-packed and transported to consumer markets in West-Bengal, Maharashtra, Bihar, Uttar Pradesh, Delhi, Assam and in some other North-Eastern states. As compared to the well-established consumer markets of the Indian major carps, the markets for the Pangasius are very limited. Supply chain analysis is important in order to know the flow of Pangasius in the domestic native markets as well as distant market in India. Efficient supply chain satisfies both consumer and producer. This article intends to delineate the supply chain by exploring distribution channel, communication networks and price spread in Pangasius supply chains. This delineation critically reflects on what is the domestic market structure and how the Pangasius is traded domestically, kind of communication flow and wealth distribution among intermediaries.
Investigation of the study was essentially driven by the questions;
1. What are the major distribution channels?
2. What are key functions of the actors involved in supply chain?
3. What is the communication flow among the actors involved in the chain?
4. What is the price spread for different channels and what is the wealth distribution among the supply chain actors?
Addressing these questions would help to better understand potential markets, infrastructure needs and viable suggestions for wealth distribution among various stakeholders. This may sustain the Pangasius production in the country.
Methodology
Primary data for the study were collected from the sample farmers of Andhra Pradesh depicted in Table 1 and supply chain intermediaries with the help of a pre-tested interview schedule. The data collected for the study pertained to the agricultural year 2012-13. To delineate the supply chain percentage analysis and schematic diagram were used. To understand the supply chains, stakeholders in supply chain of Pangasius were traced from the producer onward to consumer. Farmers were asked that where do they sell their harvest? Initiation of the supply chain investigation was done from the farmer (producer). The study was conducted at two levels in the native market Andhra Pradesh and in distant market West Bengal, and Maharashtra. Depending on the bulk movement of produce, the distant markets were selected. In the local market, i.e. in Andhra Pradesh farmers were questioned for the distribution of Pangasius. For the study in distant market, one wholesale and two retail markets were selected randomly from both the West Bengal and Maharashtra where the fish from Andhra Pradesh was being sold. Selected markets from West Bengal were Howrah fish market as wholesale and Kadamtalla and Maniktalla as retail markets. In Maharashtra Dadar fish market was selected as wholesale market and Satrasta fish market, Jogeshwari fish market were selected as retail. From the selected market, 10 wholesalers/commission agents, 10 retailers, 10 transporters 10 packers, 10 ice-providers and 10 brokers were selected. Thus a total of 100 supply chain intermediaries were selected, depicted in Table 2. Marketing cost, marketing margin, price spread, producers share in consumer rupee and wholesalers share in consumer rupee were calculated by using method of1 Marketing efficiency was worked out using Shepherd’s Index. It is the ratio of consumers’ price to total marketing cost and margins.17
Table 1: Sampling plan
|
Sl.No. |
Districts |
Mandals |
Villages |
(N=120) Sample farmers |
|
1. |
Krishna |
Kaikaluru |
Achavaram |
30 |
|
Kalidindi |
Korkollu |
30 |
||
|
2. |
West-Godavari |
Mogalthru |
Kalipatanam |
30 |
|
Kallamandal |
Bondadalanka |
30 |
Table 2: Stakeholders in Pangasius supply chain
|
Sl.No. |
Andhra Pradesh |
West-Bengal |
Maharashtra |
||
|
1. |
Broker |
10 |
Wholesaler /CA |
10 (Howrah) |
10 (Dadar) |
|
2. |
Transporter |
10 |
Retailer (Market I) |
10(Kadamtalla) |
10 (Satrasta) |
|
3. |
Packer |
10 |
Retailer (Market II) |
10 (Maniktalla) |
10 (Jogeshwari) |
|
4. |
Ice Provider |
10 |
|||
Result and Discussion
Disposal Pattern of Pangasius on sample farms
The production obtained through the sample farms of Andhra Pradesh exclusively traded in domestic markets of the country. Farmed Pangasius from Andhra Pradesh majorly traded to states such as West-Bengal, Maharashtra, Assam and Haryana. These states represent distinctive domestic markets for freshwater fishes or catfishes.
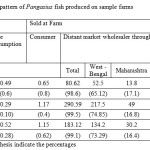
During the study it was observed that, there exist extremely well established links between the fish farmers of the state and the market intermediaries (primary and supporting actors). Physical distance between the producer and consumer responsible for “No conversations” among the two, except local consumer. Disposal pattern of Pangasius on sample fish farms was estimated and presented in Table 3. The total fish harvested on overall basis was 184.79 ton per farm.
 |
|
All the farmers were found selling their produce to the distant market of West-Bengal, Maharashtra, Assam and Haryana. Most of the produce (99.1%) sold to the wholesaler through broker. Reminder 1 per cent sold to local consumer (0.62%) and (0.28%) is used for home consumption. The Pangasius was disposed to wholesalers/commission agents, in distant market through brokers who strike the deal with farmers. Physical flow of Pangasius produced in the district of West-Godavari and Krishna were found moved to longer distances. Out of total 99.1 per cent of fish sold at farm to the wholesalers, in distant markets, mainly to the Howrah market (73.29%) followed by Dadar (16.4%), Assam (4.5%), Haryana (3.6%) and Bihar (1.9%). From the respective states wholesalers convey their demand for Pangasius to brokers or farmers in Andhra Pradesh (AP).
Two kind of clearly demarcated different actors makeup the composition of the marketing channel studied. Primary Actors: Fish farmers, Wholesaler/Commission agent, Sec. Wholesaler and Retailer. Supporting Actors: Broker/Local agent, Packer, Transporter and Commission agent.
In India, West Bengal is the major market for farmed freshwater fish.9 Since 1976, Howrah market in West Bengal sourced fish from the states like Andhra Pradesh, Uttar Pradesh, Madhya Pradesh, Bihar, Delhi, Punjab, Orissa, Tamil Nadu, Maharashtra, Rajasthan and Gujarat.3 Howrah wholesaler market is a major terminus for the fish suppliers/ fish farmers to market their produce. Kolkata retail markets have shown dominance of aquatic products on sale.9 Freshwater fishes were more dominant in fish retail markets of Howrah. IMC forms substantial part of fresh water fishes sold in Kolkata from Andhra Pradesh. This reflects the inextricable bond between Andhra Pradesh and Kolkata in fish marketing or fish business.9
 |
|
Flow of Information in Pangasius supply chain
Information flow is vital in supply chain management.4 It is also important to fulfil the information on the quality itself or on the product origin and/or handling conditions/techniques which affect the quality.13 Information flows in the fish supply chain leads to tightening of vertical relationships between chain actors and formation of vertically cooperating inter firm networks. Embeddedness of firms in networks allows rapid sharing of sensitive information with suppliers and buyers, develops appropriate level of inter firm trust, and provides an enduring competitive advantage which becomes apparent in gaining higher sales, reducing lead times and logistics costs.18 In the food sector, such networks are defined as “supply chain networks” (SCN).8
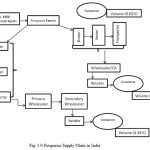
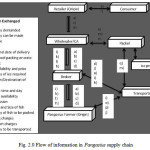
Spatially integrated markets were found to be connected through telephonic conversations. Consumers convey demand for Pangasius through retailers. Retailers based on their experience, number of consumers demanding Pangasius, frequency of demand etc. speculate the quantity required in the market. Further, retailer demand for quantity and quality of Pangasius they need from wholesalers/commission agents. Consumers trigger the information flow through the retailer. Buyer-driven chains are characteristic of labour intensive industries (and therefore highly relevant to developing countries) similarly the Pangasius or fish marketing is also buyer-driven chain.6 Wholesalers pass the information in the form of quantity and quality by ordering to brokers. In few cases wholesalers/commission agent also have direct information exchange with fish farmer. They information exchanged is depicted in fig. 2.0. Once the farmer agreed to the deal proposed by the broker on behalf of wholesaler/commission agent further arrangements begins. Wholesaler fixes the transporter and packer on his behalf or with the help of broker. Wholesaler conveys the information to packers and transporters on destination of delivery, distance, time of delivery, negotiate for charges of transportation and packing, packing preference (box packing/crate packing), quality maintenance, proper icing. Packers and ice providers share information on their requirements and availability of quantity of ice, time of delivery, quality of ice and expected prices. Packers and ice-provider after negotiation settles at one price and fixes their deal. Similarly, packer inform to transporters about their preparations of packing. Fish farmer conveys information on fish harvesting date, time, expected quantity of harvest to transporters and packers. Transporters confirm their availability to packers and to fish farmers on site on prefixed date and time. Packers give assurance of quality maintenance to fish farmer and wholesaler. Once the harvested fishes were loaded at farm site, fish farmer conveys regarding dispatch of fishes to packer and wholesaler in presence of broker. Farmers also forms the basis of information for the market, the also trigger the information flow in the market. Once the fish reaches to a marketable size farmer either contact to brokers or directly to Wholesalers/CA to inform the availability of the fish in certain quantity, quality and at certain prices. Brokers they carry forward this information to wholesalers/CA. If farmers directly contact to WH/CA there is no role of brokers in information flow. The value of the supply chain is directly related to the flow of information in both directions.16
 |
|
Price Spread across different supply chains of Pangasius
The price spread is shown in table 4, for Pangasius sold at farm directly to consumer and transported from Andhra Pradesh to Howrah (West Bengal) and Dadar (Maharashtra). When middlemen make profits, the market is at work, otherwise, the market fails to emerge.19 Pangasius was sold at different prices in different markets, depending on the distance, length of market channels, number of intermediaries and nature of services undertaken. After computing the stakeholders costs and margin at each level, Channel (A) had shown direct sell of Pangasius to consumers at farm, naturally involves no price spread or addition of any marketing cost and marketing margin. This channel had 100 per cent producers share in consumers rupee. It was found that the channel (B) has shown lowest price spread compared to Channel (C). In channel (B) supply chain have shown price spread of Rs. 34.90/Kg of Pangasius. Producer share in consumer rupee was Rs. 52.49/kg. In the chain selling price of Pangasius by farmer was (Rs.38.85/kg), wholesalers (Rs. 84.20/kg) and retailers (Rs. 73.76/kg). Wholesalers marketing cost was (Rs.16.51/kg) and retailers (Rs.3.99/kg). Among all the intermediaries of channel (B) wholesalers have earned highest share of profit i.e. Rs. 7.09/kg, which was followed by retailer (Rs. 6.85/kg). In channel (B) the retail markets are relatively closer to wholesale markets and retailers can buy the fish with ease. So, no secondary wholesaler was involved in the channel.
Identified channel (C) had shown price spread of Rs. 35.10. The higher price spread in channel (C) was due to the presence of secondary wholesaler in the channel. Producer share in consumer rupee was Rs. 52.39/Kg, wholesalers share in consumers rupee was Rs. 11.08/kg this was due to the presence of secondary wholesalers. Secondary wholesaler makes the difference in channel (C), they bought the Pangasius at an average price of (Rs. 56.5/kg). The quantity purchased was relatively larger than retailers. Marketing cost incurred, net margin received and Sale price of Pangasius of secondary wholesaler was Rs. 1.34, Rs. 8.76 and Rs. 65.50/kg respectively. The retailers supplied by the secondary wholesalers, buy Pangasius at an average price of Rs. 63.33 per kg. These retailers earned a margin of Rs. 8.15/kg, incurred marketing cost of Rs. 2.55/kg, with sale of Pangasius at price of Rs. 74/kg. These markets were located at far distance from each other. This was the major reason behind the higher retail price of Pangasius in channel (C) retail market Rs.74.00. Retail markets in channel (C) of Mumbai were spatially away from the wholesale market of Mumbai. Spatial differences between the markets led to price differences.
As discussed above differences in supply chain on the basis of number of intermediaries involved and demand-supply differences have shown skewed distribution of profits among all stakeholders of the supply chain. The current demand scenario of Pangasius among consumers raise the doubts over sustainability of Pangasius production in near future. Realisation of this was proposed by earlier studies,2,7 that along with technology and infrastructure, market would be one of the vital driving force to sustain fish production in future.
Scope of modern supply chains in India and benefits to small holders, with emergence of modern food value chains has improved linkages between buyers and poor farmers in the developing countries, which have turned out to be beneficial for the smallholders,5,11,12 Pangasius farmers were more constrained in their ability to negotiate higher prices for their fish. This negatively affected their interest in culture practices of Pangasius. In order to resolve this, farmers need to explore the opportunities for high value export chains for their produce as they do not gain expected profit in domestic or regional value chains in the country. As it was found that in Vietnam though the fishers were severely constrained in their negotiations for higher prices, they were found less vulnerable to economic and environmental change due to the social relations of trade.10 As understood through farm gate prices of last three years its clear that Pangasius marketing/demand in India is uncertain. Increased certainty over their revenue may encourages the farmers to continue the culture practice.
The most efficient marketing channel found was Andhra Pradesh marketing channel (A) where channel had two actors’ producer and consumer. Though this was the most efficient channel, there was very limited demand of Pangasius in the local market. The localities in the state haven’t shown any demand of the Pangasius. Next, most efficient channel was (B – with Marketing Efficiency 2.09) which was followed by channel (C – with Marketing Efficiency 1.9). Compared to achievements in fish production in India the fish marketing system is very poor and highly inefficient.7 Further, fish marketing is characterised by different species different prices, variations in weight & keeping quality additionally problems of high perishability, bulkiness of material, high cost of storage and transportation, no guarantee of quality and quantity of commodity, low demand elasticity and high price spread.15
Table 4: Price spread across various supply chains of Pangasius marketed from Andhra Pradesh
|
Sl.No |
Particulars |
Channel (A) |
Channel (B) |
Channel (C) |
|
|
1 |
Farmers marketing cost |
0.00
|
0.13 (0.2) |
0.13 (0.2) |
|
|
2 |
Cost of broker |
0.00
|
0.01 (0.01) |
0.01 (0.01) |
|
|
3 |
Commission of brokers |
0.00
|
0.25 (0.3) |
0.25 (0.3) |
|
|
4 |
Sale Price of Farmer |
40.00 (100) |
38.85 (52.7) |
38.9 (52.6) |
|
|
5 |
Net price received by farmer |
40.00 (100) |
38.72 (52.5) |
38.77(52.4) |
|
|
6 |
Purchased price of wholesaler |
0.00
|
38.49 (52.2) |
38.77(52.4) |
|
|
7 |
Commission agents commission |
0.00
|
0.38 (0.5) |
0 (0) |
|
|
8 |
Marketing cost of Wholesaler |
0.00 |
16.51 (22.4) |
15.7 (21.2) |
|
|
9 |
Net marketing margin of wholes |
0.00 |
7.09 (9.6) |
2.32 (3.1) |
|
|
10 |
Sale price of wholesaler |
0.00 |
62.1 (84.2) |
56.8 (76.8) |
|
|
11 |
Purchase price of Sec. WH |
0.00 |
0.00 (0.00) |
55.4 (74.9) |
|
|
12 |
Marketing cost of Sec. WH |
0.00 |
0.00 (0.00) |
1.34 (1.8) |
|
|
13 |
Net Marketing margin of Sec. WH |
0.00 |
0.00 (0.00) |
8.76 (11.8) |
|
|
14 |
Sale price of Sec. WH |
0.00 |
0.00 (0.00) |
65.5 (88.5) |
|
|
15 |
Purchase price of retailer |
0.00 |
62.93 (85.31) |
63.33(85.6) |
|
|
16 |
Marketing cost of Retailer |
0.00 |
3.99 (5.40) |
2.55 (3.4) |
|
|
17 |
Net Marketing margin of Retailer |
0.00 |
6.85 (9.29) |
8.15 (11) |
|
|
18 |
Sale price of Retailer |
0.00 |
73.76 (100) |
74 (100) |
|
|
19 |
Producer share in consumer rupee |
100.00 |
52.49
|
52.39 |
|
|
20 |
WH share in consumer rupee |
0.00 |
9.61
|
11.08 |
|
|
21 |
Price Spread |
0 |
34.90
|
35.1 |
|
|
22 |
Marketing efficiency |
- |
2.09
|
1.9 |
|
Conclusion
Andhra Pradesh majorly trade Pangasius to West Bengal, Maharashtra, Assam and Haryana. Majority of the produce is marketed to the distant markets. Direct disposal to consumers was negligible which reflects limited demand for Pangasius. Three major distribution channels were identified. The actors in supply chain earning considerable margin/profit with respect to their role in the transaction. This has sustained their interest in the supply chain. Marketing intermediaries found were, a) Primary actors; Fish Farmer/Producer, Wholesaler, Secondary Wholesaler, Retailer and consumer b) Supporting actors; Broker, Packer, Transporter, Commission agent and Ice provider. The under-reporting of price by brokers or other intermediaries will affect the farmers share in consumer rupee. The entrepreneurial efforts of these actors has significance in the marketing work. This paper explored the movement of Pangasius in the existing marketing system with the present information flow to destined markets in the presence of margin seeking intermediaries. This has brought to our attention that we need to promote the Pangasius in the home state, explore other distant markets like Punjab, Jammu & Kashmir, Chhattisgarh, for the Pangasius demand. Improve content of information flow, study the constraints faced by actors if any, reduce price spread with efficient marketing so that ultimate consumer relishes the taste of this delicious cat fish. This development needs better support through modern market facilities and huge consumer base domestic or abroad to absorb the produce.
Acknowledgement
Authors are extremely grateful to Director, ICAR-Central Institute of Fisheries Education, Mumbai for constant encouragement and support to study. The financial support received from Indian Council of Agriculture Research during the PhD work is highly appreciated.
References
- Acharya, S.S. and Agarwal, N.L., Agricultural marketing in India, Oxford & IBH Publishing Company Pvt. Ltd. New Delhi: 98-138 (2001).
- Ayyappan, S., Gopalakrishnan, A. and Ganesh Kumar, B., Species diversification in aquaculture and domestic fish marketing in India. In: MPEDA Souvenir 2009 released on the occasion of Indaqua 2009 held at Bhubaneswar, 21-23 January pp. 13-22 (2009).
- Bay of Bengal Programme for Fisheries Development (BOBP)., Marine small-scale fisheries of West Bengal: an introduction, Pp 1-34 (1990).
- Coyle, J.J., Bardi, E.J. and Langley, J., The Management of Business Logistics, Thomson South-Western, Mason, OH (2003).
- Dries, L., Reardon, T. and Swinnen, J., The rapid rise of supermarkets in central and eastern Europe: Implications for the agrifood sector and rural development. Development Policy Review, 22 (5): 525-56, (2004).
CrossRef - Gereffi, G., “The Organization of Buyer-Driven Global Commodity Chains:How U. S. Retailers Shape Overseas Production Networks”, in G. Gereffi and M. Korzeniewicz (eds.), Commodity Chains and Global Capitalism, London:Praeger. (1994).
- Kumar, G. B., Datta, K.K., Joshi, P.K., Katiha, P.K., Suresh, R., Ravisankar, T., Ravindranath, K. and Muktha Menon.,Domestic fish marketing in India – Changing structure, conduct, performance and policies, Agricultural Economics Research Review (Conference Issue.), 21: 345 – 354 (2008).
- Lazzarini, S. G., Chaddad, F. R., & Cook, M. L., Integrating supply chain and network analyses: the study of netchains. Journal on chain and network science, 1(1): 7-22 (2001).
- Little, D. C., Kundu, N., Mukherjee, M., & Barman, B. K., Marketing of fish from peri-urban Kolkata. University of Stirling, Stirling, UK, 19 (2002).
- Loc, V. T. T., Bush, S. R., & Khiem, N. T. High and low value fish chains in the Mekong Delta: challenges for livelihoods and governance. Environment, development and sustainability, 12 (6), 889-908 (2010).
CrossRef - Maertens, M. and Swinnen, J., Trade, Standards and Poverty: Evidence from Senegal, LICOS Discussion Paper No. 177, Leuven: LICOS (2006).
- Minten, B., Randrianarison, L. and Swinnen, J., Global Retail Chains and Poor Farmers: Evidence from Madagascar. LICOS Discussion Paper No.164, Leuven: LICOS (2007).
- Olafsdottir, G., Chanie, E., Westad, F., Jonsdottir, R., Thalmann, C. R., Bazzo, S., Labreche, S., Marcq, P., Lundby, F. and Haugen, J. E., Prediction of Microbial and Sensory Quality of Cold Smoked Atlantic Salmon (Salmo salar) by Electronic Nose. Journal of Food Science, 70: S563–S574 (2005).
CrossRef - Rao, A comprehensive study report Present Status of Pangasius Farming in Andhra Pradesh, India. (Submitted to NFDB) (2010).
- Ravindranath, K., Domestic marketing of fish and fishery products in India – Opportunities and challenges. In: National Workshop on Development of Strategies for Domestic Marketing of Fish and Fishery Products held at College of Fisheries Science, Nellore, India, 7-8 February: 43-48 (2008).
- Rupavatharam , S., A case study of citrus supply chain for the UK market the I.C.F.A.I Journal of supply chain management Vol 4 (2): 71-84 (2007).
- Shepherd Geoffrey, S. Marketing of Farm Products. Iowa State University Press, Ames, Iowa, USA. Pp: 246- 247(1972).
- Van der Vorst, J.G.A.J., Beulens, A.J.M., De Wit W. and P. Van Beek., Supply Chain Management in Food Chains: Improving Performance by Reducing Uncertainty. International Transactions in Operational Research 5: 487-499 (1998).
CrossRef - Wang, N., Transaction Costs and the Structure of the Market: A Case Study. American Journal of Economics and Sociology, 58: 783–805 (1999).
CrossRef


