Forecasting Runoff and Sediment Yield by ANN and Fuzzy Logic Algorithms for Kal River, India
K. D. Gharde1 * , Mahesh Kothari2 and D. M. Mahale11
1
SWE, Department of Soil and Water Engineering,
CTAE,
MPUAT,
Udaipur,
India
http://dx.doi.org/10.12944/CWE.11.3.25
The ANN and fuzzy logic (FL) models were developed to forecast the runoff and sediment yield for catchment of Kal River, India in METLAB 2.9b witting the programme supporting to nntool. The input to the models were used as daily rainfall, evaporation, temperature and one day and tow day lag runoff for runoff modelling. Whereas, for sediment yield modelling inputs in ANN and Fuzzy logic model used as daily rainfall, one and two day runoff. The inputs data for both models of 21 years (1991 to 2011) were considered in present study on daily basis. The 14 years (1991 to 2004) used in developing the models whereas rest 7 years (2005 to 2011) for validation of the models. In sediment yield modelling, 7 years (2003 to 2009) data were used for developing and validation of models. The models performance were evaluated by standard statistical indices such R, RMSE, EV, CE, and MAD. It was found that ANN model performance improved with increasing the input vectors. The fuzzy logic model was performed well with R value more than 0.95 during developmental stage and validation stage over ANN model for predicting runoff and sediment yield. Hence, FL model found to be more superior to ANN in prediction of runoff and sediment yield for Kal river.
Copy the following to cite this article:
Gharde K. D, Kothari M, Mahale D. M. Forecasting Runoff and Sediment Yield by ANN and Fuzzy Logic Algorithms for Kal River, India. Curr World Environ 2016;11(3). DOI:http://dx.doi.org/10.12944/CWE.11.3.25
Copy the following to cite this URL:
Gharde K. D, Kothari M, Mahale D. M. Forecasting Runoff and Sediment Yield by ANN and Fuzzy Logic Algorithms for Kal River, India. Curr World Environ 2016;11(3). Available from: http://www.cwejournal.org/?p=16300
Download article (pdf) Citation Manager Publish History
Introduction
The hydrological behaviour of a watershed assess on the basis of availability of water, vegetation and status of soil in relation to productivity. Accurate rainfall-runoff relationship predictions mostly depend on the availability of accurate data of rainfall and runoff. The several hydrologic models were adopted for prediction of runoff and sediment yield which cover from black-box neural network model to highly conceptualised physical based mathematical models (Porporato and Ridolfi, 2001).1 The artificial neural network (ANN) and fuzzy logic (FL) model are highly nonlinear and logistic based widely accepting in various engineering field due their simple, accurate in estimation which not based on physics equations. The developing the rainfall, runoff and sediment yield relationship interlink between each other found most important in surface hydrology. It is needed to have the knowledge of rainfall effect on runoff from watershed to avoid risk of flood and drought characteristic in changing climatic scenario. Forecasting of such non-linearity and uncertainty associated with rainfall-runoff process and sediment yield has lot of importance in surface hydrology for design of conservation structures, water harvesting dams, civil works, flood monitoring, etc (Shirk et al. 2012).2 Sinha et al (2013)3 and Chen et al (2013).4 stated that, accurate simulation of responses to surface runoff and sediment yield from watershed due to climatic parameters (rainfall, evaporation, temperature etc) is great challenge to hydrologist.
The data driven techniques are widely adopted in statistics, soft computing, computational intelligence, machine learning and data mining but recently found promising in surface and subsurface hydrology for forecasting runoff and sediment yield (Solomatine and Dulal (2003)).5 The artificial neural network (ANN) is a black box model or data driven model widely applied rainfall runoff hydrologic models (Hsu et al, 19956; Tokar and Johnson, 1999),7 runoff forecasting (Shivekumar et al, 2002),8 reservoir inflow forecasting (Jain and Srivastva, 2005),9 Sediment yield modeling (Senthil Kumar et al (2012)10; Raghuvanshi et al (2006)11; and Jain (2008).12 Luk et al. (2001)13 studied the rainfall forecasting problems by using various ANNs and discussed the accuracies and discrepancies among these neural networks. It is reported that, the multi layer feed foreword back propagation neural network found to be prices in forecasting runoff and sediment yield (Hsu et al, 1995[6]; Smith and Eli, 1995.14
The fuzzy is logical programming based relation minima maxima theory published by Zadeh (1965).15 This theory is widely found applicable in pattern recognition, data analysis, system control, etc. (Kruse et al., 199416; Theodoridis and Koutroumbas, 1999.17 The fuzzy logic theory found to more accurate in handling imprecise data or variable having uncertain relationship between each other. The most of hydrologists are still uncertain about many of the aspects of the physical processes in the watersheds and fuzzy theory has proven to be a very attractive tool in enabling them to investigate such problems. Now a day fuzzy logic approach was applied in water resources (Nayak, et al 2005,18 Zhu and Fujita, 199419; See and Openshaw, 199920; Stuber et al., 200021; Hundecha et al., 2001,22 mamdani approaches in predicting runoff and sediment yield (Nayak et al, 200518; Mamdani and Assilian, 1975)23; it also to flood forecasting (Chang et al. 2005)24; precipitation forecasting (Maskey et al. 2004)25; sediment transport (Tayfur et al. 2003),26 reservoir operation (Tilmant et al. 2002),27 and storm water infiltration estimation (Hong et al. 2002)28 etc in hydrologic studies. The different models such as fuzzy logic, Artificial Neural Network (ANN) and Sediment Rating Curve (SRC) models used for predicting suspended sediment yield and the results show a higher accuracy of fuzzy rule base model assessments in comparison with neural networks and sediment rating curve assessments (Angabini et al, 2014.29 Lohani et al (2011)30 compared the performance of ANN, Fuzzy logic and linear transfer function (LTF) models for predicting daily runoff for Narmada basin (India) and found that the fuzzy logic model is uniformly performed well. Present study was conducted to forecast the runoff and sediment yield for Kal River using the ANN and FL models and compared both models for their performance in runoff and sediment yield forecasting.
Materials and Methods
Study Area and Data Used
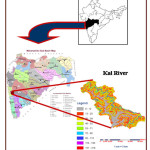
The Kal River a Tributary of Savitri basin was selected for developing rainfall runoff and sediment models using ANN and FL models. The location Kal River is given in Figure 1. The data of Birwadi station operated by Superintending Engineer, Unit Hydrologic Project, Nashik of Rainfall, Temperature, Evaporation, Streamflow and sediment yield for 21 years (1991 to 2011) used for developing the models comprises of 2483 sets. The statistical analysis of inputs data were performed and presented in Table 1.
Table 1: Statistical Properties of Input Data Used in ANN and Fuzzy Logic Modelling for Kal River
|
Sr No |
Data |
Data set |
Max |
Min |
Mean |
SD |
ACF |
PACF |
SE |
|
1 |
Rainfall, mm |
2319 |
370 |
0.1 |
33.9 |
45.81 |
0.010 |
0.00366 |
0.0207 |
|
2 |
Runoff, cumecs |
2319 |
2394.5 |
0.1 |
184.92 |
233.04 |
0.00366 |
0.00794 |
0.0204 |
|
3 |
Temperature, oC |
2383 |
40.30 |
23.9 |
29.78 |
2.44 |
0.171 |
0.016 |
0.0201 |
|
4 |
Evaporation, mm |
2383 |
16.0 |
0.2 |
3.36 |
1.25 |
0.106 |
0.016 |
0.0201 |
|
5 |
Sediment yield, t/ha/day |
739 |
62123.35 |
0.8 |
475.28 |
2790.37 |
0.0193 |
0.0044 |
0.0349 |
The sediment data of 7 years (2003 to 2009) comprises of 739 sets. The available data were divided in two segments as for model training and development of 14 years (1991 to 2004) consists of 1600 sets and cross validation of developed models result of 7 years (2005 to 2011) consists of 883 sets for ANN and Fuzzy logic models. In sediment yield modelling using ANN and FL models data used were 7 years (2003 to 2009) comprises of 739 sets and which divided in two segments as development stage (2003 to 2007) and calibration stage (2008 to 2009) data was used.
Artificial Neural Network
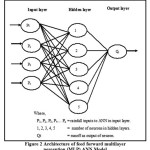
An Artificial neural Network is black box model working on the nonlinear programming, in which inputs were interconnected by neurons like human brains connected to nervous system. It follows the three layers as inputs, hidden layer is also called processing layers and output layers. Each layer are interconnected to each other but not to same layer by neurons and provided with specific weights. In present study mostly adopted feed forward back propagation neural network was adopted, which work on the interconnected layer to network in forward direction from inputs to outputs. The back propagation is supervised learning algorithm which precisely trains the outputs of model with reference to input by providing appropriate strength by calculating errors in actual data and computed data. If the error in computed and actual data is in permissible limit it stop otherwise continued to adjust the weight until satisfactory output in the training mode of the model (Rumelhart, et. al., 1986).31 The activation function of the artificial neurons in ANNs implementing the back propagation algorithm is a weighted sum (the sum of the inputs Pt-1 multiplied by their j-i respective weights w). The ANN working processing flow diagram is represented in Figure 2. The mathematical relation followed for working ANN model is given by Eq. (1) as:

 |
|
 |
|
Where: t - time of prediction, days (24 hrs); t1- time to incorporate rainfall (in this case, tl =tl-2); t-1- time period, (24hrs), P- daily rainfall (mm); Pt-1- daily rainfall lag by one day, mm (24 hr); Pt-2- daily rainfall lag by two day, mm (48 hr); Qt - daily streamflow, (cumecs); Qt-1 - streamflow lag by one day, cumecs (24 hr); Qt-2 - streamflow lag by two day, cumecs (48 hr); Tt - daily mean temperature, 0C; Et - daily mean evaporation, mm; SR - summation of rainfall value from tl to tl-2 ,(mm).
Transfer Function
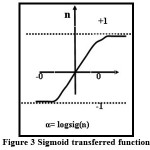
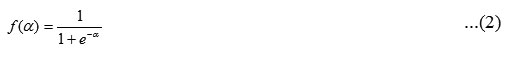
The selection of data transferred unction is very important in artificial neural network modeling, which transferred the signal from input to hidden and hidden layer to output layered with appropriate weightages. In hydrologic modeling, Sigmoid transferred function found to appropriate in predicting the runoff and sediment yield in multilayered feed foreword back propagation neural model. These transferred the valued from one layered to another in rages of 0 to 1. The sigmoid transfer function f(a) adopted given by Eq. (2) and working principle represented by Figure 3.
 |
|
Pre-Processing of Data
The observed data were normalised by using a logistic sigmoid transferred function to input data parameters (rainfall, runoff, temperature and evaporation) with Eq. (3). The normalization converts the all input data in ranges of 0 to 0.99. These needed because inputs parameters have different unit for different parameters.

Where, Xn = normalized data; Xvalue = observed data;’ Xmin= smallest values among the data Xmax = largest values among data.
ANN training
ANN models are trained based on supervised training procedure which allows the network to simulate the hydrological system by examining input-output examples from it. Work by Samani et al. (2007)32 show that the popular steepest-descent back propagation algorithm is easily performed by second-order gradient algorithms and a wider consensus has been reached that such algorithms are therefore preferable over first-order methods.
Fuzzy Logic (FL)
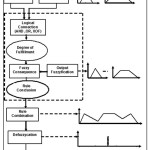
The fuzzy logic is a relational based generalized system consists of fuzzy sets, fuzzyfication, fuzzy rule, fuzzy output and defuzification for crisp outputs. It gives graphical outputs need to covert crisp output by adopting gravity centriod methods. The step for fuzzy logic model operation is present in Figure 4.
 |
|
Fuzzy Sets
The fuzzy sets is number associated with fuzzy member correlated with output. There is need to provide the cluster analysis of input data sets and decide the fuzzy number range give in appropriate ranges. The fuzzy numbers were decided by trapezoidal, triangular, Gaussian membership function, but triangular membership function found to very appropriate in performance of model.
Fuzzy Logic Control
The fuzzy logic controller controls the usage of membership function and set rule or rules reason of data. In rainfall runoff modelling inputs parameters such rainfall, temperature and evaporation control the outputs of the model as stream flow. Hence, selection of inputs parameters ranges and setting of rules play important role in controlling the hydrologic system.
Membership Functions
The selection of membership function input function and its reliability affect the output performance of the models in fuzzy logic system. The membership functions are the member of a fuzzy sets and its values may varying depends upon it grads to sets. The set of elements that have a non-zero membership is called the support of the fuzzy set.
Fuzzification
The steps adopted to convert inputs data sets to several membership function by taking care of degree of membership elements is term as fuzzification. In present study to estimate streamflow and sediment yield, fuzzy inputs were selected as daily rainfall (Pt), mean daily temperature (Tt), mean daily evaporation (Et) and daily streamflow (Qt) for sediment yield prediction by cluster analysis. The triangular membership function was used to cover all ranges of inputs. The subjective perception for linguistic level of expert criteria was adopted while defining the Fuzzy subsets. All inputs and outputs variables separately divided into 9 subsets as extremely low (EL), very low (VL), low (L), medium low (ML), medium (M), medium high (MH), high (H), very high (VH) and extremely high (EH) for fuzzification and formation of rules.
Fuzzy Rules
The formation of rules is important steps and its accuracy depends on it selection of rules. More the rules with prices subsets of data and fuzzification process give more accurate output of the model in fuzzy interference system. The activation of a rule is the deduction of the conclusion, possibly reduced by its ï¬ring strength. The fuzzy rules set in developing fuzzy sets given as follows as sample.
IF Pt is low and Pt-1 is Low THEN Qt is Very low (4)
IF Pt is high and THEN Qt is high (5)
The next sub process in inference is the composition sub process where all of the fuzzy subsets assigned to the output variable are combined together to form a single subset for the output variable. The maximization (max) and summation (sum) sub process were adopted for interference of the output of developed fuzzy model.
Defuzzifications
There were several methods of defuzzification i e to convert the “crisp” output of models such as centre of gravity (COG), bisector of area (BOA), mean of maxima (MOM), left-most maximum (LM), and right-most maximum (RM) etc (Sen, 1999).33 But COG is common method with accurate output interns crisp values compared to other methods. In the COG method the crisp output value is the abscissa under the centre of gravity of the combined output fuzzy subset. The most common COG method of defuzzification is expressed by Eq. (6).
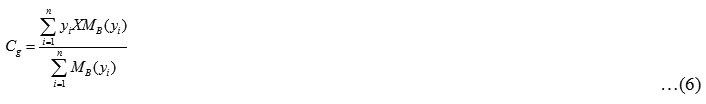
where, Cg - the centroid of the truncated fuzzy output set B; MB(yi) - the membership value of element yi in the fuzzy output of set B and n - the number of elements.
Performance Evaluation Models Results
The output performance of the developed model is in developmental state and validation stage need. This was evaluated by using correlation coefficient (R), root mean square error (RMSE), mean absolute deviations (MAD), coefficient of efficiency (CE), and volumetric error (EV) as per suggested by researchers (Abraham and Ledolter, 198334; Nash and Sutcliffe, 1970.35
Correlation coefficient (R)
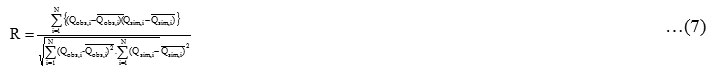
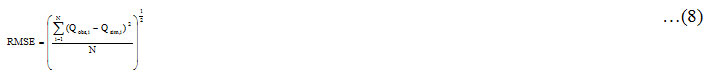
Where, Qobs - observed streamflow, cumecs; Qsim – estimated streamflow, cumecs; N - the number of observations.
Root mean square error (RMSE)
Mean Absolute Deviation (MAD) 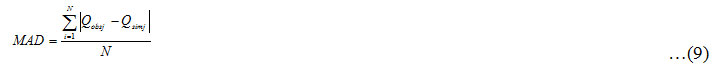
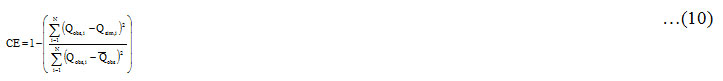
Coefficient of Efficiency (CE)
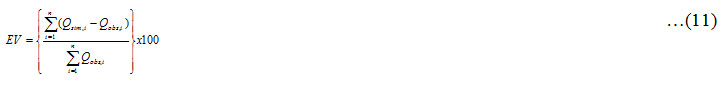
Volumetric error (EV)
Results and Discussions
ANN rainfall runoff modelling for Kal River
The rainfall, runoff and sediment yield modelling was undertaken for Kal river considering rainfall, runoff, temperature and evaporation parameters of Birwadi station. The ANN model was operated to predict rainfall-runoff and runoff-sediment yield relationship for Kal River in METLAB 2.9b compatible with nntool. The artificial neural network model was developed by adopting multi layered feed foreword preceptor back propagation (MLFFP) algorithm with sigmoid transfer function. The architecture was selected as three layer networks consist of input, a hidden and a output layers. The inputs were selected varying from single to seven in combination of daily rainfall (Pt), rainfall lag by one day (Pt-1), rainfall lag by two days (Pt-2), daily mean temperature (Tt) and daily mean evaporation (Et), daily streamflow lag by one day (Qt-1) and daily streamflow lag by two days (Qt-2). For sediment yield modelling of Kal River the number of neurons in input layer selected minimum one and maximum three, which are daily streamflow (Qt) at the current day, streamflow lag by one day (Qt-1) and streamflow lag by two days (Qt-2) before the observed sediment load (St). The appropriate numbers of neurons in hidden layers were selected on trial and error basis. The ANN model performance for Kal River was checked by observing the R and MSE values at training, testing, and validation stage to select the appropriate neurons in hidden layers with different inputs parameter. The models were runs for different combination of input and neuron in hidden layers. Total 11 models were considered for rainfall runoff modelling and six models were for sediment yield modelling (Table 2) with different combination of input parameters, number neuron in hidden layer. The individual models with different combination of inputs were evaluated for different number of neurons (1 to 20) in hidden layer. The ANN model found with R approaching to one and MSE approaching to zero among the selected epoch was adopted for further cross validation and forecasting the runoff for Kal River and it is presented in Table 2.
Table 2: Input parameters and adopted ANN structure for rainfall runoff and sediment yield modelling for Kal River
|
Model No. |
Models input parameters |
No. of input parameter |
No of Hidden layers |
No of neurons in the hidden layer |
Output layer |
Model structure |
|
A) |
ANN Runoff models |
|||||
|
M1 |
Qt=Pt |
1 |
1 |
15 |
1 |
1 1 15 1 |
|
M2 |
Qt=Pt, Pt-1 |
2 |
1 |
13 |
1 |
2 1 13 1 |
|
M3 |
Qt = Pt,Pt-1,Pt-2 |
3 |
1 |
15 |
1 |
3 1 15 1 |
|
M4 |
Qt = Pt,Pt-1,Pt-2, Et |
4 |
1 |
20 |
1 |
4 1 20 1 |
|
M5 |
Qt = Pt,Pt-1,Pt-2, Tt |
4 |
1 |
20 |
1 |
4 1 20 1 |
|
M6 |
Qt = Pt,Pt-1,Pt-2, Et, Tt |
5 |
1 |
15 |
1 |
5 1 15 1 |
|
M7 |
Qt = Pt,Pt-1,Pt-2,Qt-1 |
4 |
1 |
15 |
1 |
4 1 15 1 |
|
M8 |
Qt = Pt,Pt-1,Pt-2,Qt-1,Qt-2 |
5 |
1 |
5 |
1 |
5 1 5 1 |
|
M9 |
Qt = Pt,Pt-1,Pt-2,Qt-1,Qt-2, Et |
6 |
1 |
20 |
1 |
6 1 20 1 |
|
M10 |
Qt = Pt,Pt-1,Pt-2,Qt-1,Qt-2, Tt |
6 |
1 |
13 |
1 |
6 1 13 1 |
|
M11 |
Qt = Pt, Pt-1, Pt-2, Qt-1, Qt-2, Et, Tt |
7 |
1 |
20 |
1 |
7 1 20 1 |
|
B) |
ANN Sediment Yield Models |
|||||
|
SM1 |
St = Qt |
1 |
1 |
10 |
1 |
1 1 10 1 |
|
SM2 |
St =Qt, Qt-1 |
2 |
1 |
10 |
1 |
1 1 10 1 |
|
SM3 |
St = Qt, Qt-1, Qt-2 |
3 |
1 |
15 |
1 |
3 1 15 1 |
|
SM4 |
St = Qt, Pt |
2 |
1 |
10 |
1 |
2 1 10 1 |
|
SM5 |
St =Qt, St-1 |
2 |
1 |
10 |
1 |
2 1 10 1 |
|
SM6 |
St =Qt, St-1, St-2 |
3 |
1 |
10 |
1 |
3 1 10 1 |
Performance of Selected ANN models for Rainfall Runoff Modelling
The adopted models (1 to 11) are presented in Table 2 for Kal River and were evaluated for their statistical performance under training period (1991 to 2004) and cross validation period (2005 to 2011). The R value of M2 (0.72) was low and highest for M711 (0.86) in training mode. The M2 has lowest R as 0.75 and highest for M7 (0.90) in cross validation (Table 3). The models performance considers well when RMSE, CE, MAD and MAPE values are minimum and maximum CV. It is observed that, RM11 shown minimum RMSE (119.96 cumecs), EV (0.294 per cent), MAD (0.54 per cent) and highest CE (74.84 per cent) and MAPE (77.48per cent) in training period and minimum RMSE (98.59 cumecs), EV (4.19 per cent), MAD (-7.59 per cent) and highest CE (80.03 per cent) and MAPE (54.82per cent) was observed in cross validation period. The model performance was improved with the increasing the inputs in input layer. But addition of runoff lags by one or two days to input layer models performance was increases substantially. Therefore, M7 7 to M11 performed very well as compared to M1 to M6. The value of MAD in training period for M 9 and M10 and validation period for M1, M2, M4, M5, M7, M8, M9, M10 and M11 indicates the models were overestimates the runoff to observed runoff. It is also observed that, models in validation period overestimated the runoff for Kal River in most of the cases. The all statistical parameters estimated were in the range of other study reported by scientists.
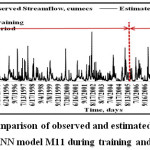
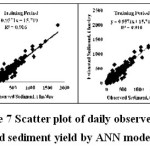
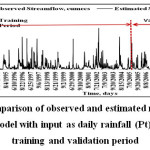
The graphical representation of observed and estimated daily runoff of M11 for Kal River during training and cross validation period is presented in Figure 5 and comparison hydrograph of the observed and estimated daily runoff models is illustrated in Figure 6. It is observed that M11 with regression coefficient (0.7489) during training and 0.8077 during cross validation was lowest among all adopted 11 model for Kal River. It is also observed that M11 well fitted over other models. The performance of adopted models was increases with the increasing the inputs in input layer for different neuron in hidden layer. In spite of the number of neuron in hidden layers, the number of input parameters plays an important role in improving the performance of the ANN models for Kal River.
Table 3: Statistical performance of different ANN models of Kal River with different input parameter during training and cross validation period.
|
Model No. |
Training Period (1991-2004) |
Cross validation Period (2005-2011) |
||||||||
|
R |
RMSE |
CE |
EV |
MAD |
R |
RMSE |
CE |
EV |
MAD |
|
|
M1 |
0.75 |
158.62 |
56.00 |
9.74 |
18.15 |
0.78 |
139.42 |
60.05 |
8.725 |
15.76 |
|
M2 |
0.73 |
163.98 |
52.98 |
4.87 |
9.08 |
0.75 |
147.12 |
55.52 |
10.93 |
19.76 |
|
M3 |
0.74 |
165.07 |
52.34 |
14.19 |
26.44 |
0.78 |
140.72 |
59.31 |
13.93 |
25.17 |
|
M4 |
0.72 |
166.93 |
51.27 |
5.20 |
9.69 |
0.81 |
129.53 |
65.53 |
9.73 |
17.58 |
|
M5 |
0.75 |
159.19 |
55.68 |
3.23 |
6.02 |
0.79 |
134.80 |
62.80 |
5.33 |
9.64 |
|
M6 |
0.77 |
154.82 |
58.08 |
13.99 |
26.07 |
0.79 |
134.02 |
63.09 |
0.326 |
0.589 |
|
M7 |
0.86 |
121.31 |
74.31 |
0.643 |
1.19 |
0.90 |
96.36 |
80.91 |
4.90 |
8.86 |
|
M8 |
0.85 |
125.26 |
72.56 |
0.96 |
1.79 |
0.89 |
102.57 |
78.38 |
0.96 |
1.74 |
|
M9 |
0.85 |
125.29 |
72.55 |
3.43 |
6.38 |
0.89 |
100.67 |
79.18 |
7.33 |
13.25 |
|
M10 |
0.84 |
130.94 |
70.02 |
12.99 |
24.21 |
0.87 |
117.27 |
71.74 |
19.10 |
34.52 |
|
M11 |
0.86 |
119.96 |
74.84 |
0.292 |
0.54 |
0.89 |
98.59 |
80.03 |
4.19 |
7.59 |
 |
|
 |
|
Performance of Selected ANN Models for Sediment Yield Modelling
The ANN model developed for predicting sediment yield by adopting same procedure explained above for streamflow prediction. The correlation coefficient (R) during training period are 0.0.92, 0.93, 0.93, 0.93, 0.95 and 0.96 and during cross validation phase 0.87, 0.92, 0.92, 0.93, 0.93, 0.93 for adopted models such as SM1, SM2, SM3, SM4, SM5, and SM6, respectively. The model performance consider best in predicting sediment yield satisfactory if R value more than 0.90 and if R value in range of 0.9 to 0.80 the model performance considered as fair (Kachroo, 1986.36 The ANN model developed for predicting sediment yield for Kal River found R value more than 0.90, hence performed well. The RMSE for all models under training phase varies from 91.58 to 67.49t/day and under cross validation phase varies from 110.35 to 83.59 t/day. Other performance indices such as CE, EV, MAD and MAPE were 91.55per cent and 91.49 per cent, 1.46 per cent and 3.62 per cent, -2.90 per cent and -7.16 per cent, and 28.05 per cent and 39.17 per cent, respectively under training phase and during cross validation phase it were 84.48 per cent and 83.59 per cent, 86.31 per cent and 86.60 per cent, 0.12 per cent and 0.14 per cent, 0.080 per cent and 3.12 per cent, and 23.67 per cent and 28.61 per cent, respectively for Model SM5 and SM6. Hence, the model with input as sediment load of lag by one or two days improved the performance of ANN model over the other model (Table 4). The performance of model SM1 to SM4 is good and satisfactory results for predicting the sediment yield of Kal River.
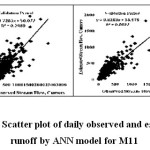
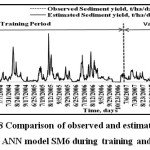
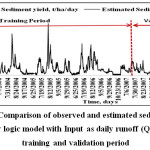
The graphical scatter plot of observed and estimated sediment yield (t/day) during training and cross validation period for SM6 model is presented in Figure 7 and the comparative hydrograph of daily observed and estimated sediment yield for SM6 models is presented in Figure 8. It is from above discussion and graphical representation observed that ANN models are performing very well during training and cross validation for predicting the sediment yield. The SM5 and SM6 are found to perform with R2 value above 0.9 and closed fitted.
Fuzzy Logic rainfall runoff and Sediment yield modelling for Kal River
The runoff and sediment yield was also predicted using Fuzzy Logic models developed in METLAB 9.2b using fuzzy tool for Kal River on daily basis. The statistical performance of FL model during developmental stage for 14 years (1991 to 2004) and calibration period for 7 years (2005 to 2011) is presented in Table 5. The model performance was during developmental stage evaluated by statistical indices such as R. RMSE. CE, EV, and MAD 0.91, 105.81 cumecs, 80.62 per cent, 7.15 per cent, and 13.42 per cent and during validation period it were 0.954, 73.14 cumecs, 88.99 per cent, 4.78 per cent, and 8.63 per cent, respectively for prediction of runoff.
Table 4: Statistical performance of different ANN models of Kal River with different input parameter for sediment yield modelling during training and cross validation period.
|
Model No. |
Training Period (2003-2007) |
Cross Validation Period (2008-2009) |
||||||||
|
R |
RMSE |
CE |
EV |
MAD |
R |
RMSE |
CE |
EV |
MAD |
|
|
SM1 |
0.92 |
91.58 |
84.16 |
2.28 |
4.52 |
0.87 |
110.35 |
76.85 |
0.10 |
15.62 |
|
SM2 |
0.93 |
86.02 |
86.12 |
6.54 |
12.95 |
0.92 |
85.78 |
85.22 |
0.17 |
3.11 |
|
SM3 |
0.93 |
87.09 |
85.77 |
4.39 |
8.70 |
0.92 |
89.81 |
84.53 |
0.12 |
13.42 |
|
SM4 |
0.93 |
84.98 |
86.46 |
1.53 |
3.04 |
0.93 |
81.87 |
87.15 |
1.97 |
7.45 |
|
SM5 |
0.95 |
67.13 |
91.55 |
1.46 |
2.90 |
0.93 |
84.48 |
86.31 |
0.12 |
0.080 |
|
SM6 |
0.96 |
67.49 |
91.46 |
3.62 |
7.16 |
0.93 |
83.59 |
86.60 |
0.14 |
3.12 |
Table 5: Statistical performance of FL model of Kal River for runoff and sediment yield modelling
|
Model No. |
Training Period |
Cross Validation Period |
||||||||
|
R |
RMSE |
CE |
EV |
MAD |
R |
RMSE |
CE |
EV |
MAD |
|
|
A) |
Runoff, cumecs Prediction using FL Model |
|||||||||
|
1. |
0.911 |
105.81 |
80.62 |
7.15 |
13.42 |
0.954 |
73.14 |
88.99 |
4.78 |
8.63 |
|
B) |
Sediment Yield, t/ha/years Prediction Using FL Model |
|||||||||
|
2. |
0.914 |
146.11 |
82.67 |
10.68 |
63.71 |
0.955 |
75.74 |
88.51 |
5.83 |
11.95 |
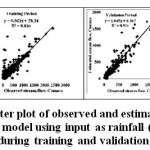
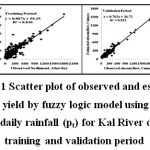
The sediment yield was predicted using FL models and its statistical performance during developmental stage checks using R. RMSE. CE, EV, and MAD were 0.914, 146.11 t/day, 82.67 per cent, 10.68 per cent, and 63.68 per cent and during calibration period it were 0.955, 75.74 t/day, 88.51 per cent, 5.83 per cent, and 11.95 per cent, respectively (Table 5). The statistical indices observed for runoff and sediment yield modelling are found in the acceptable range. The comparative performance of FL models during developmental stage and calibration period were also evaluated by scatter plot of estimated and observed runoff and sediment yield is presented in Figure 9 and Figure 11, respectively. The comparative performance of observed and estimated runoff and sediment yield during developmental and calibration period presented graphically in Figure 10 and Figure 12, respectively. It is observed that estimated runoff and sediment yield is closely matched with observed runoff and sediment yield for Kal River. The runoff and sediment yield modelling with fuzzy logic with triangular MF and COG method of deffuzification found suitable for prediction of runoff and sediment yield for Kal River.
 |
|
 |
|
 |
|
 |
|
 |
|
 |
|
Conclusions
The artificial neural network model (ANN) developed using back propagation feed forward sigmoid transfer function were found most suitable for short term prediction of runoff and sediment yield for Kal river with R value more than 0.85 during training and cross validation period. The other statistical indices were also indicates the model performance very well. The performance of the model improved with addition of runoff lag by one or two days for runoff prediction and sediment yield lags by one or two days for sediment yield prediction. The event base fuzzy logic models were developed on daily basis for prediction of runoff and sediment yield for Kal River was found performing well with R more than 0.90 during calibration and validation period. Both models found performed well in predicting streamflow and sediment yield but FL model is event based could be not performed on long term basis compared to ANN.
Acknowledgement
The authors are very thankful to Superintend Engineer, HUD, Nashik for providing hydrologic and climatic data free of cost and are also thankful to the Dean, College of Technology and Engineering, MPUAT, Udaipur for providing necessary facilities during research work.
References
- Porporato A, and Ridolfi L. (2001). Multivariate nonlinear prediction of river flows. J. of Hydrology. 248: 109–122.
CrossRef - Shrike Y., Kawitkar, R., and Balan S. (2012) Artificial Neural Network based Runoff Prediction Model for a Reservoir. International Journal of Engineering Research & Technology (IJERT). 1(3) :1-4, ISSN: 2278-0181.
- Sinha Jitendra, Sahu R. K., Agrawal Avinash, Pali A. K. and Sinha B. L. (2013). Rainfall runoff modeling using multi layere Perceptron Technique – A case study of the Upper Kharun Catchments in Chhattisgarh. J of Agricultural Engineering, 50(2): 43-51.
- Chen S. M., Wang Y. M., and Tsou I. (2013) Using artificial neural network approach for modeling rainfall–runoff due to typhoon. J. of Earth System Science, 122(2):399-407
CrossRef - Solomatine D. P., and Dulal K. N. (2003) Model trees as an alternative to neural networks in rainfall–runoff modeling; J. Hydrol. Sci. 48 399–411.
CrossRef - Hsu, L., Gupta H. V. and Sorooshian S. (1995) Artificial neural network modelling of rainfall runoff process. Water Resources. Res. 31; 2517-2530.
CrossRef - Tokar A S and P A Johnson. 1999. Rainfall–runoff modelling using artificial neural networks; J. Hydrol. Engg. 4 232–239.
CrossRef - Shivakumar B., Jayawardhane A. W., and Fernando T. M. K. G., (2002) River flow forecasting: use of phase space reconstruction and artificial neural network approaches., 265: 225-245.
- Jain S. K. and D. K , Srivastva. 2005. Application of ANN for reservoir in flow prediction and operation. J Water Resources Planning and Manage. 125: 23-271.
- Senthil Kumar A. R., Ojha C. S. P., Manish Kumar Goyal, Singh R. D., and Swamee P. K.. (2012). Modeling of Suspended Sediment Concentration at Kasol in India Using ANN, Fuzzy Logic, and Decision Tree Algorithm. J. of Hydrologic Engineering.@ ASAE:295-403.
- Raghuwanshi1 N. S., Singh, R. and Reddy L. S. (2006) Runoff and Sediment Yield Modelling Using Artificial Neural Networks: Upper Siwane River, India. J. Hydrol. Eng.11:71-79.
CrossRef - Jain Kumar Sharad. (2008). Development of integrated discharge and sediment rating relation using a compound neural network. J of Hydrologic Engg. Pp 124-131.
- Luk K., Ball J. E., and Sharma A., (2001) An Application of artificial neural network for rainfall forecasting. Mathematical and computer modelling. 33: 683-693.
CrossRef - Smith J., and Eli R. N. (1995). Neural network model for rainfall runoff process. J. Water Res. Plng. Mhnt. ASCE. 121:49-508.
CrossRef - Zadeh L. A. 1965. Fuzzy sets. Information and Control. 8(3): 338–353.
CrossRef - Kruse R, Gebhardt J, and Klawonn F. (1994). Foundations of Fuzzy Systems. Wiley: New York
- Theodoridis S, and Koutroumbas K. (1999). Pattern Recognition. Academic Press: New York: 482–483.
- Nayak P. C., Sudheer K. P., and Ramasastri K. S. (2005) Fuzzy computing based rainfall–runoff model for real time flood forecasting. J of Hydrologic process. 9: 955-968.
CrossRef - Zhu M. L, and Fujita M. (1994). Comparison between fuzzy reasoning and neural network method to forecast runoff discharge. Journal of Hydro science and Hydraulic Engineering. 12(2): 131–141.
- See L and Openshaw S. (1999). Applying soft computing approaches to river level forecasting. Hydrological Sciences Journal. 44(5): 763–779.
CrossRef - Stuber M, Gemmar P, and Greving M. (2000). Machine supported development of fuzzy-flood forecast systems. European Conference on Advances in Flood Research, Potsdam, PIK Report 65, Bronstert A, Bismuth C, Menzel L (eds.), Reprint of Proceedings, Vol. 2: 504–515
- Hundecha Y, Bardossy A, and Theisen H. W. (2001). Development of a fuzzy logic based rainfall–runoff model. Hydrological Sciences Journal. 46(3): 363–377
CrossRef - Mamdani E. H, and S. Assilian. 1975. An experiment in linguistic synthesis with a fuzzy logic controller. International Journal of Man–Machine Studies. 7(1):1–13.
CrossRef - Tayfur, G., Ozdemir, and S., Singh, V.P., (2003). Fuzzy logic algorithm for runoff-induced sediment transport from bare soil surfaces. Adv. Water Res. 26: 1249–1256.
CrossRef - Chang, L. C., Chang, F. J., and Tsai, Y. H. (2005). Fuzzy exemplar-based inference system for flood forecasting. Water Resource Res., 41.
CrossRef - Maskey, S., Guinot, V., and Price, R. K. (2004). Treatment of precipitation uncertainty in rainfall-runoff modeling: A fuzzy set approach. Adv. Water Resour., 27(9):889–898
CrossRef - Tilmant, A., Vanclooster, M., Duckstein, L, and Persoons, E. (2002). Comparison of fuzzy and non-fuzzy optimal reservoir operating policies. J. Water Resour. Plann. Manage. 128(6): 390–398.
CrossRef - Hong, Y. S., Rosen, M. R., and Reeves, R. R. (2002). Dynamic fuzzy modeling of storm water infiltration in urban fractured aquifers. J. Hydrololy. Eng. 7(5):380–391.
CrossRef - Angabini S., H. Ahmadi, S .Feiznia, B. Motamed Vaziri, and S. Ershadi. 2014. Using Intelligence Models to Estimate Suspended sediment system case study: Jagin Dam. Bull. Env. Pharmacol. Life Sci., Vol. 3 Sp. Issue III: 166-172
- Lohani A. K., N. K. Goel, and K. K. S. Bhatia. 2011. Comparative study of neural network, fuzzy logic and linear transfer function techniques in daily rainfallâ€runoff modelling under different input domains. Hydrological Processes. 10.1002/hyp.7831
CrossRef - Rumelhart, E., G., Hinton and R Williams. 1986 Learning internal representations by error propagation. Parallel Distributive Process. 1:218-362\
- Samani, N., M., Gohari-Moghadam, and A. A Safavi. 2007. A simple neural network model for the determination of aquifer parameters, J. Hydrol., 340, 1–11, doi:10.1016/j.jhydrol.2007.03.017. Cross Ref, Web of Science. Times Cited: 22, ADS
CrossRef - Sen, Z. 1999. Fuzzy modelling in engineering. Class notes, Civil Engineering Faculty, Istanbul Technical Univ., Istanbul, Turkey (Turkish).
- Abraham B., and J., Ledoltor. 1983. Statistical Methods for forecasting. John Wiley and Sons Inc., New York. : 472
- Nash J. F., and J. V., Sutcliffe 1970. River flow forecasting through conceptual models. J. hydrol Sci., 44 : 399-417
- Kachroo, R. K. 1986. HOMS Workshop on River Flow Forecasting, Nanjing, China, Unpublished Internal Report, Dept. of Engg. Hydr., University College Galway, Ireland,1986.


