Improvement of the Water-Energy Nexus and the Environmental Performance of Water Supply Systems Using Smart ICT Solutions
Jorge Helmbrecht1 * , Matthias Maier2 , Esteban Muñoz Morillo1 , Dirk Kühlers2 and Karl Roth2
1
Inclam Group (Water Idea),
Madrid,
Spain
2
Stadtwerke Karlsruhe GmbH,
Karlsruhe,
Germany
http://dx.doi.org/10.12944/CWE.11.3.01
Copy the following to cite this article:
Helmbrecht J, Maier M, Morillo E. M , Kühlers D, Roth K. Improvement of the Water-Energy Nexus and the Environmental Performance of Water Supply Systems Using Smart ICT Solutions. Curr World Environ 2016;11(3). DOI:http://dx.doi.org/10.12944/CWE.11.3.01
Copy the following to cite this URL:
Helmbrecht J, Maier M, Morillo E. M , Kühlers D, Roth K. Improvement of the Water-Energy Nexus and the Environmental Performance of Water Supply Systems Using Smart ICT Solutions. Curr World Environ 2016;11(3).
Download article (pdf)
Citation Manager
Publish History
Introduction
Water supply systems face challenges in the fields of socio-economics, sustainability and resilience, including overuse due to population growth, underestimation of the value of water, lack of coordination among actors, operational issues (ageing, leakages, quality), increasing energy prices and the need to respond to climate change issues. These are, among others, aspects that water utility companies have respond by adapting their infrastructure and working procedures as well as by implementing new tools in their operational processes. Moreover, the assessment of the resource efficiency and environmental performance of water utilities frequently still lack a holistic approach resulting in the existence of a captive knowledge and a set of unconnected and low accessibility assets which, in many cases, are isolated from the decision-making process. Specifically, the water-energy nexus raised the attention of many WU, where often considerable measures are taken to reduce energy consumption and increase energy recovery. Water resource efficiency in its broader context is also of utmost importance for WU. It is also considered as one of the most important multidisciplinary challenges that the global water market is to face in the forthcoming years.4
Non-revenue water (losses and waste in transmission, distribution, and consumption) is well known in countries at all levels of development. For example, many water distribution systems incur leakage of as much as 20 to 40 % of their treated drinking water.
Water supply is in many cases a major – and frequently inefficient - user of energy in many of its processes (production, distribution). E.g. almost 20 percent of California's (USA) total energy consumption goes to moving water around the state, and a similar figure for the US as whole is about 6 percent.5
Water quality and scarcity problems are reaching crisis proportions, and public awareness and concern is increasing. This coincides with events centred in climate change as the Conference of Parties, particularly last Paris COP21, states and it will result in more regulation and enforcement in aspects such as carbon footprint. WUs will have to deal with stronger legislation which will force them to adapt its usual operation and management (O&M) of the network to this challenges. The water-energy nexus issues are raising the attention of WU, whose managers are becoming aware of the fact that lower operational cost could improve WUs balance sheets, enabling better and more financial resources for further tasks which can be the maintenance of infrastructure, boosting the network to unserved communities or improving the water quality. The change in O&M paradigm has to be smartly implemented and accessible for all types of WU. A non-structural solution is needed, addressing O&M efficiency improvements in terms of energy and water losses. The overall objective is to allow WU to holistically manage their processes in a flexible way by maximizing resource savings and minimising operational costs, while maintaining quality and level of service.
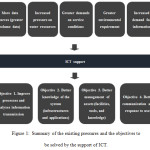 | Figure 1: Summary of the existing pressures and the objectives to be solved by the support of ICT. Click here to View figure |
In this context, information and communication technologies (ICT) are essential to meet the new requirements efficiently. The most significant technologies are, first, the development of measurement and control networks that allow having the data necessary to know the state of the system, perform the management and planning tasks and generate information that responds to internal and external requests. Secondly, the implementation of management and decision support systems that incorporate business intelligence (BI) techniques that allow to manage and use the information transmitted by the control networks and other internal or external quantitative or qualitative information and integrate the set of specific tools that help to run the procedures necessary to drive the response actions: asset management, hydraulic models, GIS models, incident monitoring, management indicators, etc.
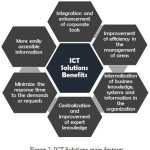 | Figure 2: ICT Solutions main features Click here to View figure |
The potential of enhancement of energy efficiency when jointly considering water and energy systems is highly significant according to governmental studies in the USA [6] and in the EU.7 Considering water distribution systems, it can help to increase the energy efficiency in comparison to handle the problem in the electric and water networks separately.8 However, considering them together also poses challenges and scheduling optimisation issues. Even though there are a lot of research and pilots focused on energy efficiency and in water supply costs for separated, there are only a limited number of pilots or research done considering both together, besides addressing other technical and economy aspects, different from the scheduling optimisation problem at which the Smart platform described aims.
The existence of so much information requires the adoption of complex data processing, system analysis and methodologies of integration capable of translating this volume of data into useful and understandable information that supports decision making and minimize the uncertainty that characterizes decisions regarding highly complex problems.
In this kind of complex problems with a vast amount of interrelated variables, the ICT solutions, and specifically the decision support systems as a collection of algorithms and solutions for Artificial Intelligence (AI), help to analyse historical data in real time and to check management strategies from a holistic approach in order to provide recommendations considering operating variables of different levels (hydraulic, energy, economic and business rules). On the other hand, these tools simplify the problem through techniques such as pattern recognition. The pattern recognition techniques used an experience-based approach learning from past experience and capable of supporting the adoption of management alternatives from the operational level (small scale) to the strategic level (large scale).
In short, the decision support systems are the tool that provides support and recommendations for administrators and network managers to improve decision making using real-time information and guiding them during the process of planning and analysis of best management strategies. The overall objective of implementing a smart ICT solution allow WU to holistically manage their processes in a flexible way by maximizing water and energy savings and minimizing operational costs while maintaining quality and level of service.
Material and Methods
The Stadtwerke Karlsruhe GmbH (SWKA) is the local supplier of energy (electricity, natural gas and long distant district heat) and drinking water for the about 300,000 inhabitants of the city of Karlsruhe in Germany. Its shares are majority-owned by the city of Karlsruhe.
The region around Karlsruhe exhibits a mild climate, with an average annual temperature of 10,4°C (1 – 2°C in December to February, 17 – 19°C in June to August). The average annual rainfall is about 920 mm/y, of which 40 – 50 % falls during the winter season. The groundwater table in the region around Karlsruhe is ca. 1 – 10 m below the surface, depending on the topography and the hydrological situation. The subsoil consists of gravel and sand storing about 1.3 bill m3 of ground water in the aquifer in the region around Karlsruhe.
The SWK has four water works located around Karlsruhe that produce drinking water from ground water of the upper layer of the aquifer. The treatment of the raw water comprises the aeration and the removal of iron and manganese by biological sand filtration. Each of the water works has four network pumps with constant pump rates (not frequency controlled). The total drinking water output of the four water works towards the city of Karlsruhe is around 20 Million m3 of per year or 55,000 m3 per day.
The drinking water network has a length of more than 900 kilometres. Most of the city of Karlsruhe is located in one pressure zone, in which all four water works feed. Attached to that pressure zone is a water storage tank of ca. 20,000 m3 located about 50 m above street level, that stabilises and controls the water pressure in this main pressure zone.
In 2009 the city of Karlsruhe together with all its companies committed themselves to reduce their energy consumption and their carbon footprint by 2 % each year. Since then a lot of effort was made in drinking water supply already, e.g. investments in more energy efficient groundwater pumps feeding the water treatment facilities, power transformers, compressors and electric lighting.
One of the present tasks of the SWKA is the optimisation of the daily pumping schedules of the treated drinking water fed into the distribution network and of the use of the water storage tanks. To achieve this objective, the SWKA participated in the European wide research project WatERP 2012 – 2015. Inclam Group developed the new smart ICT solution “WatEner” based on the results of this research project which was then applied in the Karlsruhe case study which is depicted in this paper.
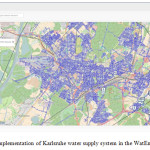 | Figure 3: Implementation of Karlsruhe water supply system in the WatEner platform Click here to View figure |
WatEner combines the key factors of energy consumption with other aspects of drinking water supply to improve the management of water supply networks in order to save water, energy and economic costs and ultimately, obtain benefits in both, water and energy fields.
In this case, the main objective of the implementation of the smart ICT solutions sought to respond to the needs and requirements in terms of energy saving and emission reduction through a Decision Support System (DSS) tool to help in the following areas:
- demand forecast of drinking water
- management of the water storage tanks
- pumping schedule of pumps feeding the network
- as a result: energy efficiency of the network pumps.
The DSS is in charge to guide the user through the process of planning better management strategies, for short-term (next days) or even long-term (network investment planning). The DSS itself is a collection of Artificial Intelligence (AI) methodologies and algorithms with the aim to analyse real-time or historical data, to check the management strategies from a holistic perspective, to provide management recommendations and to evaluate these strategies (or any other introduced by the user) in terms of economic cost, hydraulic issues and defined policies. Also, the DSS is the responsible to store, manage and give value to the available expertise knowledge of the WU’s technicians in the operation unit. Finally, the DSS is linked with a hydraulic modelling software for the evaluation of the exploiting strategies, adding value to the WU’s existing models.
The holistic approach is given by the linkage of the (i) AI methodologies, (ii) AI algorithms applied to water supply and (iii) existing monitoring data and hydraulic models. This linkage allows to perform assessment taking into account all available variables and its interrelations, and to provide feasible and efficient strategies from all points of view.
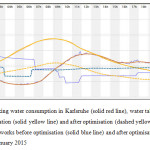
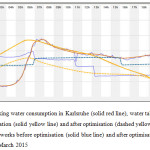 | Figure 4: total drinking water consumption in Karlsruhe (solid red line), water table in the storage tank before optimisation (solid yellow line) and after optimisation (dashed yellow line) and total output of the water works before optimisation (solid blue line) and after optimisation (dashed blue line) of the 10th of March 2015 Click here to View figure |
In Karlsruhe, mainly three effects can be used to increase the energy efficiency of the water supply system. First, the level of the water table in the water storage tank has a dominant effect on the pressure in the water supply network. A lower water table causes lower pressure in the supply network and consequently at the output of the network pumps in the water works. A lower pressure there does not lower the power consumption of the pumps however, as they are not frequency controlled, but increases the water output of the pumps and accordingly improves the specific energy use [kWh/m3] of the pump.
Furthermore, the average energy losses by friction of the water in the pipes can be reduced by homogenising the water output of the water works. The friction increases with the square of the velocity of the water in the pipes. Hence, to avoid areas and times with significantly higher than average velocity of the water in the pipes lowers the average pressure at the output of the network pumps in the water works and thereby increases their output and improves their specific energy consumption.
At last, due to different construction and design requirements in the past some of the network pumps in the water works are generally more energy efficient than others. Operating the pumps which are less efficient rarely increases the average energy efficiency.
Additionally, it has to be considered that there are time periods when electricity prices are higher and time periods when electricity prices are lower. In the case study area of Germany, electricity is usually most expensive between 8 am and 10 am and between 5 pm and 9 pm, and cheapest between midnight and 6 am. Unfortunately, this time periods coincide with the time periods of the highest drinking water demand.
Before the introduction of WatEner, the water storage tank was filled during night time using lower energy prices and discharged to feed the distribution network during the day when the water demand as well as the energy prices are high. The holistic approach of WatEner was used to redesign the pump schedule of the network pumps and thereby combine the effects described above to optimise the energy efficiency of the system. For the definition of the optimal solution, it was important, that the water supply must be never interrupted, that the highest possible water quality were not to be put at any risk and that the energy costs should also be as low as possible.
To show the effect of redesigning the pumping schedules on the energy consumption and the energy costs, historical data of three days of the year 2015 were chosen as examples: an average workday with average water consumption, New Year’s Day as the day with the lowest water consumption in 2015 and a hot summer day which represents a day which exhibits significantly increased water demand.
Results and Discussion
Figure 4 shows the difference before and after optimisation of the total output of the water works and the water table of the water storage tank as a timeline from midnight to midnight for the 10th of March 2015 as an example of an average workday. The total drinking water consumption of that day was 54,500 m3. The energy consumption of the network pumps in the water works added up to 12,192 kWh (0.2237 kWh/m3) which led to energy costs of 2038 € (0.0374 €/m3). Figure 5 depicts the corresponding pump schedules of the network pumps before and after optimisation.
Figure 4: total drinking water consumption in Karlsruhe (solid red line), water table in the storage tank before optimisation (solid yellow line) and after optimisation (dashed yellow line) and total output of the water works before optimisation (solid blue line) and after optimisation (dashed blue line) of the 10th of March 2015.
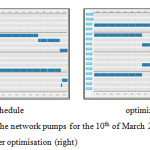 | Figure 5: pump schedules of the network pumps for the 10th of March 2015 from midnight to midnight before (left) and after optimisation (right) Click here to View figure |
The drinking water consumption on the 10th of March 2015 (red solid line in figure 4) was very low between midnight and 6 am, then highest demand could be observed the between 7 am and 9 am (people taking a shower). After that it showed a slight decline until about 4 pm, had then a second, smaller maximum at around 7 pm (people taking a shower) and finally declined again. This daily pattern of consumption is generally repeated with the exception of some "special" days (such as the New Year) that the platform knows and is able to identify, providing equally good forecasts of demand. On those special days, the peak demand is shifted from 7 am and 9 am, and can arrive at 11 am while night demand is always met.
The water storage tank is in both scenarios filled between 11 pm and 6 am (before optimisation solid yellow line, after optimisation dashed yellow line). Originally, before the optimisation, this was the time with the highest total output of the water works (solid blue line). In order to use the relatively cheap energy at night the storage tank was completely filled with the water table rising from about 2 m (desired/required minimum) to about 7.5 m. With the optimised pump schedule the very high output (dashed blue line) is avoided and the storage tank is only filled to about 5 m.
During the day, before optimisation the total output of the water works had to be reduced significantly below average to empty the storage tank to the desired minimum of 2 m. Using the optimised pump schedule, the total output of the water works is much closer to the average.
The original pump schedule was created real time by the technicians operating the water works, reacting to the observed behaviour of the system. This comprised about 20 switching operations. The optimised pump schedule on the other hand is pre-planned for the next day, using the predicted water consumption and hydraulic modelling. Hence it is much simpler with only 8 switching operations.
With the application of the optimised pump schedule the energy consumption of the network pumps would have been reduced by 916 kWh or 7.5 %. This would have resulted in a reduction of the energy costs by 147 € or 7.2 %. Multiplied by 365 days, the savings sum up to about 54,000 € per year. The percentage decrease of the costs is a little bit less than the percentage decrease of the energy because less cheap energy at night is used to fill the water storage tank.
The results of the optimisation of the pump schedules for New Year’s Day 2015 (figure 6 and figure 7) with the least drinking water consumption in 2015 and for a hot summer day 2015 (figure 8 and figure 9) with a very high drinking water consumption in 2015 show similar pictures.
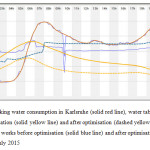
 | Figure 6: total drinking water consumption in Karlsruhe (solid red line), water table in the storage tank before optimisation (solid yellow line) and after optimisation (dashed yellow line) and total output of the water works before optimisation (solid blue line) and after optimisation (dashed blue line) of the 1st of January 2015 Click here to View figure |
The New Year’s Day shows a very interesting drinking water consumption pattern (solid red line in figure 6). An increased drinking water consumption is noticeable at around 1 am, probably people flushing the toilet after having partied through midnight and before going to bed. And apparently, being a public holiday, most people then start the day very late. The total drinking water consumption of this day was only 42,200 m3 which is only about three quarters of the drinking water consumption of an average workday. The energy consumption of the network pumps in the water works added up to 9,550 kWh (0.2263 kWh/m3) which led to energy costs of 1,599 € (0.0379 €/m3).
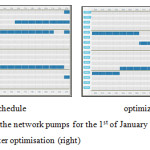 | Figure 7: pump schedules of the network pumps for the 1st of January 2015 from midnight to midnight before (left) and after optimisation (right) Click here to View figure |
The original, real time created pump schedule had 14 switching operations. The optimised, pre-planned pump schedule required only 6 switching operations. With this optimised pump schedule the energy consumption of the network pumps would have been reduced by 772 kWh or 7.6 %. This would have resulted in a reduction of the energy costs by 122 € or 7.7 %.
The drinking water consumption pattern of the 3rd of July 2015 (solid red line in figure 8) as a very hot summer day shows a second strong maximum of drinking water consumption in the evening, when a lot of people water their gardens or shower a second time after coming home from work. The total drinking water consumption of this day was a high as 75,000 m3 which is almost 40 % higher than the drinking water consumption of an average workday. The energy consumption of the network pumps in the water works added up to 17,250 kWh (0.2300 kWh/m3) which led to energy costs of 2,888 € (0.0385 €/m3).
 | Figure 8: total drinking water consumption in Karlsruhe (solid red line), water table in the storage tank before optimisation (solid yellow line) and after optimisation (dashed yellow line) and total output of the water works before optimisation (solid blue line) and after optimisation (dashed blue line) of the 3rd of July 2015 Click here to View figure |
The original, real time created pump schedule had 12 switching operations. The optimised, pre-planned pump schedule required only 5 switching operations. With the optimised pump schedule the energy consumption of the network pumps would have been reduced by 1,065 kWh or 6.2 %. This would have resulted in a reduction of the energy costs by 173 € or 6.0 %.
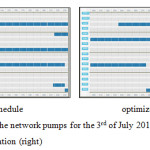 | Figure 9: pump schedules of the network pumps for the 3rd of July 2015 from midnight to midnight before (left) and after optimisation (right) Click here to View figure |
Table 1 summarizes the described results of the optimisation of the pumping schedules of the network pumps of the four Karlsruhe water works using the holistic approach of the smart ICT solution WatEner.
Table 1: Summary of the results of the optimization of pump schedules using the smart ICT solution WatEner
| Original data | Savings through optimization | |||
| Operational Day Typology | Consumption [m3] | Energy efficiency [kWh/m3] | Energy [%] | Energy costs [%] |
| Minimum demand | 42,200 | 0,2263 | 7.6 | 7.7 |
| Average demand | 54,500 | 0.2237 | 7.5 | 7.2 |
| Maximum demand | 75,000 | 0.2300 | 6.2 | 6.0 |
It has to be pointed out that the savings achieved and the ROI which can be realised depends heavily on the size of the Water Utility (population served), energy costs and many additional factors in each particular situation/region – that is the initial state of the network before implementing a solution such as WatEner.
Having tested the tool in a medium-sized city (300,000 inhabitants) of a developed country, it is predicted that expected results for larger cities and Megacities as well as for cities in developing countries are to be at least as good as the ones obtained in the Northwestern Europe pilot.
Obtained results show that a non-structural solution for the water-energy nexus issues can have a great impact on several matters (climate change, carbon footprint, WUs balance sheets, and water losses) with reasonable investment.
These results are obtained by means of a change in WU’s operational paradigm so as to tackle main WU matters:
- A holistic vision. It is possible to evaluate different energy saving strategies in the whole supply network, improving the savings and preventing inefficiencies in other parts of the network.
- Integration and use of existing monitoring infrastructure and hydraulic models.
- Dynamic adaptation to the continuous operational issues that happens in a water supply network, such as temporary halts or services restrictions in some parts of the network for maintenance or failure.
- Flexibility to provide useful recommendations, regardless of the monitoring technical level of the water utility.
Conclusion
Smart ICT tools for water supply network management offer a variety of advantages as opposed to the classical approaches, highly focused on mathematical models. Besides, the big-data/data-analytics paradigm is not enough, because of it has not the ability to include the knowledge gained during the improvements of the operational management. AI methods help to handle the expert managers’ knowledge and are flexible to allow the enrichment of the operational strategies over time, helping in a continuous improvement of the management strategies.
On the one hand, pure mathematical solutions don’t take into account the changing environment of the daily water network operation. The AI contributes to management improvement by including machine learning techniques capable to evolve following the new knowledge gained during network operation. The platform has the ability to accommodate to policy or directives changes, knowledge improvements or infrastructural modifications during time.
On the other hand, the smart ICT solution provides a flexible way to perform the analysis needed to carry out a holistic management of the network; AI methods described are independent of the monitoring level, the network infrastructure or the water utility specific objectives. They only depend on the knowledge of the network managers and provide a mechanism for maintain and improve management strategies by allowing the addition of variables and rules in the multi-criteria analysis to be performed during the daily operational management.
WU managing urban water distribution systems is facing socio-economic, sustainability and resilience challenges, including overuse due to population growth, underestimation of the value of water, lack of coordination among actors, operational issues (ageing, leakages, quality), increasing energy prices and the need for responding to climate change issues. Assessment of the resource efficiency or environmental performance of WU worldwide, though, still lacks a holistic approach. The smart ICT solutions have filled this gap.
By using this ICT tools like WatEner, operational managers can manage water supply and distribution networks more energy efficiently, dynamically responding to fluctuations in short-term demand and considering boundary conditions such as continuity of supply, network pressure, minimum flow, etc. In the same way, the platform provides a highly reliable demand forecasting system that is based on consumption zones, demand patterns and historical data and also contains a customization and parameterization system to calibrate and assess the outcomes.
E.g., a case study in Karlsruhe, a city of 300,00 inhabitants in Northwestern Europe, documents the potential of saving about 7 % of the energy used by the network pumps of the water works there by using the holistic approach of a smart ICT solution.
References
- CAF. Bases para una agenda del agua en América del Sur. (2015).
- Energy Department, USA Government. The Water-Energy Nexus: Challenges and opportunities. (2014).
- Amir Cahn, Intelligent Utility. The Smart Water-Energy Nexus. (2014).
- Royan Fredrick, Global Env. Water Markets. Global Smart Water Market ‘Unearthing the REAL Value of Water and the Industry’ (2012).
- Maxwell S. Water Market Review. A concise review of challenges and opportunities in the world water market. (2012)
- Electric Power Research Institute. U.S. Electricity Consumption for Water Supply & Treatment - The Next Half Century. Water & Sustainability. 4,(2012)
- EU EIP-Water. Progress towards sustainable energy. (2015).
- Nogueira. Energy and hydraulic efficiency in conventional water supply systems. (2014).


