Is That Environmental Factor Affected the Distressed Farmers’ Most!? - An Exploratory Factor Analysis of Constraint and Amelioration Strategies in National Calamity Hit Region of India
Sudhanand Prasad Lal1 * , K.S. Kadian1 , Workneh Abebe Wodajo2 and Shruti 3
http://dx.doi.org/10.12944/CWE.11.3.22
The Kosi River is infamous in India for its rapid and recurrent changes of course and the widespread flood damages it causes almost annually. But, the flood of 18th August, 2008 was the most devastating down the memory lane of the survival. The destruction was of such a magnitude that state government of Bihar had to seek World Bank (Project ID: P122096) assistance. Keeping this in view, an earnest effort was made to study the perceived constraints of distressed farmers and strategies for its amelioration. To materialize pretested closed structured interview schedule the application of the principle axis factoring vis-à-vis exploratory factor analysis (EFA) was done among 60 respondents from the non-sample. EFA extracted 4 latent broad constraints having Eigen value >1 that was rechristened as: environmental, pecuniary, policy and miscellaneous constraints. Finally, 20 specific constraints under 4 broad constraints were used to collect data from 160 respondents in the sample area. Garret methodology was used to rank the specific constraints under broad constraints. Friedman two-way ANOVA by ranks test deciphered that severity order of broad constraints was environmental, pecuniary, miscellaneous and policy constraints respectively. Since, the World Bank project is running in full swing in the calamity stricken region and so the four broad constraints as well as the 20 specific constraints identified and suggestion to ameliorate these can be vital for policy formulation and its implementation. The authors also suggest that in case of dearth of fund the most severe environmental constraints should be given due weightage followed by severity of other broad constraints.
Copy the following to cite this article:
Lal S. P, Kadian K. S, Wodajo W. A, Shruti. Is That Environmental Factor Affected the Distressed Farmers’ Most!? - An Exploratory Factor Analysis of Constraint and Amelioration Strategies in National Calamity Hit Region of India. Curr World Environ 2016;11(3). DOI:http://dx.doi.org/10.12944/CWE.11.3.22
Copy the following to cite this URL:
Download article (pdf) Citation Manager Publish History
Introduction
Third world countries suffer from water, food, and health problems which are further aggravated by natural calamities.1 Coming to India, the subcontinent is extremely susceptible to major natural calamities viz., earthquakes, tsunamis, cyclones, floods, droughts, avalanches, storms, landslides, unseasonal torrential rains, hailstorm, lightning and bushfires. In 2015, 19.2 million people displacements by natural calamities worldwide in 113 countries but India bore the brunt for the highest numbers of displaced people.2 These calamities sternly distress the farming communities because their produce is under open sky exposed to every type of extreme events. Kosi flood that happened way back on 18th August, 2008 was declared as "National Calamity" and so far, it is the single calamity in the history of India to be officially declared as a "National Calamity".3 In fact, erstwhile Prime Minister of India conducted aerial survey of flood damage in Bihar and issued press release on August 28, 2008 declaring it as national calamity. The flood caused one of the largest evacuation operations with over 1 million people evacuated, and about 460,000 people accommodated in 360 relief camps.4 Above 90 percent of the calamity hit population was reliant on agricultural livelihoods which were severely affected impacting close to 500,000 farmers. The calamity was of such a magnitude that its memory is still vivid in the memory of the respondents. It took almost 2 years to prepare need assessment report of the distressed area and eventually World Bank approved US$ 259.00 million for Bihar Kosi flood amelioration project (Project ID: P122096) by closing date on June 30, 2018.5 Moreover, sustainable restoration efforts after a calamity to resolve constraints can help in reviving the local economy and bring back livelihoods. In this background, the present study was conducted with the following three objectives:
To enlist major constraints faced by the farming community post calamity in order to attain sustainable livelihoods.
To divulge the broad latent constructs with scientific parsimony vis-à-vis constraints through EFA and consequently rank them via Friedman ANOVA test.
iii) To suggest strategies for ameliorating the constraints
Materials and Methods
Locale of the study and Sampling plan
Bihar (the calamity affected region of India in 2008) is divided into 38 districts, of which five districts viz., Supaul, Madhepura, Saharsa, Araria and Purnia, were severely affected by the flood. Out of which, two districts viz., Supaul and Madhepura were most affected and therefore, were purposively selected for the study. It would be noteworthy to mention that the selected districts are still lagging behind the national average for many parameters.6 Two affected blocks from each district and from each block, two villages were randomly selected. Among these selected villages, 20 respondents were selected by multistage random sampling making a final sample size of 160 respondents from eight villages. After selection of the villages, a reconnaissance survey was conducted in the selected villages to figure out the total number of farmers who were affected by the calamity but still practicing farming as a source of livelihood. ‘Exploratory research design’ was used to divulge the constraints.
Instrument for item selection for constraints
Constraints for the present study were operationalized as hurdles encountered by the farmers in achieving the livelihood security. The item selection for constraints was initially done through both the electronic as well as print media—newspapers, the Government of Bihar website, YouTube. Consequently, focused group discussions were conducted in non-sample area of calamity distressed region among respondents and key informants. In order to devise pretested closed structured interview schedule data were solicited from 60 respondents from the non-sample area, who were also affected by calamity but were different from the actual sample size of 160 respondents.
Exploratory Factor Analysis
The constraint wise score of each of the 60 respondents from non-sample area was undergone to factor analysis by Exploratory Factor Analysis (EFA) method using SPSS version 23 launched in 2015. Factor analysis is an interdependence technique for identifying clusters of latent variables for a large number of variables in order to bring scientific parsimony.7 The constraints were used for determining latent factors governing livelihood security of the jth respondent by using the given formula:
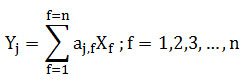
Yj : Constraints of jth respondent
aj, f : Scoring of the fth constraints by jth respondent
Xf : fth constraints
n : Number of constraints
Data Analysis
After completion of data collection from 160 respondents, the collected data were coded, tabulated, classified and further categorized using Garrett’s Ranking methodology8 and Friedman9 two-way ANOVA by ranks test. Garret ranking method was used to assess the constraints in achieving the livelihood security through different means of livelihood. Through EFA 4 different types of latent broad constraints were identified viz., environmental, pecuniary, policy and miscellaneous constraints. The top most frequent constraints were selected for the purpose of their prioritization by means of using Garret Ranking Technique. Then, the respondents were asked to rank each of the constraint relevant to them according to the degree of importance as perceived by them. As all the items were not ranked same by all the respondents the method of combining of incomplete order of merit ratings as suggested by Garret 8 was followed. At first respondents were asked to rank the specific constraint. The orders of merit thus given by the respondents were converted into percent position by using the formula:
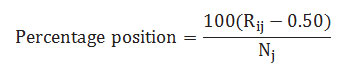
Rij refers to rank given for the ith constraints by jth individual and Nj refers number of constraints ranked by the jth individual. The percent position for each rank thus obtained was converted into scores by referring the table given by Garrett.8 The mean scores were calculated for each constraint and the appropriate rank was given accordingly. Friedman9 two-way ANOVA by ranks test was conducted to identify the most severe constraints among the four broad constraints faced by calamity affected farmers by using the following formula of difference between treatments or conditions:
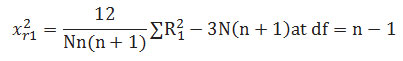
N= number of subjects, respondents or groups
n= number of treatments or broad constraints
ΣR12= row ranks summed up in each column, squared and then added
Results and Discussion
Suitability test of data for conducting Exploratory Factor Analysis
Before extraction of the exploratory factors, several tests were performed to evaluate the fitness of the respondent data (n=60) from non-sample area for EFA. The battery of tests included Kaiser-Meyer-Olkin (KMO) Measure of Sampling Adequacy and Bartlett's Test of Sphericity (BTS). The KMO was employed to figure out whether employing factor analysis to extract latent variables was appropriate or not. Initially, there were 24 statements encompassing constraints but the 4 statements were dropped because either their factor loadings were ≤0.50 or communalities were ≤0.60.9 So, the EFA was rerun and the final KMO statistic obtained in this study was 931 (Table 1). Kaiser's10,11,12 specified calibration of the value and according to it, KMOs in the .90s is ‘marvelous’, so the sample selected in this study was adequate for EFA. The BTS was significant (p<.001) and so factor analysis was established to be apposite.
Table 1: Test of sampling adequacy and its significance level (n=60).
|
KMO and Bartlett's Test |
||
|
Kaiser-Meyer-Olkin Measure of Sampling Adequacy |
.931 |
|
|
Bartlett's Test of Sphericity |
Approx. Chi-Square |
947.273 |
|
df |
190 |
|
|
Sig. |
.000 |
|
Exploratory Factor Analysis following principal axis factoring with promax rotation
After checking suitability of the data among 60 respondents from non-sample area, EFA was performed to devise pretested closed structured interview schedule following principal axis factoring and promax rotation (Table 2). Only variables with factor loadings (factor-variable correlations) >0.50 were used in selecting the factors.10,12 Commonly used methods of EFA require estimation of communality values before the process of factor extraction. So, variables having communalities after extraction >0.6 was chosen for the present study.9 It would be worth mentioning that primarily 24 statements comprising constraints were taken but the 4 statements were dropped because they couldn’t cross factor loadings or communalities benchmark. In 2nd run EFA 4 different types of latent broad constraints were identified based on Eigen values ≥1 viz., environmental (6 statements), pecuniary (5 statements), policy (5 statements) and miscellaneous (4 statements) constraints (Table 3, 4, 5 and 6). From Table 2 it is evident that four factors (Eigen values ≥1) explained 66.146% variance in the dataset, which is pretty above the customary level of 60%.9
Table 2: ‘Rotated Factor Matrix (RFM)’ with Communalities (h2), eigen values, cumulative explained variance (CEV%) (n=60)
|
Variables† |
RFM1 |
RFM2 |
RFM3 |
RFM4 |
h2 |
|
F1 |
0.851 |
-0.051 |
0.155 |
0.128 |
0.767 |
|
F2 |
0.797 |
-0.330 |
0.128 |
-0.051 |
0.763 |
|
F3 |
0.645 |
0.313 |
0.326 |
-0.364 |
0.753 |
|
F4 |
0.602 |
0.254 |
-0.127 |
0.431 |
0.629 |
|
F5 |
0.563 |
0.280 |
0.434 |
-0.187 |
0.619 |
|
F6 |
0.509 |
0.147 |
0.269 |
0.498 |
0.601 |
|
F7 |
0.136 |
0.747 |
-0.040 |
0.338 |
0.692 |
|
F8 |
0.187 |
0.739 |
0.113 |
-0.113 |
0.607 |
|
F9 |
0.472 |
0.622 |
0.035 |
0.002 |
0.611 |
|
F10 |
0.245 |
0.619 |
0.351 |
0.195 |
0.604 |
|
F11 |
0.435 |
0.588 |
-0.041 |
0.303 |
0.628 |
|
F12 |
0.162 |
0.243 |
0.691 |
0.224 |
0.613 |
|
F13 |
0.197 |
0.469 |
0.658 |
0.147 |
0.713 |
|
F14 |
-0.308 |
-0.394 |
0.649 |
0.124 |
0.687 |
|
F15 |
0.527 |
0.210 |
0.613 |
-0.133 |
0.715 |
|
F16 |
0.257 |
0.305 |
0.592 |
0.348 |
0.631 |
|
F17 |
-0.074 |
0.480 |
0.120 |
0.617 |
0.631 |
|
F18 |
0.451 |
-0.256 |
0.324 |
0.603 |
0.738 |
|
F19 |
0.351 |
0.273 |
-0.266 |
0.591 |
0.618 |
|
F20 |
0.413 |
0.303 |
-0.142 |
0.572 |
0.610 |
|
Eigen values |
4.246 |
3.628 |
2.832 |
2.524 |
|
|
CEV % |
21.229 |
39.366 |
53.527 |
66.146 |
|
|
†The sequential nomenclature of variables 1 to 20 is in Table 3, 4, 5 and 6 respectively |
|||||
Identification of constraints in attaining ‘livelihood security’ by the respondents
A study of this nature would be incomplete, if the constraints perceived by the farmers in achieving the livelihood security were not identified; and the suggestions to mitigate the seriousness of constraints were not discussed. Hence, it was thought crucial to analyze the constraints as perceived by the farmers in achieving the livelihood security. In the study area, an attempt was made to know the constraints faced by the farmers through EFA and it extracted 4 different types of broad latent constraints; these were environmental, pecuniary, policy and miscellaneous constraints. The 160 respondents were asked to rate the seriousness of the specific constraints under 4 broad domain. The constraints perceived by respondents had been ranked on the basis of Garrett’s ranking method 8 and later 4 broad constraints were ranked by Friedman9 ANOVA test.
Environmental constraints perceived by the respondents and its amelioration
Among the environmental constraints presented in Table 3 poor quality of land due to sand casting/undulation/erosion (xÌ„=75.43). was rated as most serious constraints by almost all the respondents. After flood in 2008 a large proportion of land in the study area became unproductive due to sand casting/undulation/erosion. Lack of knowledge to tackle the natural calamity in crop protection (mean score=63.37). was rated as second most serious constraints by the respondents. This was due to the fact that crop protection measures such as adoption of ‘flood resistant varieties’ or varieties that can grow well in sandy soil were less known to the native farmers. ‘Outbreak of rats after Kosi flood 2008 (xÌ„=59.72). was ranked third serious constraints perceived by the respondents. There was a famous saying in the study area that, “after flood, there were flood of rats also”. Outbreak of rats was due to several reasons: i) Many of the rat species live well in sandy soil ii) Rats had got many new breeding ground after 2008 flood, as a good proportion of land was left barren due to its unsuitability for crop production iii) Rats tended to migrate from their breeding ground (barren land) to their feeding ground (cultivated land) through their underground tunnel system. Rats were damaging potato, maize (corn) etc. by cutting the plant from its base and took it to its burrows iv) In lean season it also feed on the juicy roots of Kans grass (Saccharum spontaneum), which was available in plenty in the study locale after flood.4 ‘Disrupted canal systems due to sand accumulation/breakage’ (mean score= 48.31)” was perceived as the forth important constraint by the respondents. Many of canal systems and irrigation sources were damaged by 2008 flood and of which majority of them were still not repaired. ‘Environmental safety measures: such as knowledge about recommended dosage of fertilizer/pesticides, soil and water conservation practices is less known to the farmers (mean score=41.28)” was perceived as the fifth severe constraint by the respondents. This was because of lack of knowledge and awareness about ‘environmental safety measures’. A large part of respondents were not aware about the suitable doses of fertilizer/pesticides application in the respective crops. The sixth ranked constraint was ‘premature fall and reduction in size of coconut fruits’. Respondents complained that mobile tower radiations were responsible for ‘premature fall and reduction in size of coconut fruits’. Similar type of complain was reported— to the scientists of Assam agricultural university (AAU), India by the farmers13 and to ‘Bangladesh Telecommunication Regulatory commission (BTRC)’ by an NGO.14 AAU has not published its finding yet and BTRC said— ‘evidence was not conclusive’. However, Debnath and Bora15 confirmed the reduction in Coconut number by more than 300% from 2006 to 2014 of Dhing Suburban area in Assam, India after installation of mobile tower in 2006, but the authors still believe that more concrete research is yet to be conducted.
For ameliorating environmental constraints community based campaign and support is required and it must be copiously backed by the government. To manage ‘environmental safety measures’ fallout— sensitization of the local farmers by the extension personnel is prerequisite.
Table 3: Ranking pattern of environmental constraints (n=160)
|
Sl. No. |
Constraints (Friedman Mean Rank Value Score= 3.63) |
(x̄) |
Rank |
|
1. |
Poor quality of land due to sand casting/undulation/erosion |
75.43 |
I |
|
2. |
Lack of knowledge to tackle the natural calamity with respect to crop protection |
63.37 |
II |
|
3. |
Outbreak of rats after Kosi flood 2008 |
59.72 |
III |
|
4. |
Disrupted canal systems due to sand accumulation/breakage during calamity |
48.31 |
IV |
|
5. |
Environmental safety measures: such as knowledge about recommended dosage of fertilizer/pesticides, soil and water conservation practices is less known to the farmers |
41.28 |
V |
|
6. |
Premature fall and reduction in size of coconut fruits |
34.15 |
VI |
|
Note: According to Garrett’s Ranking method for 6 statements, the range could be from 23 to 77 |
|||
Pecuniary constraints perceived by the respondents
Table 4 divulges that the respondents perceived ‘low price of farm produce in the market, (mean score=70.18)’ as most serious constraints among all the pecuniary constraints. Despite of being the farm hub from many centuries, there were still no farm cooperatives in the study locale. So, farmers had to sell their produce to the middle-man by giving them opportunities of reaping most of their benefits. Only exception was maize for which ‘farm gate prices’ paid by purchasers was considerably high. The next in order of sternness was ‘delay in getting compensatory money in case of crop damage due to natural calamity (mean score=61.93)’. As in study area red-tapism and corruption was clearly evident. ‘Lack of availability of credit to start any new enterprise (mean score=58.57)’ was perceived as the third key constraint by the respondents. This was due to the fact that banks were unwilling to provide them loans due to their poor track records in returning loans. ‘Higher input cost of agricultural farming (mean score, xÌ„=45.29)” was perceived as the forth severe constraint by the respondents. The cost of maize seed was sky-rocketing that was at the rate of Rs.350-400/kg. The fifth ranked constraint was ‘desire to get kickback from farmers while sanctioning loan to farmers by bank personnel’.
For ameliorating pecuniary constraints major reform is required such as open marketing network is essential to provide fair and remunerative price of the farm produce. Government commitment is required to provide hassle free compensatory money in case of crop damage and to reduce higher input cost of agricultural farming. To resolve the ‘credit and kickback crisis’ trust is to be rebuilt between bank and farmers.
Table 4: Ranking pattern of pecuniary constraints
|
Sl. No. |
Constraints (Friedman Mean Rank Value Score= 3.07) |
x̄ |
Rank |
|
1. |
Low price of farm produce in the market |
70.18 |
I |
|
2. |
Delay in getting compensatory money in case of crop damage due to natural calamity |
61.93 |
II |
|
3. |
Lack of availability of credit to start any new enterprise |
58.57 |
III |
|
4. |
Higher input cost of agricultural farming |
45.29 |
IV |
|
5. |
Desire to get kickback from farmers while sanctioning loan to farmers by bank personnel |
38.45 |
V |
|
Note: According to Garrett’s Ranking method for 5 statements, the range could be from 25to 75 |
|||
Policy constraints perceived by the respondents
Among the policy constraints construed in Table 5 ‘lack of knowledge about the agricultural schemes and subsidy (xÌ„=68.73)’ turn out to be the most grave constraint by the respondents. As the study area was one of most backward region of India and majority of them were illiterate (Lal et al., 2015). So, they were not aware about schemes/subsidy given by Governments/NGOs to them. The next in order of seriousness was ‘lack of commitment of government functionaries in proper implementation of any programmes/schemes in Kosi region (xÌ„=57.69)’. Many programmes were announced for the Kosi region but only few of them were executed properly. ‘Lack of ample sources of remunerative employment generation in the village (mean score=49.17)” was perceived as the third key constraint by the respondents. This was one of the main reasons of migration in the study area. In the year 2009 (next year after the national calamity), 74 (46.25%) out of 160 respondents migrated in search of their livelihood. Not even a single food processing industry was present in the study locale. So, there was very less scope of their remunerative livelihood diversification. ‘Non availability of inputs such as seeds, fodder, pesticides, fertilizers etc. in appropriate time (mean score=41.32)” was perceived as forth solemn constraint by the respondents. There was chronic shortage of agricultural inputs in the study area that gave plenty of space for black marketeer in the study area. ‘High labor wages (mean score=29.47)’ was perceived as the fifth major constraint by the respondents as most of the labourers were now getting job and money under the Mahatma Gandhi National Rural Employment Guarantee Act (MGNREGA). It would be significant to mention that World Bank Group's recently ranked MGNREGA as the world's largest public works programme.16
For ameliorating policy constraints i.e. ‘knowledge about agricultural schemes and subsidy’ mass awareness campaign is obligatory. Regarding commitment of government functionaries and for providing agricultural inputs within the specified period of time’, forthright and candid attitude of government was felt mandatory. For employment generation MGNREGA was prerequisite but it needs a rider to resolve labor crisis i.e. employment under this scheme should be interdicted during agricultural peak season of sowing and harvesting.
Table 5: Ranking pattern of policy constraints
|
Sl. No. |
Constraints (Friedman Mean Rank Value Score= 1.86) |
(x̄) |
Rank |
|
1. |
Lack of knowledge about the agricultural schemes and subsidy |
68.73 |
I |
|
2. |
Lack of commitment of government functionaries in proper implementation of any programmes/schemes in Kosi region |
57.69 |
II |
|
3. |
Lack of ample sources of employment generation in the village |
49.17 |
III |
|
4. |
Non availability of inputs such as seeds, fodder, pesticides, fertilizers etc. in appropriate time |
41.32 |
IV |
|
5. |
High labor wages |
29.47 |
V |
Miscellaneous constraints perceived by the respondents
From Table 6 poor availability of electricity (mean score=67.81) was figured out to be the most serious constraint by the respondents, as Bihar state of India has the lowest per capita power availability and the situation was worst in the study area i.e. the Kosi belt of north Bihar.17 Many of the respondents couldn’t irrigate their land from bore-well in time due to shortage of electricity. Duplicity of agricultural input like seed, fertilizer etc. (mean score=59.73) was perceived as the second key constraint by the respondents. Fake fertilizer/seed rackets were active in the study area and many of them were busted by cops recently. Duplicity was prominent in DAP fertilizer and Pioneer-3522 (seed variety of Maize). Land identification (mean score=54.68) was perceived as the third major constraint by the respondents. After the calamity the boundaries of the land-holdings of majority of the farmers were washed away. So, they were getting difficulties in identification of their land-holdings and this was one of the major reasons of conflicts in the study area. Lack of awareness of suitable technical knowledge for improving farm productivity (mean score=47.19) was perceived as forth glumly constraint by the respondents. This was because Agriculture Science Centre funded by Indian Council of Agricultural Research (popularly known as Krishi Vigyan Kendra or KVK) and other agricultural training bodies were far away from the study locale.
For ameliorating miscellaneous constraints a rigorous state governmental commitment is required because state power board was unable to buy more electricity due to poor financial health. Moreover, many electrical towers were disrupted due to flood. Duplicity of agricultural input can be curbed by joint effort of farmers and local cops. To answer land identification dispute state government should issue an order to Lekhpal (village land record-keeper) for measurement of land in disputed land. Lack of awareness of suitable technical knowledge for improving farm productivity was the unfelt need among the farmers but it is mandatory for sustainable agricultural growth. In addition, several institutional building were damaged due to calamity, consequently resulting in disruption of knowledge awareness system.
Table 6: Ranking pattern of miscellaneous constraints
|
Sl. No.
|
Constraints (Friedman Mean Rank Value Score= 2.95) |
x̄ |
Rank |
|
1. |
Poor availability of electricity |
67.81 |
I |
|
2. |
Duplicity of agricultural input like seed, fertilizer etc. |
59.73 |
II |
|
3. |
Land identification |
54.68 |
III |
|
4. |
Lack of awareness of suitable technical knowledge for improving farm productivity |
47.19 |
IV |
|
Note: According to Garrett’s Ranking method for 4 statements, the range could be from 27-73 |
|||
Severity level of broad constraints
Last but not the least, Friedman test was employed to know the severity level of all the 4 broad constraints deciphered thorough EFA. Asymptotic significance obtained from the Friedman test was 0.000 (p<0.001) with chi-square value of 93.573 having 3 degree of freedom (Table 7). Significance value expounded Monte Carlo significance at 99 percent Confidence Interval (CI) and hence it could be interpreted that there was significant difference among the 4 broad constraints. Table 3, 4, 5 and 6 further revealed that the mean ranks obtained by the application of Friedman test was highest for environmental constraints (3.63) which means that it was most severe constraint among all the four broad constraints. The mean rank of policy constraints was 1.86 which implied that it was the least severe broad constraints. Pecuniary and miscellaneous constraints mean rank score was 3.07 and 2.95 respectively conferred with rank 3rd and 4th.
Table 7: Test Statistics of Friedman test
|
Test Statistics Values |
|||
|
N |
160 |
||
|
Chi-Square |
93.573 |
||
|
df |
3 |
||
|
Asymp. Sig. |
.000 |
||
|
Monte Carlo Sig. |
Sig. |
.000 |
|
|
99% Confidence Interval |
Lower Bound |
.000 |
|
|
Upper Bound |
.000 |
||
Conclusion
In this manuscript an attempt was made to enlist and give suggestion to ameliorate the major specific constraints faced by the farming community post national calamity of 18th August, 2008. Divulgence of broad latent constraints through EFA and consequently rank them via Friedman ANOVA test was materialized. The results of factor analysis by EFA among 60 respondents in the non-sample area revealed four broad latent constraints viz., environmental, pecuniary, policy and miscellaneous constraints explaining 66.146% of the variance in the data set. Eventually, 20 specific constraints under 4 broad constraints were scored among 160 respondents in the actual sample area. Ranking of specific constraints under broad constraints was done through Garret Ranking Technique. Friedman two-way ANOVA by ranks test construed that severity order of broad constraints was environmental, pecuniary, miscellaneous and policy constraints respectively. So, the state government must focus on all the 4 broad constraints but in case of paucity of fund the most severe broad constraints identified i.e. environmental constraints should be given due priority. As the World Bank project is still running in full swing in the distressed area—four broad constraints as well as the 20 specific constraints identified and suggestion to ameliorate these can be vital for policy formulation and its implementation.
Acknowledgement
The author acknowledges the Indian Council of Agricultural Research (ICAR), Government of India for financial support to carry out research work.
References
- Bouwer, H. 2003. Integrated water management for the 21st century: Problems and Solutions. J. Food, Agri. Environ. 1: 118-127.
- GRID. 2016. Global report on internal displacement (GRID) 2016, new displacements associated with conflict and disasters in 2016, Internal Displacement Monitoring Centre (IDMC) data as of 31st December 2015. URL http://www.internal-displacement.org/globalreport2016/
- Lal, S. P., Kadian, K. S., Jha, S. K., Sharma, A. K., Goyal, J., Kumar, R. S., Chauhan, A. K., Singh, S. R. K. and Singh, S. P. 2015. Change in livestock holdings, adaptation strategies and livelihood security of the farmers affected by national calamity in Bihar, India. Indian J Dairy Sci. 68: 83-90. URL http://epubs.icar.org.in/ejournal/index.php/IJDS
- Government of Bihar report to World Bank. 2010. Need assessment report: Bihar Kosi flood 2008. Report submitted to World Bank on June, 2010. URL https://www.gfdrr.org/sites/gfdrr.../GFDRR_India_PDNA_2010_EN.pdf
- World Bank. (2010). Bihar Kosi Flood Recovery Project, Project ID: P122096. URL http://www.worldbank.org/projects/P122096/bihar-kosi-flood-recovery-project?lang=en&tab=details
- Lal, S. P., Kadian, K. S., Jha, Singh, S. R. K., Goyal, J., Kumar, R. S., and Singh, S. P. 2014. A resilience scale to measure farmers’ suicidal tendencies in national calamity hit region of India. Curr World Env. 9: 1001-1007. URL http://www.cwejournal.org/vol9no3/a-scale-to-measure-farmers-resilience-in-relation-to-their-life-in-nation-calamity-hit-area-of-india/
- Field, A. 2005. Discovering statistics using SPSS: sex, drugs and rock 'n' roll. (2nd edition) pp. xxxiv+779p., Sage, Thousand Oaks, California, USA.
- Garret, H. E. 1979. Statistics in psychology and education. Sixth edition, Vakils, Feffer and Simons Ltd., Mumbai, India.
- Friedman, M. 1939. A Correction: The use of ranks to avoid the assumption of normality implicit in the analysis of variance. J. Amer. Statist. Assoc. 34: 109.
- Lal, S. P., Mohammad, A., Ponnusamy, K. and Kale, R. B. 2016. A methodological pathway to quantify perception of the participants in animal fairs with relevance to national dairy mela at NDRI Karnal, India. J Anim Res. 6: 437-444. URL http://ndpublisher.in/lastissuearticle.php?journal=JAR&issue=Issue%203&volume=Volume%206#
- Kaiser, H. 1974. An index of factorial simplicity. Psychometrika 39: 31-36.
- Lal, S.P., Mohammad, A., Ponnusamy, K. and Kale, R.B. 2016a. Expectation of participants in national dairy fair of India: A complete itemization by multivariate analysis. Indian Journal of Animal Science. 86(8): 940–946.
- Patowary, A. 2011. Coconut output hit by mobile phone signals? Published in ‘The Assam Tribune’ Guwahati, Assam, India on June 15, 2011. URL http://www.assamtribune.com/scripts/detailsnew.asp?id=jun1511/at09
- The Independent. 2012. Mobile towers’ radiation poses threat hazards, Dhaka Mirror. URL http://www.dhakamirror.com/other-headlines/mobile-towers-radiation-poses-threat-hazards/
- Debnath, D. and Bora, M. 2015. A survey on the impact of cell phone tower radiations on some nut and banana plant. International Journal of Advance Research in Science and Engineering, 4: 166-171. URL www.ijarse.com/images/fullpdf/1421488655_206.pdf
- Honorati, M., Gentilini, U. and Yemtsov, R. G. 2015. The state of social safety nets 2015. Washington, D.C.: World Bank Group. URL http://documents.worldbank.org/curated/en/2015/07/24741765/state-social-safety-nets-2015
- Central Electricity Authority. 2016. Load Generation Balance Report (LGBR) 2016-17, Ministry of Power, Government of India. URL www.cea.nic.in/reports/annual/lgbr/lgbr-2016.pdf


