Seasonal Variation in Physico-Chemical and Microbiological Characteristics of Sewage Water from Sewage Treatment Plants
Karthika Velusamy1 * and J Kannan1
http://dx.doi.org/10.12944/CWE.11.3.14
The present research deals with the study of physico-chemical and bacteriological characteristics of sewage water collected from three different sites of Coimbatore during two consecutive seasons. Seasonal variations indicated that the most of the nutrients (viz., total N, phosphates) and salts (nitrates, chlorides and sulphates) are present abundantly at pre-monsoon and the physical characters like TSS (600 mg/L) are more at post-monsoon. Multiple comparisons made using analysis of variance showed that the Ukkadam sampling point varies significantly from other two points. The total coliform count for the Ukkadam samples were >2400 (MPN/100ml) in raw sewage. This study concludes that the physicochemical characters and microbiological characters are outrageous in the raw sewage and upon the treatment the undesirable characters are reduced. Studies on the sewage characteristics of treatment plants are crucial to know the pollutant levels upon the various time scales and the treatment status which is necessary to improve the state of the art of the treatment process.
Copy the following to cite this article:
Velusamy K, Kannan J. Seasonal Variation in Physico-Chemical and Microbiological Characteristics of Sewage Water from Sewage Treatment Plants. Curr World Environ 2016;11(3). DOI:http://dx.doi.org/10.12944/CWE.11.3.14
Copy the following to cite this URL:
Velusamy K, Kannan J. Seasonal Variation in Physico-Chemical and Microbiological Characteristics of Sewage Water from Sewage Treatment Plants. Curr World Environ 2016;11(3). Available from: http://cwejournal.org?p=967/
Download article (pdf) Citation Manager Publish History
Introduction
All around the world, water scarcity is an increasing problem and it is interlinked with water contamination and pollution. As per WHO estimates, the average water use for a person is about 280 litres per day.19 After usage, the water is returned to environment as “wastewater”. This domestic wastewater from its origin to treatment system on its way blended with some of the industrial wastes, pharmacy wastes and also agricultural runoff and termed as “sewage water”. Finally, the sewage water is heavily polluted with heavy metals, pharmaceutical compounds, nutrients and all the local wastes specific to the particular locality.
Sewage water is complex in nature which requires specialized treatment systems depending on the composition. Sewage composition shows discrepancy from one location to another and it is heavily influenced by biotic and abiotic factors.18 Biotic factors include humans and their socio-economical behaviour whereas the abiotic factor encompasses all the wastes from food wastes to industrial wastes that are added on its way to treatment.
Globally, 1.8 billion people are using a source of drinking water that is contaminated with faecal matter.20 Faecal contamination indicates the mixing of untreated or improperly treated sewage with drinking water. This shows the importance and necessity of proper functioning of the sewage treatment plants. The treatment system design should be based on the sewage water characteristics and also the location where it is operated.11 The raw wastewater characteristics give the sewage composition of the particular region whereas the treated effluent characteristics help to improve the existing treatment system. Keeping the above mentioned points, the present study was designed to check the physico-chemical characteristics of sewage water taken from three different sewage treatment plants in two different seasons before and after treatment.
Materials and Methods
Sample Collection
Samples were aseptically collected from three different points viz., collection tank (raw sewage water) and output (treated sewage) at TNAU sewage treatment plant, Karunya sewage treatment plant and Ukkadam sewage treatment plant. For seasonal variation studies the samples were collected from the same sites during pre-monsoon (May, 2015) and Post monsoon (November, 2015). Samples were collected in the morning (8 A.M to 11 A.M) and stored in sterile polytetrafluoroethylene bottles at 4°C for analysis. The sampling was done over a period of 10 days to rule out the possibilities of incidental sewage flow. Samples were analyzed for physico-chemical and biological characteristics in Fermentation laboratory, Department of Environmental sciences, Tamil Nadu Agricultural University, Coimbatore, Tamil Nadu, India.
Physico-Chemical Analysis
The pH and Electrical conductivity were measured using the pH meter and EC meter. The pH meter (Elico® LI 20) and EC meter (Hanna instruments, EC 215) are calibrated with pH buffer(4.0, 7.0 and 9.2) and saturated KCl before taking the reading. Dissolved oxygen (DO), Biochemical oxygen demand (BOD), Chemical oxygen demand (COD), Total dissolved solids (TDS), Total suspended solids (TSS),Total alkalinity (TA), Total Kjeldahl Nitrogen (TKN), Ammoniacal Nitrogen (NH4-N), Nitrates (NO3), Sodium (Na), Potassium (K), Calcium (Ca), Magnesium (Mg), Chlorides(Cl-), Sulphates (SO42-) were analyzed by standard methods given in table 1.3 For heavy metal analysis, 10 ml of samples were taken in 100 ml conical flask followed by adding 15 ml of aqua-regia (HCl : HNO3 @ 3:1). Then the acid digested content was filtered through Whatman No.40 filter paper and the heavy metal was analyzed using an Atomic Absorption Spectrophotometer (AAS) with air- acetylene flame (PERKIN ELMER).
Bacteriological Analysis
The media used for the bacteriological analysis of water include nutrient agar (NA), lactose broth (LB), Rose bengal agar and Kenknight medium for bacteria, coliforms, fungi and actinomycetes respectively. Serial dilution method was used for total viable count of bacteria, fungi and actinomycetes and MPN method was followed for enumeration of coliforms. The sterility of each batch of test medium was confirmed by incubating one uninoculated tube or plate along with the inoculated tests. The uninoculated tubes or plates were always examined to show no evidence of bacterial growth.
Data Analysis
Comparison for variations among the three sampling sites was done using one way ANOVA. Datasets demonstrated significant variations were subjected to Tukey’s post hoc test for multiple comparisons. Paired t-test was used to analyze the seasonal variations (pre-monsoon and post monsoon) and treatment differences (raw and treated sewage). Relationships between selected physico-chemical parameters (p<0.05) in the samples was carried out using Pearson’s correlation.
Results
Physical characteristics of sewage samples
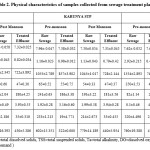
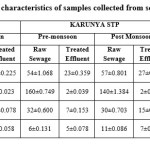
Physical characteristics of water samples collected from the sewage treatment plants were listed in the Table 1. The data shows that pH, EC, TSS, TDS and TA were all within the limits of general standards for discharge of environmental pollutants by Environmental protection rules, 1986. However, Ukkadam raw sewage had the significantly (p<0.05) higher levels of pH, EC, TDS, TDS and TA than the other three sampling sites. Paired t test revealed that pH, EC, TDS, TDS and TA were significantly high (p<0.05) in the pre-monsoon. Raw sewage in the collection tank had significantly (p<0.05) lower pH in pre-monsoon at all the three sampling sites and in Ukkadam tank it is quite lower than other plants. EC is comparatively much higher (2.92 dSm-1(pre-monsoon), 2.55dSm-1(post monsoon) in raw sewage from the Ukkadam collection tank that is reduced significantly (p<0.05) after the treatment. Paired comparison using t-test indicated that TSS was significantly high (p<0.05) in the post monsoon season, while TDS was significantly high (p<0.05) in the pre-monsoon. After the treatment both TDS (p=0.0054) and TA(p=0.0029) had significantly (p<0.05) reduced. Most of the DO values in raw sewage were below 3 ppm which is minimum level required for the survival of the aquatic organisms. DO values of raw sewage were significantly (p<0.05) low in pre-monsoon (1.93, 1.92 and 0.1 in TNAU, Karunya, Ukkadam repectively). Treated sewage had considerably higher DO levels and significantly increased levels (p<0.05) is noted in Ukkdam treated sewage in the post monsoon season. Analysis of variance showed that there was no significant difference in the DO (p=0.0005) and TA (p=0.0204) values of both raw and treated sewage from the three different sites. Tukey’s pos hoc test results indicated that the raw sewage from Ukkadam site had significantly different values from the TNAU (p=0.0058) and Karunya (p=0.0060). Seasonal variation indicated that BOD (p=0.0062) and COD (p=0.0012) levels were significantly high in the pre-monsoon season and the maximum value obtained for BOD is 320 ppm in the raw sewage of Ukkdam tank. After treatment the COD values of Ukkadam has been significantly (p=0.0012) reduced from 760 ppm to 47 ppm. Pearson’s correlation coefficient analysis was done to determine the level of association between the selected parameter which are dependent on each other. Significant positive correlation was observed between the following pairs: BOD/TDS (r = 0.853) and BOD/EC (r = 0.881). There is a negative correlation observed between the BOD and DO values (r = -0.761).
 |
|
Chemical characteristics of sewage samples
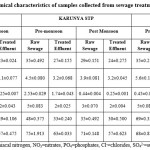
The values of TKN (mg/L), NH4-N (mg/L), NO3- (mg/L), PO4- (mg/L), Cl- (mg/L) and SO42- (mg/L) are presented in Table 2. Analysis of variance showed there is no significant difference in all of the above parameters among the three different sites. There is significant (p<0.05) difference found in levels of nitrates, phosphates and chlorides in different seasons. After treatment TKN, NH4-N, PO4-, Cl- and SO42- had significantly (p<0.05) reduced in all the three treatment plants.
 |
|
Heavy metals
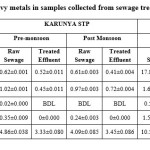
Sewage samples collected from three different sites were analyzed for the presence of total Cr, Ni, Cd, Pb and Fe were presented in Table 3. After treatment, all the five heavy metals were within the permissible limits described for public sewers by Central pollution Control Board (CPCB), 1986. Multiple comparisons among the three sites performed using one way ANOVA resulted that the distribution of cadmium in three different places differed significantly (p=0.2935). There is no significant (p<0.05) difference in the seasonal variations of all the five metals in the sewers while after treatment there is significant [cr (p=0.0071), Ni (p=0.0016), Cd (p=0.0272), Pb (p=0.0373), Fe (p=0.0012)] difference in all the five metals. EC had a significant positive correlation with all the heavy metals except cadmium.
 |
|
Bacteriological analysis
Comparison of the three sampling sites, indicated that the bacterial count varied significantly (p=0.0197) in each sampling points (Table 4). Tukey’s post hoc test showed that the Ukkadam collection tank had significantly differed from the other two points. There is no significant (p<0.05) variation in fungi and actinomycetes count. There is no significant (p<0.05) difference in the microbial count in pre-monsoon and post monsoon seasons.
 |
|
Discussion
Physico-chemical characteristics of samples collected from sewage treatment plants
In present study, the pH recorded in post monsoon ranges from 7.41 to 7.55 and in pre-monsoon , 7.62 to 7.96. These results are positively correlated with the analysis of sewage water where pH ranges from 8.0 to 9.4.8 This result shows that the pH in the pre-monsoon is more alkaline than the post monsoon because of discharges like soaps and detergents added to the sewage gets concentrated in the dry season. Khanna et al (2012)7 reported the alkaline pH (8.25 ±0.12 & 8.4±0.08) in summer season in river Yamuna. The mean pH values recorded for all the sampling points were within the CPCB public sewers limits5 of between 6.00 and 9.00 for wastewater to be discharged into the environment.
The electrical conductivity of water can be used to estimate total amount of solids dissolved in water. It gives an idea about the possible TDS of the sample. It depends on the temperature of water, i.e. if temperature is high, conductivity will be high. The maximum electrical conductivity seems to be 2.92 dSm-1.
Alkalinity indicates the amount of hydroxide (OH-), carbonate (CO32-) and bicarbonate (HCO3-) ions present in samples. TDS of raw sewage and treated effluent ranges from 1045 to 1554 mg/L and 720 to 857 mg/L respectively. Sewage containing high TDS should be properly treated before applying to the agricultural fields. Otherwise, it accumulates in the soil and spoils the soil health. The high amount of the total suspended solids is mainly due to the discharge of industrial effluents in to the sewage.13
The dissolved oxygen of the raw sample ranges from 0.1 to 1.93 in pre-monsoon and 0.3 to 2.01 in the post monsoon. After the treatment, the maximum DO attained is 4.8 mg/L in the raw sewage of Ukkadam STP in the post monsoon season. DO is generally temperature sensitive, with increase in temperature, less solubility of dissolved oxygen is observed. Increase in temperature accelerates the metabolic pathways and the way it leads to the increased oxygen consumption.14 According to Cunningham and Saigo, (1999),6 the addition of certain organic materials to water stimulates oxygen consumption by decomposers and thereby reduces the dissolved oxygen of water.
Decomposition of organic materials and wastes involves consumption of oxygen for their respiration.12 Biochemical Oxygen Demand (BOD) is defined as the amount of oxygen required by microorganisms for stabilizing biologically decomposable organic matter in a waste under aerobic conditions. Hence, BOD is mainly a bio-assay procedure, involving measurement of O2 consumed by bacteria while stabilizing organic matter under aerobic conditions.1 In pre-monsoon season, the BOD of sewage is 230 mg/L to 320 mg/L and the values are less in post monsoon than pre-monsoon because of less biological activity. The higher values of BOD are attained by the higher biological activity and the availability of much waste for degradation,15 which might be the result of untreated sewage, solid and industrial waste discharge.10 COD indicates the amount of oxygen required for oxidation of both organic and inorganic chemicals present in wastewater. COD values ranges from 600 to 760 mg/L in pre-monsoon and 532 to 779 mg/L in post monsoon in the raw sewage water. As like that of BOD, the COD of the sewage also recorded maximum values in pre-monsoon due to the presence of organics and inorganics in sewage water and its disintegration that consumes more oxygen than the biological degradation.
Ammonical-nitrogen ranged from 2.1 to 5.6 mg/L and nitrate-nitrogen ranged from 0.25 to 2.55 mg/l. Ammonia in sewage clearly indicates that the accumulation of faecal matter is more in sewage water. It is produced from different metabolic processes of plants, animals and human which is naturally higher than the nitrate-nitrogen. According to the CPCB, ammonical-nitrogen maximum limit is 50 mg/L. In contrast, Saha et al. (2012)17 reported that the ammoniacalâ€nitrogen ranged from 5.24â€61.94 mg/l and nitrateâ€nitrogen ranged from 2.55â€11.02 mg/l. This shows that the presence of organic nitrogen in the form of ammonical nitrogen is low in the wastewaters. The chlorides of sewage water in pre-monsoon ranges from 48 mg/L to 69 mg/L which is below the acceptable limit of 200 mg/L set by CPCB. The phosphorus in sewage ranges from 2 mg/L to 5 mg/L in both pre-monsoon and monsoon which also follows the public sewers limits of CPCB.
Heavy metals in sewage water
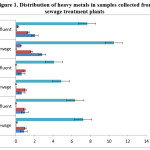
The raw sewage of Ukkadam samples contains higher concentrations of heavy metal like Cr, Cd, Pb, Ni and Fe compared to other STPs (Figure 2). This is because of mixing of the industrial runoff to the sewers. Ukkadam raw sewage has total Cr (2.83 ppm), Ni (1.66ppm), Cd (0.04ppm), Pb (0.53ppm), Fe (10.51ppm). The treated effluent contains heavy metals (Table. 5) which adhere to the prescribed limit set for public sewers by CPCB. From the figure 1 it is clearly known the Fe occurs more in the sewage. This is because of the industrial effluents, pharma industries which use iron as raw material for iron tablets and faecal matter. Next to iron, chromium possesses the second place which is originated from the chrome tanning industries, electroplating industries and varnishing chemicals.4 All the five heavy metals are more in Ukkadam sewage water than institutional wastewater.
 |
|
 |
|
Microbiological Characteristics
Bacteria in sewage remain viable for several weeks and microbial contamination will increase in the environment consequently.2 Bacterial count in raw sewage attains maximum (77x 106 CFU ml-1) in the pre-monsoon compared to post monsoon season (68 x 106CFU ml-1). This shows that increasing temperature aids in the multiplication of microorganisms.9 The same trend follows in fungi population (7x 10⁶ CFU ml-1 to 45x 106 CFU ml-1) and actinomycetes (5x 10⁶ CFU ml-1 to 62x 106 CFU ml-1).
Coliforms in sewage are the major indicator of fecal matter contamination. Coliforms ranges from 2400 MPN per 100 ml to 160 MPN per 100 ml in raw sewage in the pre-monsoon season. High number of coliforms is mostly contributed by the organic materials from the human sewerage i.e. municipality sewage plant has more number of coliforms (Figure 1) than the other sewage treatment plants. The high total coliform loads recorded is mostly attributed to organic deposits predominantly from human and animal sewerage as well as high suspended solid matter. Coliforms were observed to be more in number in both pre-monsoon and post monsoon seasons. The same results of the high number of total coliforms were observed in the Umian lake water in both pre monsoon and post monsoon.16
Conclusion
Wastewater characteristics play an important role in the designating of wastewater treatment facilities. The selection of wastewater treatment processes depends on waste-water composition, e.g. BOD, COD, pH, suspended solids, nitrogen, phosphorous, presence of toxic materials and bacterial population.11 In pre-monsoon, the undesirable characteristics of sewage water are higher than in the monsoon except the TSS. Treatment was highly beneficial in reducing the undesirable characteristics of sewage water and it requires some modifications based on the time period and the waste generation of the particular locality. The result says that the raw sewage from the Ukkadam municipality treatment plant receives more contaminants from both households as well as industries. The experimental data suggests a need to implement separate channels to collect industrial wastewater originates from various points that reach municipality treatment plant. This could make the better treatment options for the industry wastewater and more useful in proper management wastewater generates in the city. And also the household water that does not contain much toxicant could be effectively irrigated to the agricultural lands.
References
- Akuffo, SB. “Pollution Control in a Developing Country: A Case Study of the Situation in Ghana,” 2nd Edition.(Ghana Universities Press, Legon, 1998).
- Al-Bahry, S.N., Ibrahim Y. Mahmoud, S.K. Al-Musharafi, I. S. Al-Gharaibi, Nasra K. Al-Harthy, and Al-Zadjali.H.A. Microbial and chemical pollution of water-wells relative to sewage effluents in Oman. IAFOR Journal of Sustainability, Energy and the Environment, 1(1): 35-56 (2014).
- APHA, A. WPCF. Standard methods for the examination of water and wastewater, 16, 445-446 (APHA, 1985).
- Avudainayagam, S., M. Megharaj, G. Owens, Rai S. Kookana, D. Chittleborough, and R. Naidu. Chemistry of chromium in soils with emphasis on tannery waste sites. In: Reviews of environmental contamination and toxicology, 53-91. (Springer New York, 2003).
- CPCB (Central Pollution Control Board). General standards for discharge of environmental pollutants Part-A : Effluents (public sewers), The Environment (Protection) Rules, (1986).
- Cunningham, WP and Saigo, BW. “Environmental Science: A GlobalConcern,” 5th Edition, (McGraw-Hill Publishers, Boston, 1999).
- Khanna, DR, Bhutiani, R., Matta, G., Singh,V and Ishaq, F. Seasonal variation in physico-chemical characteristic status of River Yamuna in Doon Valley of Uttarakhand. Environment Conservation Journal, 13(1&2): 119-124 (2012).
- R. R., K. Dharmaraj and B.D. Ranjitha Kumari. A comparative study on the physicochemical and bacterial analysis of drinking, borewell and sewage water in the three different places of Sivakasi. Journal of Environmental Biology., 28(1): 105-108 (2007).
- Levantesi C., La Mantia R., Masciopinto C., Böckelmann U., Ayuso-Gabella M. N., M. Salgot, V. Tandoi, E. Van Houtte, T. Wintgens and E. Grohmann. Quantification of pathogenic microorganisms and microbial indicators in three wastewater reclamation and managed aquifer recharge facilities in Europe. Science of the Total Environment 408: 4923-4930 (2010).
CrossRef - Milovanovic, M. Water quality assessment and determination of pollution sources along the Axios/Vardar River, Southeastern Europe Desalination, 213: 159-173 (2007).
CrossRef - Mishra F K P and Mahanty N B. “Characterization of Sewage and Design of Sewage Treatment Plant”.(Department of Civil Engineering National Institute of Technology, Rourkela, 2012).
- Nartey, VK; Hayford, EK and Ametsi, SK. Assessment of the impact of solid waste dumpsites on some surface water systems in the Accra Metropolitan Area, Ghana. Journal of Water Resource and Protection 4:605-61 (2012).
CrossRef - Palanivel, M. and P. Rajaguru. The present status of the river Noyyal. (Workshop on environmental status of rivers in Tamil Nadu, Bharathiar University. Coimbatore press. pp.53-57, 1999).
- Pierce, Stephen D., John A. Barth, R. Kipp Shearman, and Anatoli Y. Erofeev. Declining Oxygen in the Northeast Pacific*. Journal of Physical Oceanography : 42: 495-501 (2012).
CrossRef - Pitchammal, V, Subramanian, G, Ramadevi, P and Ramanathan, R. The study of water quality at Madurai,Tamilnadu, India. Nature Environment and PollutionTechnology, 8(2): 355-358 (2009).
- Rajurkar, N.S., B. Nongbri and A.M. Patwardhan. Physicochemical and microbialanalysis of Umian (Brapani) lake water. Indian Journal of Environmental Protection., 23(6): 633-639 (2003).
- Saha M.L, Ashraful Alam, Mahbubar Rahman Khan and Sirajul Hoque. Bacteriological, physical and chemical properties of the pagla sewage treatment plant’s water.Dhaka University Journal of Biological Sciences. 21(1): 1-8 (2012).
CrossRef - Sonune N A, Mungal N A and Kamble S P: “Study of Physico-Chemical Characteristics of Domestic Wastewater in Vishnupuri, Nanded, India”.International Journal of Current Microbiology and Applied Sciences., 4(1): 533-536, (2015).
- Technical Notes on Drinking-Water, Sanitation and Hygiene in Emergencies. (2013).
- http://www.who.int/mediacentre/factsheets/fs391/en/


