Estimation of the Pre-Consolidation Pressure in Soils Using ANN Method
M. R. Motahari1 *
1
Department of Civil Engineering,
Faculty of Engineering,
Arak University,
Arak,
Iran
http://dx.doi.org/10.12944/CWE.11.Special-Issue1.10
Calculation of the pre-consolidation pressure is related to strength and deformation parameters for over consolidated soils and reflects the stress path and deformation features of soils. Therefore, accurate and convenient calculation of the pre-consolidation pressure is of great importance in traditional soil mechanics. In the current paper, by using the MATLAB toolbox, a BP neural network based method is applied to calculate and model pre-consolidation pressure. Finally, the accuracy and effectiveness of the proposed method is compared to the common analytical method.
Copy the following to cite this article:
Motahari M. R. Estimation of the Pre-Consolidation Pressure in Soils Using ANN Method. Special Issue of Curr World Environ 2016;11(Special Issue 2(2016). DOI:http://dx.doi.org/10.12944/CWE.11.Special-Issue1.10
Copy the following to cite this URL:
Motahari M. R. Estimation of the Pre-Consolidation Pressure in Soils Using ANN Method. Special Issue of Curr World Environ 2016;11(Special Issue 1(2016). Available from: http://www.cwejournal.org/?p=14844
Download article (pdf) Citation Manager Publish History
Introduction
The maximum historical effective stress of soil is referred to pre-consolidation pressure and determines the changes of stress during the formation of soil.1 Due to the difference of geological effect and the stress changes, the process of consolidation may differ during the formation and current process. According to the definition of pre-consolidation pressure, when the external load is lower than the pre-consolidation pressure, the natural soil only has a tiny deformation; otherwise, the soil structure is destroyed; when a considerable external load is exerted. Therefore, correct evaluation of the pre-consolidation pressure is vital for estimating deformation values during its operational periods. Casa Grande method,2 also known as experience based-graphing or C method, is generally adopted to get the pre-consolidation stress. Due to the difficulty in improving the accuracy of determining the maximum curvature point, the calculation of the pre-consolidation pressure is affected, obtained according to change features of the function curve. In this research, to lower the error in getting the maximum curvature point a nonlinear neural network prediction model based on a successive approximation of multi-node is adopted for providing a new method of getting more accurate pre-consolidation stress.
Neural Network Method
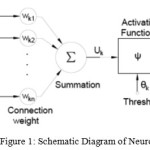
Artificial neural network, proposed and developed based on modern neuroscience, is a kind of abstract mathematical model that simulates the functions of the human brain. With the functions of self-adjustment and organization, it completes specific tasks through the supervised "learning"; with the most significant advantage of the ability in self-learning, it can also achieve satisfactory results even when some deviations exist among the learning data. The net can be divided into two types according to the structure and work mode: feed-forward network and feedback network. In this paper, BP network, i.e. feed-forward reverse transmission network is introduced. The artificial neural network can auto-organize and adjust the weights of each node, and describe extremely complicated nonlinear problems, fully consider various factors and make comprehensive processing; therefore, BP network can be regarded as a highly nonlinear mapping from input to output.3, 4 Artificial basic neurons are shown in Figure 1:
 |
|
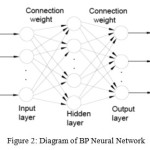
Nerve cells are organized and BP neural network is formed as follows:
 |
|
Through training the network model, the error between the calculated output value yk and desired output value yk is minimized, and the minimum sum of squared errors is taken as the evaluation index 5:
Initial value of the given weight can be corrected with the recursive method, thereby 6

Where m denotes the mth recursive calculation, λ specifies the artificially specified rate constant, intermediate variables emK, emj can be calculated through iteration.
BP Neural Network Build
In this paper, artificial neural network is used to directly analyze the trend and rule of e-p curve, which reduces the information loss in the process of analysis.
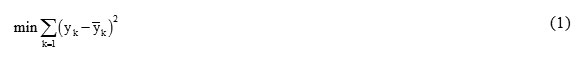
Determination of the input and output items; Soil mass under different stress correspond to different pore ratio, with the increase of consolidation pressure p, change of void ratio e decreases similar to negative exponent, and the slower the e-p curve becomes, as shown in Figure 3.
 |
|
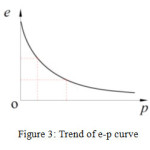
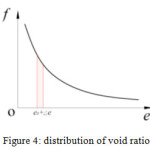
If e is regarded as the abscissa, distribution density of the curve inordinate of the p-e curve as the ordinate, void ratio frequency distribution curve is as shown in Figure 4.
 |
|
The void ratio e under different densities of distribution is recognized with weight values of the neural network model, the ability of recognition is improved constantly through objective supervision training, and the void ratio e with target characteristics are finally back feed. Therefore, the void ratio under different stress is taken as the input item, and the void ratio obtained in experiment and corresponding to the pre-consolidation stress as the target output item. Finally, the corresponding pre-consolidation stress pc is obtained based on void ratio through linear interpolation.
Determination of the number of hidden layers Reasonable selection of the number and the number of element of hidden layers is one of the difficult points in the model design. Very little hidden layer nodes may result in poor network generalization, while too many nodes require more time, and do not necessarily correspond to the best training error. Generally, empirical formula or trial is adopted in determination, and empirical formula for the number of hidden layer l is as follows:
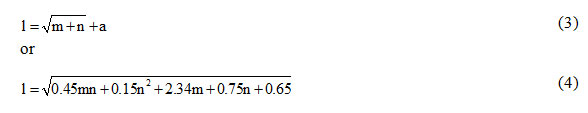
where n, m are the number of output and the number of input nodes; respectively. a is a constant between 1 to 10.6
Prediction Example
Creation of BP model of two or more hidden layers is relatively complex. In this paper, single hidden layer model is adopted, and according to the empirical formula, l=9.4; therefore, there may be four nodes in the hidden layer. Through repeated trials, better results were obtained when four nodes were adopted; void ratio under different stress was taken as the input item and void ratio under pre-consolidation stress as the output item. void ratio under different stress in the experiment is taken as the input item, and that corresponds to pre-consolidation stress as the target output item, and programming and calculation is completed in MATLAB platform. Data of the learning group is as shown in Table 1. The corresponding void ratio under pre-consolidation stress is obtained through linear interpolation.
Table 1: Test and prediction data
|
Training Stress |
Void ratio |
|||||
|
A |
B |
C |
D |
E |
Prediction |
|
|
25 |
0.866868 |
0.748235 |
0.627122 |
0.68425 |
1.079859 |
0.639376 |
|
50 |
0.818799 |
0.711804 |
0.610025 |
0.655826 |
1.020567 |
0.609333 |
|
100 |
0.761644 |
0.689333 |
0.56354 |
0.607741 |
0.951708 |
0.575541 |
|
200 |
0.700639 |
0.647078 |
0.534374 |
0.583975 |
0.896881 |
0.555458 |
|
400 |
0.646155 |
0.605661 |
0.512269 |
0.552129 |
0.831983 |
0.535167 |
|
800 |
0.595117 |
0.582419 |
0.470212 |
0.526175 |
0.751485 |
0.513071 |
|
1600 |
0.535896 |
0.548777 |
0.437553 |
0.491738 |
0.691643 |
0.499455 |
|
3200 |
0.477403 |
0.502708 |
0.410004 |
0.448917 |
0.633877 |
0.457806 |
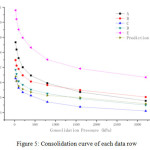
Compression curve of different soil samples of the learning group is as shown in Figure 5.
 |
|
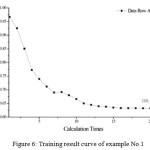
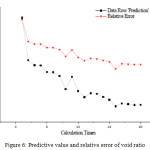
The neural network model is trained, taking A-E of the learning group as the input vector and the corresponding measured pre-consolidation pressure as the target value, and the training is ended until the error is less than 0.0001. Figure 6 shows the curve of feedback void ratio changing with the number of times of training of Group A imported in learning, it can be seen that with the feed-forward of error, and by changing the weights of each connection, the output result quickly closes up to the target, showing that the network construction is effective.
 |
|
The neural network model trained was adopted, output of the prediction group was calculated at a given input vector, and 20 times of iterative calculation was conducted: void ratio of the prediction group is 0.5418, with an error of less than 0.04% compared with the measured curve value; and pre-consolidation stress is 334.02kPa based on inverse calculation, its precision has matched or even exceeded the precision required in laboratory test (accuracy of 0.01mm for the dial indicator, the natural void ratio is assumed to be 0.5 and height of soil sample 13.3mm, i.e. the void ratio e can only reach 0.00075, lower than 0.0001 obtained in this experiment). Table 2 shows the calculated void ratio and its percentage error.
Table 2: Void ratio and error after the 20 times calculation
|
Cal Times |
1 |
2 |
3 |
4 |
5 |
6 |
7 |
8 |
9 |
10 |
|
Cal Value |
0.7540 |
0.6500 |
0.6380 |
0.6377 |
0.6214 |
0.6210 |
0.6120 |
0.5800 |
0.6100 |
0.5750 |
|
Error(%) |
39.114 |
19.926 |
17.712 |
17.656 |
14.649 |
14.575 |
12.915 |
7.0111 |
12.546 |
6.0886 |
|
Cal Times |
11 |
12 |
13 |
14 |
15 |
16 |
17 |
18 |
19 |
20 |
|
Cal Value |
0.5600 |
0.5700 |
0.5680 |
0.5610 |
0.5540 |
0.5210 |
0.5450 |
0.5430 |
0.5410 |
0.5418 |
|
Error(%) |
3.3210 |
5.1661 |
4.7970 |
3.5055 |
2.2140 |
-3.874 |
0.5535 |
0.1845 |
-0.1845 |
-0.0369 |
 |
|
As the mathematical model that integrates data training, optimization, learning, and feedback prediction is adopted, BP neural network model shows great advantages in data utilization: it makes full use of various kinds of experimental data in history, and takes the data as data sources of the learning group to improve the ability of data prediction; and when there are much data, the original data can be classified according to properties of soil into different levels of consolidation stress, corresponding set of data of prediction group can be adopted for pre-consolidation stress in different range, so that pre-consolidation stress can be predicted accurately, quickly and easily, and directly applied to engineering practice.
Table 3: Neural network method compared with other methods
|
Method |
Error(ï¼…) |
|
Casa Grande Method |
9.658 |
|
ANN |
0.032 |
Conclusion
In this paper, a method based on BP artificial neural network model is proposed to calculate the pre-consolidation pressure of soil. the developed neural network with three layers and four hidden nodes is established. The network is trained with the existing similar test data, and calculation and projection are made against the prediction group. According to the results of training, the model quickly approaches to the target value, reaches a percentage error of less than 0.04 for the prediction group, proving that the artificial BP neural network model can accurately predict the void ratio corresponding to the pre-consolidation stress, requires no drawing and less manual intervention, but achieves faster speed of calculation compared with the commonly used Casa Grande method, and has certain value for practical application.
References
- Celik, S. and O. Tan, Determination of pre consolidation pressure with artificial neural network. 2005. 22(4): p. 217-231.
- Casagrande A, The Determination of the Pre consolidation Load and Its Practical Significance, Proc. of First ICMFE, 1936(3):60-64.
- JIANG An-long,ZHAO Chun-feng, GAO Da-zhao. Mathematical model method of determining pre consolidation pressure, Rock and Soil Mechanics, 2003, 24(2): 292-295.
- Kim, Y.S. and H.I. Park, Committee neural network for estimating pre consolidation pressure from piezocone test result. 2012. 29(8): p. 842-855.
- Kreyszig E, Advanced engineering mathematics, John Wiley & Sons, 2007.
- Zhang, C., Q. Yang and M. Luan, Evolutionary neural network model for suction prediction of unsaturated soils. 2004. 25(1): p. 73-76.


