Quantification of Coarse Aggregate Angularity by a Newly Developed Auto Grader Machine.
Zahra Rahimi 1 and Ratnasamy Muniandy 1
http://dx.doi.org/10.12944/CWE.11.Special-Issue1.07
The physical properties of aggregates have a direct correlation to the performance of a pavement. Stiffness, fatigue response, shear resistance and permanent deformation are some of the distresses for which aggregate form, texture and angularity have an influence. Angularity is an important property of aggregate shape, more angular are the particles there will be better interlocking, inter friction and greater mechanical stability, hence better pavement distress resistance. A debate has a risen over several methods to capture this physical property either directly or indirectly such as aggregate imaging system (AIMS), Un compacted void content of coarse aggregate (AASHTO T326), University of Illinois Aggregate Image Analyzer (UIAIA) and Indian manual coarse aggregate angularity test. Some are costly some are laborious and time consuming; hence there is a need for better methods that are cost effective, accurate, rapid in measuring aggregate angularity. The research conducted in this study introduces cost effective Aggregate Auto-grader and evaluates the effective set of time and speed for this automated machine to obtain minimum percentage air voids between aggregates (estimation of perfect interlocking) by shaking sample of coarse aggregates in orbital motion. In addition to measure accuracy of automate Aggregate Auto-grader test results are compared to other manual coarse aggregate angularity test. The trend followed by results of aggregate Auto-grader is as same as the manual test, hence based on results a new equation is proposed for obtaining coarse aggregate angularity by Aggregate Auto-grade machine which has more accuracy, reputability and reproducibility compare to the manual test.
Copy the following to cite this article:
Rahimi Z, Muniandy R. Quantification of Coarse Aggregate Angularity by A Newly Developed Auto Grader Machine. Special Issue of Curr World Environ 2016;11(Special Issue 2(2016). DOI:http://dx.doi.org/10.12944/CWE.11.Special-Issue1.07
Copy the following to cite this URL:
Rahimi Z, Muniandy R. Quantification of Coarse Aggregate Angularity by A Newly Developed Auto Grader Machine. Special Issue of Curr World Environ 2016;11(Special Issue 2(2016). Available from: http://www.cwejournal.org/?p=14396
Download article (pdf)
Citation Manager
Publish History
Introduction
There is a consensus among researchers that the aggregate shape properties affect performance, but a debate has arisen over the ability of the tests to quantify the related shape properties. In compacted mixtures, angular-shaped particles exhibit greater interlock and internal friction, and, hence, result in greater mechanical stability than do rounded particles (Little, Button et al, 2003). Thus, angular and rough-textured aggregates are crucial to develop interlocking among aggregates in SMA, and accordingly, they are desirable to obtain SMA mixtures that resist permanent deformation and fatigue cracking. On the other hand, the presence of flat and elongated aggregate particles is undesirable in mixtures. Such particles tend to break down during construction affecting durability pavement(Teng 2001).
Coarse aggregate skeletons that have stone-on-stone contact provide greater interlock of aggregate particles to more effectively distribute the typical loads and stresses that develop within the pavement structure. The concept to define when stone-on-stone contact existed that was recommended from the NCHRP 9-8 research was the use of voids in coarse aggregate, VCA (Watson, Masad et al, 2004)
 |
|
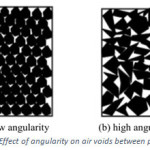
It is well established that air voids play an important role in determining the resistance of asphalt mixtures to major pavement distresses including rutting, fatigue cracking, and low- temperature cracking. They also influence the durability of asphalt mixes in terms of aging and stripping. For example, low air void contents minimize the aging of the asphalt binder films within the aggregate mass and the possibility of water penetrating into the mix and stripping the asphalt binder off the aggregates (Masad et al. 2002) As it can be seen in Fig.1, specimens with the same total volume of air voids may have different distributions of air voids, and consequently exhibit distinct mechanical properties. Thus, it would be of considerable interest to capture the air void distribution (Masad et al. 2002).
Stone mastic asphalt (SMA) includes standardized test methods such as Percent Fractured Faces-ASTM D5821, uncompacted Void Content of Coarse Aggregate (UCVCC), Aggregate Image System (AIMS), and University of Illinois Aggregate Imaging System (UIAIS) that measure aggregate angularity of coarse aggregates (Ofori-abebresse and Martin 2006). Wedding and Gaynor evaluated that coarse aggregate angularity (CAA) has significant effect on rutting characteristics of flexible pavement. (Anirudh, Mallesh, and Anjum 2014) showed that the use of crushed gravel increased the stability of the asphalt mixture when compared with asphalt mixtures containing uncrushed gravel (Kim, Ph, & Souza, 1975). More angular are the coarse aggregates can increase the stone on stone interlocking and consequently reduce the rut-susceptibility and result in lower rut depth(Pavement Mechanics and Performance 2006).
A comparison between coarse aggregate angularity tests based on indirect and direct methods is presented in Table.1
Table 1: Classification of coarse aggregate angularity tests
|
Test |
Price |
Direct Indirect |
Advantages |
Disadvantages |
|
Un compacted void content of coarse aggregate (AASHTO T326) UCVCC |
$500-700 |
Indirect |
â— Simple â— Inexpensive â— Roughly estimate of sphericity and surface texture â— Its preferred over ASTM 5821 |
â— The test method cannot distinguish between the angularity of aggregates with 100% two or more fractured faces â— The results are influenced by shape, angularity, texture, and bulk specific gravity.[1] â— Effect of shape, angularity and texture cannot be separated |
|
Percent fracture face (ASTMD5821) %FF |
- |
Direct[2] |
â— Simple â— Inexpensive
|
â— Labor intensive â— Depends on operators judgment |
|
Camsizer CAMCONV |
$40,000-50,000 |
Direct |
Using 2 cameras improve accuracy of measuring shape of large aggregate quantity |
· Very expensive · Assumes idealized particle shape[3] |
|
WipShape WSMACR |
$30,000-40,0000 |
Direct |
It can analyze 3-dimensions of large quantities of particles in a short time[4] |
â— Very expensive â— Uses same camera magnification to capture images of all sizes[5]. |
|
University of Illinois Aggregate Imaging System UIAIA |
$30,000-40,0000 |
Direct |
Using 3 cameras Measuring 3-D shape of large aggregate quantity Flat, elongated, angularity and grading |
â— Very expensive â— Uses same camera magnification to capture images of all sizes. |
|
Aggregate Imaging System AIMS |
$30,000-40,0000 |
Direct |
â— Uses one video camera to measures shape of large aggregate quantity â— Measures shape of large aggregate quantity â— Detailed analysis of texture |
â— Very expensive â— Influenced by the orientation at which the gravel may have been placed on the test tray[6]. |
|
Manual angularity number test IS:2386-Part1-1963 CAA |
- |
Indirect |
Simple Inexpensive
|
â— Labor intensive â— Time consuming â— Depends on operators judgment â— Low precision
|
1. (Kim, Ph, and Souza 1975)
2. Kim et al., 1975
3. (Rousan 2004)
4. Kim et al., 1975
5. Masad et al. 2007
6. (Cottrill, Thomas, and Vaughn 1832)
There are several methods of determining angularity of particles such as digital image analysis system AIMS, UIAIA, WipShape and Camsizer, which all require skill, machine, and software and most importantly, they are not economical since cost might be an obstacle for practical implementation. However, AASHTO T326 is cost effective compare to other direct tests. Hence in many developing countries the Indian manual coarse aggregate angularity (CAA) test is performed to determine angularity numbers which is very cost effective(IS:2386 (part-1) 1963 1963).
Indian manual Coarse aggregate angularity (CAA) test is done manually by compacting different layers of coarse aggregates in specified manner with the help of tamping rod in container. Aggregates are placed in three equal layers, each are compacted with 100 number of blows by freefall rod in distance of 5 cm above the surface layer. Percentage air void between coarse aggregate is volumetric ratio of required water to fill the voids to total volume of the cylinder (IS:2386 (part-1) 1963, 1963). One way to determine angularity according to this test is based on weight of aggregates require filling the cylinder, the other one is based on volumetric properties of aggregate.
Angularity Number = (Volume of water added/Total volume) x 100-33
Where, “33” is the percentage of volume of voids, in a perfectly rounded aggregate. The value of angularity number generally lies between 0 & 11. In road construction, angularity number of 7 – 10 is generally preferred, (IS:2386 (part-1) 1963, 1963).
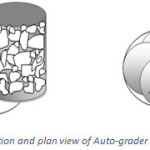
This test is tiresome, time consuming, depends on operator’s judgment, low reproducibility, and if it has to be repeated for number of times there are possibility of making errors. In order to replace traditional tests, an automated method for coarse aggregate angularity is presented. An orbital shaker was designed which is called Auto-grader. The main goal of this machine is to obtain minimum percentage air voids between aggregate (estimation of perfect interlocking) by shaking sample of aggregates in orbital motion instead of compacting them by freefall rod in traditional CAA manual test. Fig.2 depicts this concept that how orbital motion could help aggregate interlocking.
 |
|
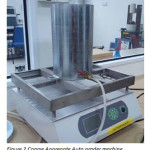
Coarse Aggregate Auto-grader
Fig. 3 shows the benchmark machine, it works in two functions of time (minutes) and speed (Revolution per Minutes). Time can be set from zero to 99 minutes and rotation speed varies from 50 to 250 RPM to shake coarse aggregates in uniform circular motion for better interlocking and decreasing air voids between them. It is important to choose the most appropriate process parameters to achieve minimum percentage air void between coarse aggregates. Hence, this research was done to investigate the role of time and speed variation of Auto-grader to find out most effective set of time and speed. Results are compared and scaled according to CAA manual test to get the same results with higher repeatability and reproducibility.
 |
|
Since aggregates of different gradation are tested in this study by using of “ trial and error” method, weight of coarse aggregate which can be filled into cylinder for all gradations is estimated approximately 6.6-6.8 kg. The required weight (kg) of each gradation is shown in the Table 1
 |
|
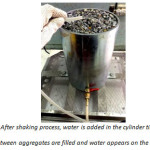
After rotation of coarse aggregates by Auto-grader for the given set of time and speed, water needs to be added into auto grader cylinder to measure the air void. Since the same sample was used for each gradation in this research, aggregates had to be prepared in surface saturated dry a condition in which inter particles void are saturated and added water fills the gap between aggregates only. Percentage air void between shacked coarse aggregates is determine by measuring volume of added water.
Table 2: Percentage weight of aggregate from different sieve size required for SMA20
|
Sieve size |
Lower Limit |
Mean Limit |
Upper Limit |
||||||
|
Passing% |
Retain % |
Wt Retain (kg) |
Passing % |
Retain % |
Wt Retain (kg) |
Passing % |
Retain % |
Wt Retain (kg) |
|
|
19 |
100 |
0 |
0 |
100 |
0 |
0 |
100 |
0 |
0 |
|
12.5 |
81.25 |
18.75 |
1.275 |
87.155 |
12.845 |
0.873 |
93.06 |
6.94 |
0.425 |
|
9.5 |
56.25 |
25 |
1.7 |
67.705 |
19.45 |
1.3175 |
79.16 |
13.9 |
0.945 |
|
4.75 |
0 |
56.25 |
3.825 |
0 |
67.705 |
4.6039 |
0 |
79.16 |
5.383 |
Results and Discussion
In this study, granite has been selected for three gradations of upper limit, mean limit and lower limits of SMA. Since Auto-grader is designed for coarse aggregate, aggregate size larger than sieve No. 4 has been considered only. Each gradation was performed under three variation of time; three, five and seven minutes since percentage air void remains steady after 7 minutes and three rotation speed; 200, 225 and 250 RPM for orbital shaker. Since only volume of air voids between aggregates is required not inter particle voids, all aggregate samples were prepared in Surface Saturated Dry (SSD) condition for both tests.
Results of manual coarse aggregate angularity test are presented in Table 2 where cylinder weight is 3.33 kg and volume of cylinder is 1800 ml.
Based on the result of manual coarse aggregate angularity (CAA) test which was perform to control the result of percentage air void obtained by Aggregate Auto-Grader, lower limit with 38.88% air void has the highest value while lowest value of percentage air void belongs to upper limit since it has more percentage of smaller particles, same results with the angularity. The main finding behind these results is that the gap between smaller particles is low and between larger particle size is more comparatively so by increasing weight or percentage of larger particles, percentage air voids between them increases and vice versa.
Table 3: Shows the result of manual coarse aggregate angularity test
|
Gradation |
Lower Limit |
Mean Limit |
Upper Limit |
||||||
|
Readings |
1 |
2 |
3 |
1 |
2 |
3 |
1 |
2 |
3 |
|
Volume of water added (ml) |
700 |
720 |
680 |
680 |
690 |
700 |
690 |
670 |
680 |
|
Average (ml) |
700 |
690 |
680 |
||||||
|
Air void (%) |
38.88 |
38.33 |
37.7 |
||||||
|
Angularity number (%air void-33) |
5.88 |
5.33 |
4.7 |
||||||
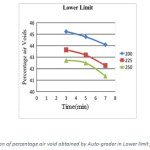
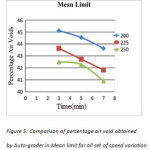
Different graphs are plotted for each gradation (lower, Mean and upper limit) from result of Aggregate Auto-grader which compare percentage air void obtained by different set of speed (Fig5, 6 and 7). By comparing the plotted lines for 200, 225 and 250 RPM, it is found that the percentage air void trend for all gradations is same and its decreasing by increasing speed power. The reason behind this finding is that by increasing rotation speed the gap between angular aggregates decreases hence aggregates interlocking increases and percentage air void decreases.
 |
|
 |
|
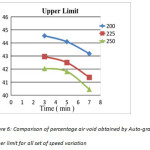 |
Figure 6: Comparison of percentage air void obtained by Auto-grader in Upper limit for all set of speed variation Click here to View figure |
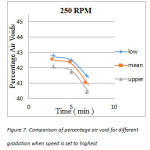
Since the percentage air void decreases with increase in speed for all gradation, a comparison between percentage air void of different gradations is done when the speed is set as highest (250RPM). As it can be seen (Fig.8) the trend was theoretically expected, when percentage of larger aggregate size in lower limit increases compare to upper limit, the space between them also increases comparatively, hence the percentage air void between them would increase and vice versa.
 |
|
Comparison of percentage air void between CAA Manual test and Aggregate Auto-grader results for all gradations
In this study, Auto grader was set for three variables of times three, five and 7 minute and three rotational speeds of 200, 225 and 250 RPM for each gradation. It is found that the best way to improve aggregate interlocking and gain minimum percentage air void is by increasing time and speed power, however percentage air void remains constant after certain amount of time. Hence, it is recommended to use Auto-grader for maximum set of time and speed. To work effectively with Aggregate Auto-grader the best set investigated for speed and time was 250RPM and 7 minutes respectively.
Table 2A: shows Result of percentage air void obtained by coarse aggregate angularity manual and Auto-grader automated test
|
% Air Voids |
Gradation |
||
|
Lower |
Mean |
Upper |
|
|
Auto-grader (250 RPM, 7min) |
41.3636 |
40.909 |
40.4545 |
|
CAA manual test |
38.88 |
38.33 |
37.7 |
|
Differences |
2.4836 |
2.579 |
2.7545 |
Results of percentage air void obtained from both tests are shown in table 3. The trend followed by both tests is same; percentage air void between aggregates is highest for lower limit then decreases at mean limit and its minimum at upper limit Fig.9.
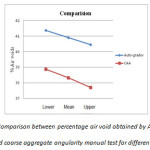 |
Figure 8: Comparison between percentage air void obtained by Auto-gradermachine and coarse aggregate angularity manual test for different gradations. Click here to View figure |
Overall, there is approximately 2.5 percent gap between results of two tests. The results of percentage air void between aggregate obtained from Auto grader is relatively higher than coarse aggregate angularity (CAA) manual test which was performed to control the results of this new developed machine. Therefore, a correlation between percentage air voids obtained from Coarse Aggregate Auto-grader and CAA manual test was established.
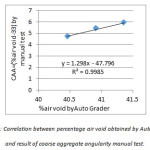 |
Figure 9: Correlation between percentage air void obtainedby Auto grader and result of coarse aggregate angularity manual test. Click here to View figure |
CAA Auto-grader = 1.23 x (%air void) – 47.8
Where,
CAA= coarse aggregate angularity number between between 0 and 11
Fig.9 illustrates coarse aggregate angularity equation for Aggregate Auto-grader with a high linear regression (almost 1). Hence, same results for coarse aggregate angularity can be obtained from Auto-grader test but with high accuracy, reproducibility and repeatability.
Moreover, since the trend followed by these two test is linear and their difference is approximately 2.5 percent, a simpler equation could also be used according to Fig.8 with a bit lower accuracy comparatively.
CAA Auto-grader = (%air void+2.5%) – 33 = %air void-30.5
Conclusion
The main focus of this study was to identify percentage air voids trends of Auto-grader by quantifying different variation of time and rotational speed to conduct the most effective and efficient set to obtain minimum percentage air void between coarse aggregate.
As analysis on percentage air void is shown increasing operation set of speed and time of Coarse Aggregate Auto-grader has significant effect on perfect aggregate interlocking and reduction of percentage air void between them. Hence, speed and time of operation is recommended to be set for 250RPM and 7 minutes.
In this study, results were compared with percentage air void of Indian coarse aggregate angularity (CAA) standard manual test as controller. Since percentage air void obtain by aggregate Auto-grader follows the same trend as manual test, this newly developed machine can be used to achieve coarse aggregate angularity number with higher accuracy, reproducibility and repeatability compare to CAA manual test.
Recommendation
Since Aggregate Auto-grader obtains angularity from indirect measurement of percentage air voids between granular particles, it can be used for determination of the particle index for future work (Size and Soils 2011). In D3398 manual test for index of aggregate particle shape and index, particle index is obtained according to following equation(Aggregate et al. 2000).
Ia = 1.25V10 – 0.25 V50 – 32.0
Where:
V10 = % air voids in aggregate compacted at 10 drops per layer,
V50 = % air voids in aggregate compacted at 50 drops per layer,
Auto-grader could also be used based on particle index equation by obtaining V10 and V50 with a proper operation set of speed and time. Same results can be obtained with higher accuracy, reproducibility and repeatability which are fundamental principle for a reliable test.
References
- Aggregate, Coarse, Fine Aggregate, Testing Size, and Compacted Soils. 2000. “Standard Test Method for Index of Aggregate Particle Shape and Texture 1 D 75 Practice for Sampling Aggregates 3 Compacted Soils 4.” 04.
- Anirudh, N, K M Mallesh, and Mohammed Ilyas Anjum. 2014. “‘ Influence of Particle Index of Coarse Aggregate and Its Influences on Properties of Asphalt Concrete Mixtures .’” : 304–12.
- “Copyright ASCE 2006 102 Pavement Mechanics and Performance (GSP 154) Pavement Mechanics and Performance.” 2006. (Gsp 154): 102–9.
- Cottrill, Caitlin, Natacha Thomas, and Stephen Vaughn. 1832. “Annual Meeting of the Transportation Research Board; January 2010, Washington D.C.” 5(11): 1–16.
- IS:2386 (part-1) 1963. 1963. “Method of Test for Aggregate for Concrete.”
- Kim, Yong-rak, D Ph, and Leonardo T Souza. 1975. 0851 Effects of Aggregate Angularity on Mix Design Characteristics and Pavement Performance.
- Little, Dallas et al. 2003. “Quantify Shape, Angularity and Surface Texture of Aggregates Using Image Analysis and Study Their Effect on Performance.” http://www.ntis.gov.
- Masad, E. et al. 2002. “Characterization of Air Void Distribution in Asphalt Mixes Using X-Ray Computed Tomography.” Journal of Materials in Civil Engineering 14(2): 122–29.
- Ofori-abebresse, Edward, and Amy Epps Martin. 2006. “MnROAD AGGREGATE PHYSICAL PROPERTIES MEASURED WITH THE AGGREGATE IMAGING SYSTEM ( AIMS ) by.” (March).
- Rousan, Tm Al. 2004. “Characterization of Aggregate Shape Properties Using a Computer Automated System.” (December): 211.
- Size, Testing, and Laboratory-compacted Soils. 2011. “Standard Test Method for Index of Aggregate Particle Shape and Texture 1.” 00(Reapproved 2006): 3–6.
- Teng, T. Paul. 2001. “Superpave Mixture Design Guide.” Westrack Forensic Consensus Report: 23.
- Watson, Donald et al. 2004. “Verification of Voids in Coarse Aggregate Testing: Determining Stone-on-Stone Contact of Hot-Mix Asphalt Mixtures.” Transportation Research Record 1891(1): 182–90.


