An Integrated Approach of Remote Sensing and Gis for Land Use and Land Cover Change Detection: A Case Study of Banjar River Watershed Of Madhya Pradesh, India
Jagriti Tiwari 1 , S.K. Sharma 1 and R.J. Patil 2 *
http://dx.doi.org/10.12944/CWE.12.1.18
Land use and land cover of a region is one of the prime concerns in current strategies for the evaluationof the watersheds and development of decision making policies. An uncertain increase in the population of the country along with the increasing demands has imposed an immense pressure on the land threatening the sustainability of the natural resources especially in the developing countries like India. The study was carried out to detect the land use and land cover changes observed in the Banjar River watershed lies in between Balaghat and Mandla districts of Madhya Pradesh, India using the multi spectral satellite dataset for two different years i.e. 2009 & 2013. The supervised classification was done in ERDAS IMAGINE software. The images of the study area was classified into seven classes namely, river, water body, waste land, habitation, forest, agriculture/other vegetation, open land/fallow land/barren land. The result indicates that during the last five years, forest, water body, waste land and open land/fallow land/barren has been increased by 2.26%, 0.55%, 0.23% and 0.48% respectively and the river, habitation and agriculture/other vegetation has been decreased by 0.26%, 0.04%, and 3.22% respectively. Accuracy assessment was also performed in this study to determine the quality of land use/cover map and overall accuracy was found 89.70% for 2009 and 91.91% for 2013.Present study emphasizes on digital change detection techniques for recognizing temporal changes in land use/land cover of the watershed. Outcomes of this study indicate need of implementing conservation and management practices for the socioeconomic development.
Copy the following to cite this article:
Tiwari J, Sharma S. K, R. J. An Integrated Approach of Remote Sensing and Gis for Land Use and Land Cover Change Detection: A Case Study of Banjar River Watershed Of Madhya Pradesh, India. Curr World Environ 2017;12(1). DOI:http://dx.doi.org/10.12944/CWE.12.1.18
Copy the following to cite this URL:
Tiwari J, Sharma S. K, R. J. An Integrated Approach of Remote Sensing and Gis for Land Use and Land Cover Change Detection: A Case Study of Banjar River Watershed Of Madhya Pradesh, India. Curr World Environ 2017;12(1). Available from: http://cwejournal.org?p=1003/
Download article (pdf) Citation Manager Publish History
Introduction
Management of natural resources and monitoring of environmental changes is one of the major factors essential for the formulation and implementation of proper land use plans for the development of any country. Land use and Land cover (LULC) change detection is an effective strategy which can be adopted for proper land use planning to determine the interactive effects of heterogeneity and disturbances occurring on the earth surface. Land cover can be defined as the observed (bio) physical cover on earth’s land as vegetation, open water or manmade features. While land use refers to the total of arrangements, activities and inputs that people undertake in certain land cover type.1,2 Human activities and different natural processes affect the land use/land cover of any area. The rapid alteration of land use and land cover than ever before particularly in developing countries often characterized by deforestation, land degradation and transformation of agricultural land ensuing enormous cost to the environment.3 Over utilization of natural resources for meeting growing demand for food, fuel and fodder of increasing population leads to LULC changes within the watersheds.4 Therefore, in order to protect and conserve the natural resources from further deterioration, a small piece of land should also be utilized judiciously. Efficient utilization of earth resources requires proper management and land use planning.Understanding of landscape changes is essential for sustainable management of natural resources as it allows decision makers to take a broader view of the watershed.5 Automatic or supervised classification and change detection methods build on software-based extrapolation of calibrated patches can provide satisfactory results when applied to land use types of homogeneous color and texture, e.g. water bodies, built-up land, or desert.6,7 The purpose of image classification is to label the pixels in the image with the real information.8 Change detection serves a better way for comprehensive classification of more diverse land use and land cover to understand the complexity of nature. Since, LULC assessment requires the analysis and accurate spatial surveys of landscape dynamics. In most of the developing countries like India, there is lack in availability of detailed and reliable spatio-temporal data although satellite images e.g. LANDSAT are accessible.
Most of the LULC mapping studies rely on single image per analysis period which results in reduced accuracy in regions with heterogeneity and mosaic nature land cover types. Therefore multi spectro-temporal satellite dataset are utilized in an efficient way with the help of remote sensing and GIS to analyze the historical effects of an occurrence and to determine the changes associated with LULC. Landsat TM and ETM+ data images available free of cost at global land cover facility (GLCF) and Earth explorer (USGS) for scientific users, provide the valuable information regarding thematic change of landscape. At minimum cost and with greater accuracy, changes in land use /land cover can be observed by using satellite imageries.9 Moreover, with the integration of GIS, analysis of huge database it’s updating and retrieval can be made in a cost effective manner.10,11,12,13 Digital change detection techniques based on multi-temporal and multi-spectral remotely sensed data have demonstrated a great potential as a means to understand complex dynamics of earth surface features and monitor the changes in land use and land cover pattern over a period of time.14
RS and GIS technique for land use/land cover assessment gives the valuable information in case of choosing the area to be utilized for agriculture land, urban area and industrial uses of a region.15 The statistics obtained from land use/cover maps of Kathmandu Metropolitan was studied using capability of GIS.16 GIS is best utilized for integration of various data sets to obtain a homogeneous composite land development unit which helps in identifying the problem areas and suggest conservation measures.17 Various Remote sensing data products over time have often been incorporated into historical land use information.18,19,20 With the availability of historical Remote sensing data, the reduction in data cost and increased resolution from satellite platforms, Remote Sensing technology appears poised to make an even greater impact on monitoring land-cover and land-use change.21 Remote sensing and GIS together work as a decision support system and are useful to local government and land use planners for the better formulation of future plans for sustainable development of the country.
This study demonstrate the use of two satellite images for defining LULC changes of Banjar river watershed located in between Balaghat and Mandla districts of Madhya Pradesh, India.
Study Area
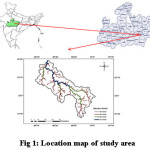
The study area (Fig 1) is Banjar river watershed lies in between Balaghat and Mandla districts of Madhya Pradesh, geographically located between 22005’N to 23029’N latitudes and 80022’E to 81000’E longitudes. The watershed covers total geographical area of 246084.50 ha up to gauging point. It is situated in the eastern part of Madhya Pradesh. Climate of the area is tropical with moderate winter and severe summers and well distributed rainfall received from southwest monsoon. However due to higher general elevation and abundance of forests, summer temperature do not rise as much as in other areas. The normal annual rainfall of the Bamhani Banjar watershed is 1300 mm. Soils of the area are characterized by black grey, red and yellow colours, often mixed with red and black alluvium and ferruginous red gravel or lateritic soils. These soils are commonly known as black soils. In most parts of the study watershed, topsoil is loamy and the subsoil is sandy clay loam except in alluvial deposits that have relatively heavy texture of clay. In barren areas where soil is shallow, fine platy structure surface soil and compressed blocky structure subsurface soils are visible.
Material and Methods
Database preparation
Satellite dataset i.e. Landsat Thematic Mapper (TM) and Enhanced Thematic
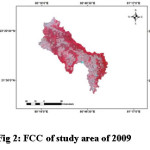
Mapper Plus (ETM+) multi spectral data of Banjar river watershed for 2009 and 2013 were obtained from Global Land and Cover Facility (GLCF) (www.landcover.org) and Earth Explorer (USGS) (https://earthexplorer.usgs.gov) site at a resolution of 30m. These data were imported in the ERDAS Imagine 2011 and were converted into False Color Composite (FCC) with the help of satellite image processing software. The layer stack option in image interpreter tool box was used to generate FCCs (Fig 2& 3) for the study area. Both the satellite images were extracted from the georeferenced outline boundary of study area in ARC GIS environment. Then these data were used for Land use and land cover classification.
 |
|
 |
|
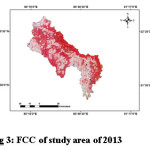 |
Figure 3: FCC of study area of 2013 |
Detection and analysis of LULC
In the present study the Land use/cover maps of study area for the years 2009 and 2013 were prepared with the help of ERDAS IMAGINE 2011 software for the available satellite data. The Google Earth was used as a means of ground verification of satellite data throughout the study. Seven land use and land cover classes were identified in the study area viz., (i) River (ii) Water body (iii) Wasteland (iv) Habitation (v) Forest (vi) Agriculture/other vegetation (vii) Open land/Fallow Land/Barren land.
Land use/cover change detection analysis and accuracy assessment
Post classification method was used for performing land use/cover change detection. Classified images of two different years i.e. 2009 and 2013 were compared to determine the quantitative aspects of changes.
Accuracy assessment of LULC of two different years was done for better validation of result. An accuracy matrix was created using reference image from Google Earth and classified land use map showing each class and over accuracy as confusion matrix. The total accuracy was determined by summing the value of total number of correct plots divided by total number of sampled plots. Additionally, the kappa was used as a measure of agreement between model predictions and reality and then overall kappa was calculated. This accuracy measure attempts to control for a chance agreement by incorporating the off-diagonal elements as a product of the row and column of the error matrix.22
Result and Discussion
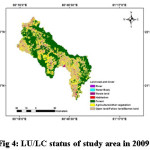
Land use and land cover statistics are obtained through the classification of satellite dataset of two different years i.e. 2009 & 2013. It can be seen that the total investigated area was determined as 246084 ha. Seven LU/LC categories were recognised in the area namely, river, water body, waste land, habitation, forest, agriculture/other vegetation, open land/fallow land/barren land. Fig 4 depicts the land use/cover classes of study area in 2009. In 2009, the dominant feature of LU/LC is forest which is about 44.81 followed by open land/fallow land/barren land which covers about 28.31% of the whole study area. Table 1 presents the different land use and land cover classes with percentage cover of study area.
 |
|
Table 1: Area under different LU/LC classes in study area in 2009
|
Class Name |
Area(ha) |
Area(%) |
|
River |
1914.51 |
0.78 |
|
Waterbody |
1420.31 |
0.58 |
|
Wasteland |
3895.28 |
1.58 |
|
Habitation |
1521.18 |
0.62 |
|
Forest |
110260.00 |
44.81 |
|
Agriculture/Other vegetation |
57395.50 |
23.32 |
|
Open land/Fallow land/Barren land |
69677 |
28.31 |
|
Total |
246084 |
100 |
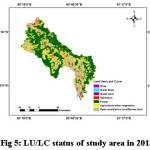
In 2013 (Fig 5), the forest is the dominant feature of land use/cover which is about 47.06% of study area followed by open land/fallow land/barren land (28.80%). The percentage wise distribution of seven LU/LC classes is presented in Table 2.
 |
|
Table 2: Area under different LU/LC classes in study area in 2013
|
Class Name |
Area(ha) |
Area(%) |
|
River |
1277.19 |
0.52 |
|
Waterbody |
2780.19 |
1.13 |
|
Wasteland |
4453.83 |
1.81 |
|
Habitation |
1419.03 |
0.58 |
|
Forest |
115811.00 |
47.06 |
|
Agriculture/ Other vegetation |
49472.00 |
20.10 |
|
Open land/Fallow land/Barren land |
70870.40 |
28.80 |
|
Total |
246084.50 |
100 |
In order to increase the accuracy of land cover mapping of two images, an accuracy assessment of land use/cover has been done. A standard overall accuracy for land use and land cover maps is set between 85 23 and 90% 24. In this study the overall accuracy was found to be 89.70% for 2009 and 91.91% for 2013. The kappa coefficients for 2009 and 2013 maps were 0.86 & 0.89. Details of class wise accuracy for satellite images of 2009 is presented in Table 3&4 and for 2013 in Table 5&6.
Table 3: Error matrix accuracy totals for the classified image (2009)
|
Class Name |
River |
Water Body |
Waste land |
Habitation |
Forest |
Agriculture/Other vegetation |
Open land/Fallow land/Barren alnd |
Total |
|
River |
9 |
0 |
1 |
0 |
0 |
0 |
0 |
10 |
|
Water Body |
0 |
8 |
0 |
0 |
0 |
1 |
1 |
10 |
|
Waste land |
0 |
0 |
10 |
0 |
0 |
0 |
0 |
10 |
|
Habitation |
0 |
0 |
0 |
9 |
0 |
1 |
0 |
10 |
|
Forest |
0 |
0 |
0 |
0 |
45 |
0 |
0 |
45 |
|
Agriculture/Other vegetation |
0 |
0 |
3 |
0 |
1 |
19 |
0 |
23 |
|
Open land/Fallow land/Barren land |
0 |
1 |
1 |
0 |
1 |
0 |
25 |
28 |
|
Total |
9 |
9 |
15 |
9 |
47 |
21 |
26 |
136 |
Table 4: LU/LC classification efficiency for 2009
|
Class Name |
Producer's Accuracy |
User's Accuracy |
|
River |
100.00% |
90.00% |
|
Water Body |
88.89% |
80.00% |
|
Waste land |
66.68% |
100.00% |
|
Habitation |
100.00% |
90.00% |
|
Forest |
95.74% |
100.00% |
|
Agriculture/Other vegetation |
90.48% |
82.60% |
|
Open land/Fallow land/Barren land |
96.15% |
89.28% |
Table 5: Error matrix accuracy totals for the classified image (2013)
|
Class Name |
River |
Water Body |
Waste land |
Habitation |
Forest |
Agriculture/Other vegetation |
Open land/Fallow land/Barren land |
Total |
|
River |
10 |
0 |
0 |
0 |
0 |
0 |
0 |
10 |
|
Water Body |
0 |
9 |
0 |
0 |
0 |
1 |
0 |
10 |
|
Waste land |
0 |
0 |
10 |
0 |
0 |
0 |
0 |
10 |
|
Habitation |
0 |
0 |
0 |
8 |
0 |
1 |
1 |
10 |
|
Forest |
0 |
0 |
0 |
0 |
46 |
1 |
0 |
47 |
|
Agriculture/Other vegetation |
0 |
0 |
1 |
0 |
3 |
15 |
1 |
20 |
|
Open land/Fallow land/Barren land |
0 |
0 |
1 |
0 |
1 |
3 |
24 |
29 |
|
Total |
10 |
9 |
12 |
8 |
50 |
21 |
26 |
136 |
Table 6: LU/LC classification efficiency for 2013
|
Class Name |
Producer's Accuracy |
User's Accuracy |
|
River |
100.00% |
100.00% |
|
Water Body |
100.00% |
90.00% |
|
Waste land |
83.33% |
100.00% |
|
Habitation |
100.00% |
80.00% |
|
Forest |
92.00% |
97.87% |
|
Agriculture/Other vegetation |
71.42% |
75.00% |
|
Open land/Fallow land/Barren land |
92.30% |
82.76% |
According to the accuracy assessment results using supervised classification for 2009, the wasteland had the lowest producer’s accuracy of 66.68%. All the other classes were classified over 85% producer’s accuracy meaning quite accurate classification. In addition to accuracy assessment results for 2013, the agriculture/other vegetation had the lowest producer’s accuracy of 71.42%. All the other classes were classified over 83% of producer’s accuracy. The lowest accuracy for the wasteland and agriculture/other vegetation would be explained by the fact that study area is highly covered with the dense forest and has sparse vegetation which led to the confusion with the wasteland and fallow land.
Therefore accurate and up-to-date information regarding the land use/cover classification are assessed with the help of the remote sensing and GIS. The Table 7 indicates that both the positive and negative changes have been occurred in land use and land cover pattern of Banjar river watershed.
Table 7: Area and amount of change in different land use and land cover categories in
Bamhani Banjar watershed during 2009 to 2013
|
Class Name |
Change 2009-2013 (ha) |
Change 2009-2013 (%) |
|
River |
-637.32 |
-0.26 |
|
Waterbody |
1359.88 |
0.55 |
|
Wasteland |
557.55 |
0.23 |
|
Habitation |
-102.15 |
-0.04 |
|
Forest |
5551.00 |
2.26 |
|
Agriculture/ |
-7923 |
-3.22 |
|
Open land/Fallow land/Barren land |
1193.40 |
0.48 |
It can be been seen that in 2009, the area under river was found to be 1914.51 hawhich has been converted into 1277.19 hain 2013. In the opposite way open land/fallow land/barren land has been increased from 70870.40 ha to 69677 ha which accounts for 0.48%. In contrast the decrease in agriculture/other vegetation and habitation has been observed as the agriculture/other vegetation has been decreased from 57395.50 ha to 49472.50 ha and habitation has been decreased from 1521.18 ha to 1419.03 ha. In contrast, forest in study area has been increased from 110260 hain 2009 to 115811 hain 2013 which accounts for 2.26%. A slight increase in the waste land and water body has also been observed as the wasteland increased by 557.55 hain 2013 and water body increased by 1359.88 ha.The results reveal that the rate of change between years 2009 and 2013 is small. Also, a small change in aerial extent has been noticed in arable land and forest cover. In all other classes, very small changes have been noticed which can be generalized as “no change”. For example, 0.04% change was observed in habitation between 2009 and 2013 which is negligible and can be considered as no change. These small changes reflect that the progress of development in the watershed is in standstill condition.
Conclusion
On the basis of the result obtained through the integration of remote sensing and GIS in modelling the change detection of the land use and land cover, it is concluded that the changes in the diversity of earth surface features have not been altered very much in 5 years. The study revealed that the area under agriculture/other vegetation has been decreased and area under open land/fallow land/barren land has been increased. Therefore it seems that the area needs Agricultural Development Program. The decrease in area covered under agriculture/other vegetation indicates that the more farming/agricultural practices have to be adopted in the area.
The study elucidates the significance of the incorporation of remote sensing and GIS to provide the accurate spatial information on land use and land cover of the area in a time and in a cost effective manner.
Acknowledgement
The authors acknowledge all the support received from Department of Soil and Water Engineering, College of Agricultural Engineering, J.N.K.V.V., Jabalpur (M.P.), India for this study.
References
- Land quality indicators and their use in sustainable agriculture and rural development. FAO Land and Water Bulletin 5; 212 (1997).
- FAO/UNEP. The Future of our land: facing the challenge. Guidelines for integrated planning for sustainable management of land resources. 71p (1999-a).
- Sankhala, S., Singh, B. Evaluation of urban sprawl and land use land cover change using remote sensing and GIS techniques: a case study of Jaipur City, India. Int. J. Emerging Technol. Adv. Eng.4 (1); 66–72 (2014).
- Sharma, KD. The hydrological indicators of desertification. J Arid Envir 39; 121–132 (1998).
CrossRef - Doygun, H., Alphan, H. Monitoring urbanization ofIskenderun, Turkey and its negative implications. Environmental Monitoring and Assessment. 114; 145–155. (2006).
CrossRef - Chen, X., Chen, J., Shi, Y., Yamaguchi, Y. An automated approach forupdating land cover maps based on integrated change detection andclassification methods. ISPRS J. Photogramm. Remote Sens.71; 86–95 (2012).
CrossRef - Dronova, I., Gong, P., Wang, L. Object-based analysis and changedetection of major wetland cover types and their classificationuncertainty during the low water period at Poyang Lake, China.Remote Sens. Environ. 115; 3220–3236 (2011).
CrossRef - Jensen, L., B. Gorte. Principle of remote sensing, Digital image classification, ITC, Enchede. The Netherlands (2001).
- Kachhwala, T.S. Temporal monitoring of forest land for changedetection and forest cover mapping through satellite remotesensing. In: Proceedings of the 6th Asian Conference on Remote Sensing. National Remote Sensing Agency, Hyderabad; 77–83. (1985).
- Star, J.L., Estes, J.E., McGwire, K.C. Integration of Geographic Information Systems and Remote Sensing. University Press, Cambridge, New York (1997).
- Chilar, J. Land cover mapping of large areas from satellites:status and research priorities. J. Remote Sens. 21 (67); 1093–1114 (2000).
- Tiwari, J, Patil, R.J., Sharma, S.K. Gour River Sub-watersheds Prioritization using Morphometric Parameters: A Remote Sensing and GIS Based Approach. International Journal of Science, Engineering and Technology Research (IJSETR). 5 (10); 3041-3046 (2016a).
- Tiwari, J, Patil, R.J., Sharma, S.K. Morphometric Analysis of Gour River Catchment: A GIS based approach. International Journal of Engineering Research-Online. 4 (5); 135-143 (2016b).
- Rawat, J.S., Biswas, Vivekanand., Kumar, Manish., Changes in land use/cover using geospatial techniques: A case study of Ramnagar town area, district Nainital, Uttarakhand, India. The Egyptian Journal of Remote Sensing & Space Sciences16; 111-117 (2013).
CrossRef - Selcuk, R., Nisanci, R., Uzun, B., Yalcin, A., Inan, H., Yomralioglu, T. Monitoring land-use changes by GIS and remote sensingtechniques: case study of Trabzon, http://www.fig.net/pub/morocco/proceedings/TS18/TS18_6_reis_el_al.pdf 5 (2003).
- Bhagawat, R. Application of remote sensing and GIS, landuse/land cover change in Kathmandu metropolitan city. Nepal J. Theor. Appl. Inform. Technol. 23 (2); 80–86 (2011).
- S.S, Vasantha Rao. B.V.T, Raju. M.V., Anand Sagar. M. Identification of Ambient Air Pollution Prevention Zones Using Remote sensing and GIS: A Model Study. Current World Environment. 6(2); 207-215 (2011).
- Acevedo, W., T. Foresman and Buchanan, Origins and philosophy of building a temporal database to examine human transformation processes. ASPRS/ACSM Annual Convention and Exhibition, Baltimore, MD(1996).
- Clarke, K., B. Parks, Crane. Geographic Information Systems and Environmental Modeling, Prentice Hall.(2002).
- Meaille, R., Wald, L. Using geographical information system and satellite imagery within a numerical simulation of regional urban growth. International Journal of Geographical Information Science.4(4); 445-456 (1990).
CrossRef - Rogan, J. Chen., D. Remote sensing technology for mapping and monitoring landcover and land-use change. Progress in Planning 61(4): 301-325 (2004).
CrossRef - Cohen, J. A. Coefficient of agreement of nominal scales. Educational and Psychological Measurements, 20(1); 37–46 (1960).
CrossRef - Anderson, J. R., Hardy, E. E., Roach, J. T., Witmer, R. E. A land-use and land-cover classificationsystem for use with remote sensor data. US Geological Survey Professional Paper. 964 (1976).
- Lins, K. S., Kleckner, R. L. Land cover mapping: An overview and history of the concepts. In J. M. Scott, T. H. Tear, & F. Davis (Eds.), Gap analysis: A landscape approach to biodiversity planning. 57–65 (1996).


