Assessment of Groundwater Quality of Agra District for the Irrigation Purpose
Vinod Kumar1 , Surjeet Singh2 and Gopal Krishan2 *
http://dx.doi.org/10.12944/CWE.12.1.08
Groundwater quality of Agra district has been assessed considering twelve water quality parameters viz. pH, electrical conductivity (EC), total dissolved solid (TDS), chloride (Clˉ), bicarbonate (HCO3ˉ), sulfate (SO4²Ë‰), silicon (Si), iron (Fe), aluminium (Al), calcium (Caâºâº), magnesium (Mgâºâº) and sodium (Naâº). Data on groundwater quality of fifteen blocks of the Agra district were collected for nine years (2006-2014) from the Ground Water Department, Government of Uttar Pradesh. The data are investigated using Wilcox and Piper diagrams with the help of Aquachem 2011.1 software. The assessment on suitability of groundwater quality for the irrigation purpose is done using sodium percentage (Na%), Sodium Absorption Ratio (SAR) and Residual Sodium Carbonate (RSC) for all the blocks. The results show that groundwater of various blocks of Agra district is of Naâº- Clˉ, Ca2âº- Naâº- HCO3ˉ, Ca²+ - Mg²+ - Clˉ, Ca²+ - HCO3ˉ, Ca²+ - Clˉ, Naâº- CIˉ, Ca²+ - Mg²+ - Clˉ - SO4²Ë‰ and Ca²+ - Na+ - HCO3ˉ type. It is also found that the groundwater quality of the blocks Barauli Ahir, Fatehapur Sikari, Saiyan, Achhnera, Shamsabad, Khandouli, Pinahat, Jaitpur Kalan and Bah falls under very good to medium category and can be used for the irrigation purpose. However, the groundwater quality for the blocks Bichpuri, Akola, Fatehabad, Khairagarh, Etmadpur and Jagner falls under Medium to very bad category and hence cannot be used for the irrigation purpose. The outcome of the study would be helpful to the farmers, policy makers and water management authorities in planning and management of irrigation water.
Copy the following to cite this article:
Kumar V, Singh S, Krishan G. Assessment of Groundwater Quality of Agra District for the Irrigation Purpose. Curr World Environ 2017;12(1). DOI:http://dx.doi.org/10.12944/CWE.12.1.08
Copy the following to cite this URL:
Kumar V, Singh S, Krishan G. Assessment of Groundwater Quality of Agra District for the Irrigation Purpose. Curr World Environ 2017;12(1). Available from: http://www.cwejournal.org/?p=16889
Download article (pdf) Citation Manager Publish History
Introduction
Groundwater is an important source of fresh water supply for use in domestic, agricultural and industrial sectors in major part India. Inconsistent monsoon rainfall, deficient surface water and over draft of groundwater resources inspire to acquire knowledge of the occurrence, replenishment, and recharge of groundwater7. Increase in demand for water has led to the water scarcity and water quality deterioration in Indo-Gangetic basin2-6. Indiscriminate development of groundwater is not only affecting the availability of this resource but also causing geogenic groundwater contamination like arsenic. In general, groundwater quality is found to be affected by geogenic and anthropogenic activities viz., (i) excessive use of fertilizers and pesticides in agricultural areas, (ii) polluting surface water bodies by untreated/partially treated wastewater and (iii) excessive pumping and improper management of groundwater resource9,10,12. It has been reported by MacDonald et al (2016)6 that the 2/3rd of the groundwater is contaminated in Indo-Gangetic basin. Good quality of water is an essential requirement for the better crop yield under good soil and water management practices. Therefore, good quality of water is one of the factors for the assessment of the suitability of irrigation water. Since groundwater flows underground through soil and rock medium, it always contains some amount of dissolved salts depending upon the sources of recharge and the strata through which it flows. Therefore, it is always advisable to evaluate and assess quality of water before its use for the irrigation purpose.
In the present paper, water quality assessment on suitability for the irrigation purpose has been done for the Agra district of the Uttar Pradesh state of India.
Study Area
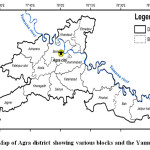
The Agra district falls in the western part of the Uttar Pradesh between 27.11' to 27.11' N latitude and 78.0' to 78.2' E longitude (Figure 1) at an altitude of 169 meters above sea level. Agra city is situated on the bank of the Yamuna River. Administratively, the district is divided into six tehsils and fifteen blocks. Major crops grown in the district are wheat, paddy, bajra, mustard and potato. Over 7200 Small Scale Industrial Units are spared all over the district. According to Census 2011, the area of Agra district is 4027 km2 which include 38,38.6 km2 rural area and 188.4 km2 urban area. Total population of the district is 44,18,797 out of which 23,64,953 are males and 20,53,844 are females. Of the total population, 23,94,602 constitute the rural population and 20,24,195 the urban population.
 |
|
Agra district has a continental sub-tropical climate with long hot summers from April to September when temperature reaches as high as 45 °C. During summers dry winds (heat waves) blow in this region. During monsoon months from July to September, about 670 mm of rainfall occurs. The maximum temperature during summer is 45 °C and minimum temperature is about 21.9 °C and during winter maximum temperature goes up to 31.7 °C and minimum temperature up to about 4.2 °C.
Methodology
The water quality data are analysed using standard procedures for twelve water quality parameters viz. pH, electrical conductivity (EC), total dissolved solid (TDS), chloride (Clˉ), bicarbonate (HCO3ˉ), sulfate (SO4²Ë‰), silicon (Si), iron (Fe), aluminium (Al), calcium (Caâºâº), magnesium (Mgâºâº) and sodium (Naâº) of fifteen blocks of the Agra district collected for nine years period from 2006 to 2014 from the Ground Water Department, Government of Uttar Pradesh. In order to check the results of laboratory analysis, ionic balance has also been performed and the error is found less than 10%.
Piper Trilinear Diagram
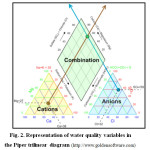
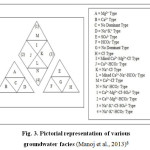
The concept of hydro-chemical facies can be used to denote the diagnostic chemical characteristics of water in the hydrological system. The facies reflect the effect of chemical processes occurring among the minerals within the lithological frame work and in the ground water. The diagram is useful in graphically presenting a group of analysis on the same plot. The Piper trilinear diagram consists of two lower triangular fields, one at the left and another at the right, respectively and a central diamond-shaped field. All three fields have scales reading divided in 100 parts. The percentage-wise reacting values of the three cations (Ca2+, Mg2+, Na++K+) and three anions (HCO3-, SO42-, Cl-) are plotted as a single point according to the conventional trilinear coordinates at lower left and right triangles, respectively. These are projected upwards parallel to the sides of the triangles so as to give a point in the central diamond-shaped field. This point indicates the overall chemical character of the groundwater. Further, the position of this point indicates the relative composition of groundwater in terms of cation-anion pairs that correspond to the four vertices of the field. The three areas of plotting show the essential chemical character of groundwater according to the relative concentrations of its constituents as shown in Figures 2 and 3.
 |
|
 |
|
The water quality is evaluated on the basis of Sodium Absorption Ratio (SAR), Sodium Percent and Residual Sodium Carbonate (RSC), Wilcox plot.
Sodium Absorption Ratio (SAR)
SAR is the most commonly used parameter for evaluating water suitability for the irrigation purpose. If water used for irrigation is high in Na+ and low in Ca2+, the ion-exchange complex may become saturated with Na, which destroys soil structure because of dispersion of clay particles. According to Richards (1954)11, SAR is expressed as
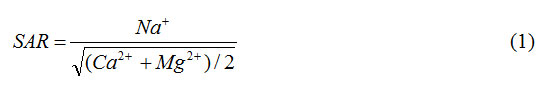
where Na+, Ca2+ and Mg2+ are the percentages of concentrations in milli-equivalents per litre.
Sodium Percentage (Na %)
Sodium percentage in the water can displace the calcium and magnesium ions in the soil. This will cause a decrease in the ability of the soil to form stable aggregates and a loss of soil structure and tilt. This will also lead to a decrease in infiltration and permeability of the soil leading to problems with crop production. Todd (1980)13 defined soluble sodium percentage (SSP) or Na% as
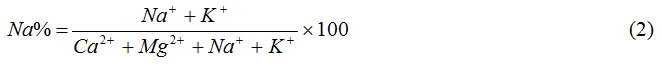
where K+ is the percentage of concentration in milli-equivalents per litre.
Residual Sodium Carbonate (RSC)
When the carbonate concentration becomes too high, the carbonates combine with calcium and magnesium to form a solid material which settles out of the water. This excess is denoted by RSC and is expressed as
RSC = (CO3²Ë‰ + HCO3-) – (Ca2+ + Mg2+) (3)
where CO3²Ë‰ and HCO3- are the percentages of concentrations in milli-equivalents per litre.
A Wilcox plot is a simple scatter plot of Sodium Hazard (SAR) on the Y-axis versus Salinity Hazard (conductivity) on the X-axis and is used to determine the viability of water for irrigation purposes.
Criteria for Assessment of Suitability of Water for the Irrigation Purpose
CGWB and CPCB (2000) has defined the criteria for assessment of suitability of water for the irrigation purpose with respect to electrical conductivity, sodium content, SAR and RSC as given in Table 1.
Table 1: Guidelines for the evaluation of irrigation water quality
|
Water class |
Na (%) |
EC (mS/cm) |
SAR |
RSC (meq/L) |
|
Excellent |
< 20 |
< 250 |
< 10 |
< 1.25 |
|
Good |
20-40 |
250-750 |
10-18 |
1.25-2.0 |
|
Medium |
40-60 |
750-2250 |
18-26 |
2.0-2.5 |
|
Bad |
60-80 |
2250-4000 |
> 26 |
2.5-3.0 |
|
Very bad |
> 80 |
> 4000 |
> 26 |
> 3.0 |
It is obvious from Table 1 that if the value of above-mentioned parameters is less, the water will be more suitable for the irrigation use. In the present paper, the groundwater quality has been assessed block-wise following the criteria specified in Table 1.
Results and Discussion
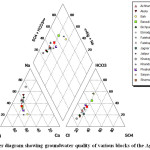
The water quality characterization and assessment on suitability for the irrigation purpose has been done using the Wilcox and Piper diagram, RSC, SAR and EC. Wilcox and Piper diagrams have been prepared using Aquachem 2011.1 software available at the Centre of Excellence for Advanced Groundwater Research (CEAGR) of National Institute of Hydrology (NIH), Roorkee. The SAR and RSC values have been computed using equation (1) and (3), respectively. In order to plot the Piper and Wilcox diagram for each block of the Agra district, the time series water quality data for the period 2006 to 2014 has been averaged out block-wise. The times series average data are then plotted in the Piper and Wilcox diagram and are shown in Figure 4 and 5.
 |
|
Figure 4 shows that for the Achhnera block anions (HCO3ˉ+SO4²Ë‰) are 42% and cations (Mg²âº+ Naâº) are 82%, for Akola anions are 25% and cations are 82%, for Bah anions are 74% and cations are 65%, for Barauli Ahir anions are 80% and cations are 65%, for Bichpuri anions are 85% and cations are 50%, and for Etmadpur anions are 42% and cations are 82%. Fatehabad anions are 46% and cations are 85%, for Fatehapur Sikari anions are 46% and cations are 85%, for Jagner anions are 40% and cations are 82%, for Jaitpur Kalan anions are 76% and cations are 70%, for Khairagarh anions are 46% and cations are 78%, for Pinahat anions are 54% and cations are 74%. For Saiyan anions are 40% and cations are 82%, for Shamsabad anions are 52% and cations are 82%, and for Khandouli anions are 56% and cations are 74%.
In overall it is found that the water facies of the blocks Achhnera, Akola, Bichpuri, Etmadpur, Fatehabad, Fatehapur Sikari, Jagner, Jaitpur Kalan, Khairagarh and Saiyan is Ca²âº- HCO3ˉ type and Barauli Ahir, Shamsabad, Pinahat, Bah and Khandouli is mixed Ca²âº-Mg²âº-CIˉ type.
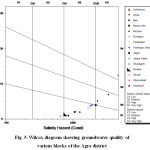
The groundwater quality results are also plotted in Wilcox diagram for all the blocks of Agra district as shown in Figure 5.
 |
|
It is seen from Figure 5 that the groundwater quality data for majority of the blocks of the Agra district falls under S1 and S2 categories of Sodium Hazard (low to medium sodium hazard) except one block (Khairagarh) in the S4 category which indicates very high sodium hazard. On the other hand, groundwater quality data of majority of the blocks falls under the C3 and C4 salinity hazard which indicates high to very high salinity hazard except for Jaitpur Kalan block which falls in the C2 category of medium salinity hazard. In overall, the groundwater quality of the Agra district is characterized as C3S1 and C4S2 type.
Evaluation of the groundwater quality
The electrical conductivity of the blocks Barauli Ahir, Fatehapur Sikari, Shamsabad, Khandouli, Pinahat, Bah and Jaitpur Kalan is found up to 2,250 µmho/cm which depicts that the quality of water as Medium to Excellent. However, the electrical conductivity of the blocks Bichpuri, Akola, Saiyan, Fatehabad, Achhnera, Khairagarh, Etmadpur and Jagner is found more than 2,250 µmho/cm which indicates the quality of water as Bad to Very Bad.
The sodium percentage of the blocks Barauli Ahir, Fatehapur Sikari, Shamsabad, Khandouli, Pinahat, Etmadpur, Jaitpur Kalan, Jagner, Bah, Saiyan and Fatehabad is found up to 60% and indicates the quality of water as Medium to Excellent. However, the sodium percentage of the blocks Akola, Achhnera, Khairagarh and Bichpuri, varies from 60 to more than 80% which indicates the quality of water Bad to Very Bad.
SAR of all the blocks is found up to 26 and indicates the quality of water Medium to Excellent, except for the block Khairagarh which shows SAR value more than 26 having water quality Very Bad.
RSC value of all the blocks of the district is found less than 1.25 which indicates the groundwater quality as Excellent Class type.
Conclusions
The groundwater quality of various blocks of Agra district is characterized as Na⺠- Clˉ, Ca2+ -Na⺠- HCO3ˉ, Ca²âº - Mg²âº - Clˉ, Ca²âº - HCO3ˉ, Ca²âº - Clˉ, Na⺠- Clˉ, Ca²âº - Mg²âº - Clˉ - SO4²Ë‰, Ca²âº - Naâº- HCO3ˉ type. It is also concluded that the quality of water for the block Barauli Ahir, Fatehapur Sikari, Saiyan, Achhnera, Shamsabad, Khandouli, Pinahat, Jaitpur Kalan and Bah falls under Medium to Very Good category and can be used for the irrigation purpose. However, the quality of water for the blocks Bichpuri, Akola, Fatehabad, Khairagarh, Etmadpur and Jagner falls under Medium to Very Bad category and hence must be used with caution for the irrigation purpose depending on the soil types and salinity resistant crops.
Acknowledgement
The authors are thankful to Dr. N.C. Ghosh, Scientist ‘G’ and Head Ground Water Hydrology Division, National Institute of Hydrology, Roorkee (Uttarakhand) for providing the groundwater quality data of Agra district from the Peya Jal Suraksha Project sponsored by MoWR, RD & GR, Government of India.
References
- CGWB and CPCB (2000). Status of Ground Water Quality and Pollution Aspects in NCT-Delhi, India.
- Krishan Gopal, Lapworth D. J., Rao M. S., Kumar C. P., Smilovic M. and Semwal P. 2014. Natural (Baseline) Groundwater Quality In The Bist-Doab Catchment, Punjab, India: A Pilot Study Comparing Shallow and Deep Aquifers. International Journal of Earth Sciences and Engineering, 7 (01): 16-26.
- Krishan Gopal, Singh, R.P. and Takshi, K.S. 2015. Water Level Fluctuation as the Sum of Environmental and Anthropogenic Activities in Southeast, Punjab (India). Journal of Environmental and Analytical Toxicology. 5: 298.
- Krishan, Gopal, Singh, Surjeet, Kumar, C.P, Garg, P.K., Gurjar, Suman, Ghosh, N.C. and Chaudhary, Anju. 2016. Assessment of groundwater quality for drinking purpose using water quality index in Muzaffarnagar and Shamli districts, Uttar Pradesh, India. Hydrology: Current Research, 7:1.
- Lapworth DJ, MacDonald AM, Krishan G, Rao MS, Gooddy DC, Darling WG. 2015. Groundwater recharge and age-depth profiles of intensively exploited groundwater resources in northwest India. Geophys. Res. Lett., 42 (18): 7554-7562.
CrossRef - MacDonald, Alan, Bonsor, Helen, Ahmed, Kazi, Burgess, William, Basharat, Muhammad, Calow, Roger, Dixit, Ajaya, Foster, Stephen, Krishan, Gopal, Lapworth, Daniel, Lark, Murray, Moench, Marcus, Mukherjee, Abhijit, Rao, M.S., Shamsudduha, Mohammad, Smith, Linda, Taylor, Richard, Tucker, Josephine, Steenbergen Frank van, Yadav, Shobha. 2016. Groundwater depletion and quality in the Indoâ€Gangetic Basin mapped from in situ observations. Nature Geosciences. DOI:10.1038/NGEO2791.
CrossRef - Mahananda, M. R., Mohanty, B. P. and Behera Mahananda, N. R. (2010): Physico – chemical analysis of surface and ground water of Bargarh district, Orissa, India. IJRRAS, 2: 26-30.
- Manoj K., Ghosh S. and Padhy P.K. (2013), Characterization and Classification of Hydrochemistry using Multivariate Graphical and Hydrostatistical Techniques, Research Journal of Chemical Sciences, 3(5), 32-42.
- Palanisamy P. N., Geetha A., Sujatha M., Sivakumar P., and Karunakaran K. (2007), Assessment of Ground Water Quality in and around Gobichettipalayam Town Erode District, Tamilnadu. E-Journal of Chemistry, Vol. 4, No. 3, pp: 434-439.
CrossRef - Purushothaman, P., Rao, M. S., Rawat, Y. S., Kumar, C.P., Krishan, Gopal and Parveen, T. 2013. Evaluation of hydro-geochemistry and water quality in Bist-Doab region, Punjab, India. Environmental Earth Sciences, 72:693-706
CrossRef - Richards, L. A. (ed.), 1954. Diagnosis and improvement of saline and alkali soils. Agricultural Handbook 60, U.S. Dept. Agric., Washington, D.C., 160 p.
- Tiwari, AK, Singh, P.K., Singh, A.K., Maio, Marina De. 2016. Estimation of Heavy Metal Contamination in Groundwater and Development of a Heavy Metal Pollution Index by Using GIS Technique. Bulletin of Environmental Contamination Toxicology. DOI 10.1007/s00128-016-1750-6.
CrossRef - Todd, D. K. (1980). Groundwater hydrology (2nd ed., p. 315). New York: Wiley.


