Assessment of Salinity and Fluoride in Groundwater of Semi-Arid Region of Punjab, India
Gopal Krishan 1 * , M. S. Rao 1 , C. P. Kumar 1 , Sudhir Kumar 1 , R. S. Loyal 2 , G.S. Gill2 and Prabhat Semwal1
http://dx.doi.org/10.12944/CWE.12.1.05
Groundwater is the major source of drinking water in Southwestern semi-arid region of Punjab, India which is now facing severe salinity and fluoride (F-) problems. A study was carried out in the Bathinda district of southwest semi-arid region of Punjab to assess the salinity and F- concentrations. Groundwater samples from 21 locations were analyzed, and 59% were found to exceed the permissible electrical conductivity (EC) limit of 1500 µS/cm1. Fluoride concentrations exceeded the WHO (2008)1 permissible limit of 1.50 mg/L in 69% of the samples which may significantly affect human health by causing fluorosis. The increase in groundwater levels leading to high evaporation which caused an accumulation of salts and further resulted in increase in EC. The increased F- concentration is mainly due to rock-water interactions which led to fluorite dissolution.
Copy the following to cite this article:
Krishan G, Rao M. S, Kumar C. P, Kumar S, Loyal R. S, Gill G. S, Semwal P. Assessment of Salinity and Fluoride in Groundwater of Semi-Arid Region of Punjab, India. Curr World Environ 2017;12(1). DOI:http://dx.doi.org/10.12944/CWE.12.1.05
Copy the following to cite this URL:
Krishan G, Rao M. S, Kumar C. P, Kumar S, Loyal R. S, Gill G. S, Semwal P. Assessment of Salinity and Fluoride in Groundwater of Semi-Arid Region of Punjab, India. Curr World Environ 2017;12(1). Available from: http://www.cwejournal.org/?p=16741
Download article (pdf) Citation Manager Publish History
Introduction
The rapid increase in the population accompanied by intense agricultural and urban development has caused a high demand for groundwater resources. This has led to large scale groundwater development, as well as water quality issues and sometimes without responsible management as well as without due attention to quality issues.2 Fluoride (F-) is one of the most undesired elements present in underground water extracted for drinking purposes and its presence higher than the prescribed permissible limit may significantly affect human health by causing fluorosis.3,4 Fluoride is generally present in the naturally occurring minerals fluorite (CaF2), cryolite (Na3AlF6), topaz, tourmaline, muscovite, biotite, hornblende and villianmite.5-9 Its occurrence in groundwater can be attributed to the weathering and leaching of amphiboles, fluorite, apatite and mica.10-14 The F- concentrations are generally found to be higher in water with increasing levels of alkalinity.
In the past 3-4 decades, the Punjab plains have witnessed a rapid rise in groundwater use, which has resulted in its diminished quality and a decline in the water table.15-27 The deteriorating groundwater quality is mainly due to an increase in groundwater salinity and high F- concentrations. Causes for the salinity and high F- concentration are not well understood. This, therefore, has resulted in the current focus on assessing the salinity and F- concentration in groundwater of the Bathinda district of Punjab, India. The study also examined the concentration and spatial distribution of F- and its possible origin in relation to geological features of the study area.
Materials and Methods
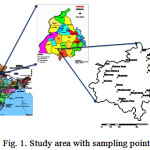
Bathinda district of Punjab was chosen for the present study. The district has total geographical area of 3369 sq. km and has Bathinda, Nathana, Rampura, Phool, Talwandi Sabo, Sangat, Maur blocks. The study area lies between North latitude 29°33’ and 30°36’ and East longitudes 74°38’ and 75°46’ in the southern part of Punjab (Fig. 1). It comes under the semi-arid region being near to the desert of Rajasthan with average annual rainfall of 430 mm and is concentrated in the period from July to mid-September. The summer temperature rises as high as 49°C and winter temperature goes down to as low as -1.4°C. The weather is generally dry but is very humid from mid-May to the end of August.
 |
|
The rocks of the Aravalli-Delhi Supergroup and the Malani Igneous Suite are comprised of greywacke, carbonate sediments, calcareous shale and slate, and the high heat producing granites and felsites form the basement in the region.28-29 The scattered outcrops of the Aravalli-Delhi Super Group occur at Tusham just south of the study area. Soils in the study area fall in the aridic and moisture regime. Soils associated with the alluvial plains show better indurations with mature development of the soil profile. These are composed of different layers of clay, sticky clay and fine to coarse grained sandstone. The top layer is dark reddish silt and generally rich in concretions and calcareous nodules due to high evaporation. A sequence of halite and associated evaporate (polyhalite, anhydrite, limestone and dolomite) belonging to the Hanseran Group overlie the Jodhpur Group.30 The dolomite/dolomitic limestone is of a generalized foetid character, related to biogenic reduction and related processes; carbonaceous material and entrapped gas associated with Malout Conglomeratic facies of Tertiary age overlie the evaporate sequence.31 The geo-morphology, an undulating relief, with around 200 m of poorly preserved, Recent and Sub-recent paleo-surface exists around southwest Punjab, and is also characterized by sandy and carbonate Aeolian material, along with irregular stretches of low-lying sand dunes. Singh (1992)32 has identified Older plains and Aeolian deposits (both transverse Barchans and longitudinal dunes) in the area.
The groundwater samples were collected from 21 randomly selected sites (Fig. 1) using standard protocol covering all the 7 blocks of the Bathinda district. Wells/tubewells were selected to represent different geological formations as well as land use patterns and different depths (9.14 m – 106.68 m) of the aquifer.
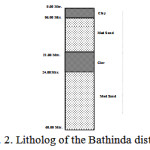
The sub-surface lithology drilled down to 60 m (Fig. 2) reveals an uppermost stratum of clay that is 2-6 m deep. This layer impedes the percolation of surface runoff into the soil, leading to surface flooding and water logging, even in areas having a saturated zone beyond the depth of 6 m. A thick pervious stratum of medium sand is present at a depth of 24-60 m. On a regional scale, this is the only aquifer containing groundwater under phreatic conditions. The depth of water level was recorded using the ‘Water Level Sounder’ (Eijelkemp,Holland).
 |
|
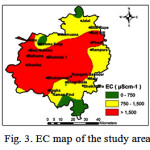
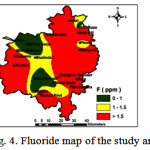
All water samples were collected in pre-washed polyethylene bottles. Before taking the sample the hand pumps were properly flushed for at least 5 min and at the time of sampling, bottles were thoroughly rinsed 2-3 times with the groundwater to be sampled. Samples were collected only after electrical conductivity (EC) measurement using an in-situ probe (Mettler Toledo, Sonnenbergstrasse 74 CH 8603 Schwerzenbach, Switzerland) reached constancy and then filtered to separate the suspended sediments. Latitude & longitude of the sample sites were noted using a Garmin global positioning system (Garmin International Inc., Olateh, Kansas, USA). The analysis was carried out as early as possible in the laboratory. The samples were analysed for F¯ using a calibrated Dionex ion chromatograph ICS-5000 (Sunnyvale, CA, USA) at the Isotope Laboratory, National Institute of Hydrology, Roorkee. The maps of the Figs. 3, 4 and 5 were generated using GIS software, Arc GIS 9.3. There is an interpolation tool in Arc GIS (topo to raster) which used to interpolate a hydrologically correct surface from point, line and polygon data.
Results and Discussion
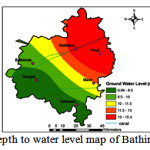
Variations of EC and F- concentration in the study area are presented in Figs. 3 and 4, respectively. As evident from Fig. 3, only 41% of the area have EC values below 1500 µS/cm, while 59% have EC values >1500 µS/cm, the prescribed limit for drinking water1. The high values of EC are found in the areas adjacent to the Bathinda branch of Sirhind Canal (Fig. 5) and its impact is further extended laterally in the western part due to a rise in groundwater levels. This rise is also due to its reduced use as compared to the canal water, and comparatively warmer temperatures in the summers due to its proximity to the desert.31 Salinity is caused due to the rise of salts in soils due to the increase in evaporation along the Bathinda branch of Sirhind canal15 as evident from Fig. 5, where the depth to water level is higher in Bathinda and Sangat blocks.
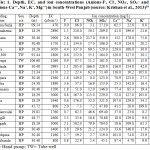
The values for Ca++ varied from 18 to 229 ppm with an average of 78.1 ppm (Table 1). The highest value was found in a groundwater sample from Mehta, and the lowest a sample from Burj Gill. All of the Ca++ levels were within the permissible limit of 200 ppm1 except for the sample collected at Mehta.
Concentrations of F¯ ranged from 0.60-4.40 mg/L (Table 1). Water samples collected from approximately 57 % of the study area exceed the permissible limit (Fig. 4) of 1.50 mg/L for drinking water.1
Fluorine reacts immediately to form F- compounds due to its high electro-negativity, making the presence of free fluorine a remote possibility. Under favourable physico-chemical conditions with long residence time the fluorine may occur in dissolved form in groundwater.5,33
The groundwater analysis showed that sodium (Na+) values range from 4.7 mg/L to 509 mg/L and the potassium (K+) values range from 8.2 mg/L to 199.0 mg/L. The chloride (Cl-) values range from 7.3 mg/L to 502 mg/L and the nitrate (NO3-) values range from 2.7 mg/L to 217 mg/L. The sulphate (SO4--) values ranged from 27.1 mg/L to 784.0 mg/L.
 |
|
 |
|
 |
|
The water level depth in Bathinda district ranged from 6.9 to 15.4 m (Fig. 5). Existence of fresh water zones upto deeper levels, as have been established in the current work in the Phul and Nathana blocks, reflect on the declining water table levels and the consequential difficulty of its extraction22.
 |
|
During weathering and circulation of water in rocks and soils, F- can be leached out and get dissolved in groundwater. The variation in F- concentrations of groundwater depends on the geological settings and type of rocks. The F- concentration of groundwater is also influenced by the presence of other ions. A moderate positive relationship between F- and Ca++ (Dancey and Reidy's, 2004)34 was observed (r=0.77, R2=0.59; p-value=0.0013 at p=<.01; df =14) in the samples collected from the depth=18-45m and where NO3- concentration is <80mg/L. Strong positive significant correlations were also observed between Na+ and Cl- (r= 0.84, R2=0.71, p-value=0.00001 at p=<.01; df =19); Na+ and SO4++ (r= 0.89, R2=0.78, p-value=0.00001 at p=<.01; df =19); Cl- and SO4-- (r= 0.94, R2=0.89, p-value=0.00001 at p=<.01; df =19). A moderate positive non-significant correlation was observed between Mg++ and SO4-- (r= 0.45, R2=0.20, p-value=0.0532 at p=<.01; df =19).
High F- concentrations are linked to high sodium contents, high pH and low Ca++ concentrations.35 The weathering of Na+ rich sediments increases pH which in turn triggers the dissolution of CO2. The consequent increase in HCO3- and CO3-- causes oversaturation in the groundwater compared to calcite, leading to precipitation of this mineral. This precipitation lowers Ca++ concentrations in solution and leads to a sub-saturation for fluorite in the system. As a result, fluorite will dissolve and F- concentration will increase (equations 1-5). The samples from Burj Mehma, Phul, Rampura, Jhumba, Khemuana, Burj Gill, Jalal, Ramgarh, Maur with low Ca++ concentrations are typical of high F- groundwater.
CaCO3 ↔ Ca++ + CO3-- K=10-8.4 ------- (1)
CaF2 ↔ Ca++ + 2F- K=10-10.57 ------- (2)
CaF2+Na2CO3 → CaCO3 + 2F- + 2Na+ ------- (3)
CaF2+2NaHCO3 → CaCO3 + 2F- + 2Na+ + H2O + CO2 ------- (4)
2Na(AlSi3)O8 + 2H+ + 9H2O → Al2Si2O5(OH)4+2Na+ + 4H4SiO4 ------- (5)
A weak negative statistically non-significant relationship34 between F- concentration and sampling depth (r=-0.14; p-value=0.545 at p=<.01; df =19) was observed. The concentration of F- in groundwater largely depends on reaction times with aquifer minerals. Groundwater with long residence times in aquifers has high F- concentrations and these are associated with deep aquifer system and a slow groundwater movement. Accordingly, shallow aquifers which contain recently infiltrated rainwater usually have low F- concentrations. In arid/dry conditions groundwater flow is low and the reaction time of groundwater with the rock is long36 which creates more time for dissolution of fluoride bearing formations. But the higher concentration in the samples taken from shallow depths may be due to increased water levels as a result of evaporation.19
A weak positive non-significant relationship34 between F- and EC was obtained (r=0.23; p-value =0.3202 at p=<.01; df =19). In a range of specific conductivity between 750 and 1750 μS/cm, dissolution rate of fluorite minerals increases.37
Thus high concentration of fluoride is due to (i) its geo-genic origin (ii) high evaporation. Due to evaporation, the groundwater gets oversaturated with calcic minerals, resulting in precipitating of calcite, resulting in dissolution of fluorite.38
The study of groundwater quality with emphasis on F- concentration in southwest Punjab indicated that the high concentration of F- was substantiated by EC and various geochemical processes such as ion-exchange, dissolution and weathering. The groundwater in the area is saline and highly contaminated by F- and it was found more than 2/3rd part of the study area has higher concentration of fluoride (above permissible limit of WHO (2008)1 and BIS)3). Thus low rainfall coupled with high evaporation rate, highly variable diurnal temperatures, alkaline environment and long residence time favors dissolution of F- in groundwater.
The areas with increased water level in the southwest, Punjab are likely to get water logged in near future which can be seen in Fig. 5 and also reported by CGWB (2007)15 and Krishan and Chopra (2015).23 Due to this reason, there is an urgent need to arrest the rising water trend in southwestern part of the district and implement anti-water logging schemes. For controlling the deteriorating quality with respect to F- concentration in semi-arid region of Punjab, suitable management practices can be undertaken. Conjunctive use of surface and ground water needs to be done to overcome the water level and groundwater quality problems. For this, in the southern part of the district where excess surface water is used, the usage of groundwater is to be encouraged. The causes for F- contamination are mostly natural and inevitable, therefore, educating the people and de-fluorinating the groundwater before consumption are essential for maintaining a supply of healthy potable water.
Acknowledgement
The authors thank Director, National Institute of Hydrology, Roorkee for his constant support and encouragement for conducting this study. Thanks to Er. K.S. Takshi, Punjab Water Resources Organization, Chandigarh for his support.
References
- World Health Organization (WHO) (2008) Guidelines for drinking-water quality incorporating first addendum to Third Edition. Recommendations Geneva 1:595.
- Ravindra K, Garg VK (2007) Hydro-chemical survey of groundwater of Hisar city and assessment of defluoridation methods used in India. Environ Monit Assess 132:33-43.
CrossRef - Bureau of Indian Standards (BIS) (1991) Indian Standard Specification for Drinking Water IS 10500 pp. 2-4.
- World Health Organization (WHO) (1997) Guideline for drinking water quality. 2nd Vol. 2. Health criteria and other supporting information. Geneva: World Health Organization. pp 940 – 949.
- Handa BK (1975) Geochemistry and genesis of fluoride containing groundwater in India. Ground Water 13:275–281
CrossRef - Matthess G (1982). The properties of groundwater. Wiley & Sons, New York, 498.
- Msonda KWM, Masamba WRL, Fabiano E (2007) A study of fluoride groundwater occurrence in Nathenje, Lilongwe, Malawi. Phys and Chem Earth 32:1178–1184
CrossRef - Pickering WF (1985) The mobility of soluble fluoride in soil. Environ Pollut 9:281–308
CrossRef - Wenzel W, Blum WEH (1992) Fluoride speciation and mobility in fluoride contaminated soil and minerals. Soil Sci 153:357–364
CrossRef - Nordstrom DK, Ball JW, Donahoe RJ, Whittemore D (1989) Groundwater chemistry and water–rock interaction at Stripa. Geochim et Cosmochim Acta 53:1727–1740
CrossRef - Banks D, Reimann C, Røyset O, Skarphagen H, Sæther OM (1995) Natural concentrations of major and trace elements in some Norwegian bedrock groundwaters. Appl Geochem 10:1–16
CrossRef - Gizaw B (1996) The origin of high bicarbonate and fluoride concentration in waters of the main Ethiopian rift valley, East African rift system. J Afr Earth Sci 22:391–402
CrossRef - Sarma DRR, Rao SLN (1997) Fluoride concentrations in ground waters of Visakhapatnam, India. Bull Environ Contam Toxicol 58:241–247
CrossRef - Frengstad B, Banks D, Siewers U (2001) The chemistry of Norwegian groundwaters: IV. The dependence of element concentrations in crystalline bedrock groundwaters. Sci Tot Environ 277:101–117
CrossRef - CGWB (2007) Groundwater information booklet, Bathinda district, Punjab http://cgwb.gov.in/District_Profile/Punjab/Bathinda.pdf,CrossRef
- Chopra RPS, Krishan G (2014) Analysis of aquifer characteristics and groundwater quality in southwest Punjab, India. J Earth Sci Engineering. 4(10):597-604.
- Chopra RPS, Krishan G (2014) Assessment of groundwater quality in Punjab. J Earth Sci Clim Change. 5(10):243.
- Krishan G, Lohani AK, Rao MS, Kumar CP (2013) Optimization of groundwater monitoring network in Bist-Doab, Punjab. In: Proceedings of an International conference “India Water Week 2013-efficient water management: challenges and opportunities" (IWW-2013), 08-12 April 2013 at New Delhi, India,
- Krishan G, Rao MS, Kumar CP, Semwal P (2013) Identifying salinization using isotopes and ionchemistry in semi-arid region of Punjab, India. J Geol Geosci 2:4 http://dx.doi.org/10.4172/jgg.1000129
- Krishan G, Lapworth DJ, Rao MS, Kumar CP, Smilovic M, Semwal P (2014) Natural (baseline) groundwater quality in yhe bist-doab catchment, Punjab, India: A pilot study comparing shallow and deep aquifers. Int J Earth Sci Engi, 7 (01): 16-26.
- Krishan G, Lohani AK, Rao MS, Kumar CP (2014) Prioritization of groundwater monitoring sites using cross-correlation analysis. NDC-WWC J. 3 (1): 28-31.
- Krishan G, Rao MS, Lohani AK, Kumar CP, Takshi KS, Tuli NK, Loyal RS, Gill GS (2014) Assessment of groundwater level in southwest Punjab, India. Hydraulics, Water resources, Coastal & Environmental Engineering-Hydro 2014 (Editors: H.L. Tiwari, S. Suresh, R.K. Jaiswal) Excellent Publishing House, New Delhi. 23: 248-254.
- Krishan G, Chopra RPS (2015) Assessment of water logging in south western (SW) parts of Punjab, India-a case study from Muktsar district. NDC-WWC J. 4(1): 7-10.
- Krishan G, Rao MS, Loyal RS, Lohani AK, Tuli NK, Takshi KS, Kumar CP, Semwal P, Kumar S (2014) Groundwater level analyses of Punjab, India: A quantitative approach. Octa J Environ Res. 2(3): 221-226.
- Lapworth D, Krishan G, Rao MS, MacDonald A (2014) Intensive groundwater exploitation in the Punjab-an evaluation of resource and quality trends. Technical Report. NERC Open Research Archive, BGS-UK.
- Lapworth DJ, MacDonald AM, Krishan G, Rao MS, Gooddy DC, Darling WG. 2015. Groundwater recharge and age-depth profiles of intensively exploited groundwater resources in northwest India. Geophys. Res. Lett., 42 (18): 7554-7562.
CrossRef - MacDonald A, Bonsor H, Ahmed K, Burgess W, Basharat M, Calow R, Dixit A, Foster S, Krishan G, Lapworth DJ , Lark M, Moench M, Mukherjee A, Rao MS, Shamsudduha M, Smith L, Taylor R, Tucker J, Steenbergen F, Yadav S. 2016. Groundwater depletion and quality in the Indoâ€Gangetic Basin mapped from in situ observations. Nature Geosciences. 9:762-766.
CrossRef - Tripathi JK, Rajamani V (2003) Geochemistry of Proterozoic Delhi quartizites: Implications for provenance and source area weathering. J Geol Soc Ind 24: 215-226.
- Kochhar N (1989) High heat producing granites of the Malani igneous suite. Northern peninsular India. Ind. Minerals 43: 339-346.
- Dey RC (1991) Trans-Aravalli Vindhyan evaporates under the semi-desertic plains of western India-significance of depositional features. J Geol Soc Ind 77: 167-171
- Kochhar N, Dadwal V, Rishi M, Sharma NK, Balaram V (2012) Evaluation of chemical quality of groundwater in parts of Sirsa, Mansa, Bathinda and Muktsar districts, SW Punjab with emphasis on Uranium in relation to human health. In: Proceedings of 5th International groundwater conference (IGWC-2012) on the assessment and management of groundwater resources in hard rock systems with special reference to basaltic terrain, 611-626
- Singh G (1992) Quaternary geological studies in parts of Bathinda and Faridkot district, Punjab. Bull Ind Geol Assoc 25: 147-158.
- Salve PR, Maurya A, Kumbhare PS, Ramteke DS, Wate SR (2008) Assessment of groundwater quality with respect to fluoride. Bull Environ Contam Toxicol 81:289–293
CrossRef - Dancy C, Reidy J (2004) Statistics without maths for Psychology: using SPSS for windows, London, Prentice Hall.
- Chae GT, Yun ST, Mayer B, Kim KH, Kim SY, Kwon JS, Kim K, Koh YK (2007) Fluorine geochemistry in bedrock groundwater of South Korea. Sci Tot Environ 385: 272-283.
CrossRef - Vasak S, Brunt R, Griffioen J (2006) Mapping of hazardous substances in groundwater on a global scale. In: Appelo T (ed.) Arsenic in Groundwater – A World Problem. Proc. Seminar, Utrecht, 29 November 2003. Netherlands National Committee of the IAH Secretariat, Utrecht. 2006.
- Saxena VK, Ahmed S (2001) Dissolution of fluoride in groundwater: a water–rock interaction study. Environ Geol 40: 1084–1087.
CrossRef - Singh CK, Kumari R, Singh RP, Shashtri S, Kamal V, Mukherjee S (2011) Geochemical modelling of high fluoride concentration in groundwater of Pokhran area of Rajasthan, India, Bull Environ Contam Toxicol 86:152–158
CrossRef


