Climate Change Projection in Kashmir Valley (J and K)
Saqib Parvaze1 , Latief Ahmad2 , Sabah Parvaze2 and Raihana Habib Kanth2
1
Division of Agricultural Engineering,
Sher-e-Kashmir University of Agricultural Sciences and Technology of Kashmir,
Shalimar,
Jammu and Kashmir
India
2
Division of Agronomy,
Sher-e-Kashmir University of Agricultural Sciences and Technology of Kashmir,
Shalimar,
Jammu and Kashmir
India
http://dx.doi.org/10.12944/CWE.12.1.13
The decision support tool viz. SDSM (Statistical Downscaling Model) was used to downscale climate data of future years for Kashmir province of Jammu & Kashmir state. The 21st century projected data for the A1B scenario was adjusted by using observed climatic data recorded during the period 1985-2015 for the region. The data from the same period was taken as the baseline for the analysis. This data was thereon analyzed for monthly, seasonal, cropping season and annual periods to enumerate the variation of maximum temperature, minimum temperature and precipitation in Kashmir valley of Jammu & Kashmir state in the 21st century. The modelled data obtained exhibited no significant change in maximum and minimum temperature for the period 2021-2050 but for the same period increase in annual precipitation was exhibited. For the period2051-2100, decreasing trend of annual temperature was exhibited whereas for annual precipitation, an increasing trend was exhibited.
Copy the following to cite this article:
Parvaze S, Ahmad L, Parvaze S, Kanth R. H. Climate Change Projection in Kashmir Valley (JandK). Curr World Environ 2017;12(1). DOI:http://dx.doi.org/10.12944/CWE.12.1.13
Copy the following to cite this URL:
Parvaze S, Ahmad L, Parvaze S, Kanth R. H. Climate Change Projection in Kashmir Valley (JandK). Curr World Environ 2017;12(1). Available from: http://www.cwejournal.org/?p=16777
Download article (pdf)
Citation Manager
Publish History
Introduction
Throughout the previous century, rise in temperature and surge in CO2 concentration because of innumerable factors comprising alteration land usage pattern4 and greenhouse gas (GHG) emanations from agricultural and industrial zone,8 have caused variations in the earth’s climate. This surge in the GHG’s emanation is expected to impact the earth’s temperature, precipitation, pattern of storms and sea levels.3,1,6 The noticeable impacts of the variabilities in climate have been previously seen with regard to occurrence of extreme events like floods, drought, heat wave, cold wave, etc.5
Global temperatures have shown a warming up tendency of 0.87°C during 1880-2015 owing to rise in anthropogenic activities. A parallel warming up tendency of similar scale in annualsurface air temperatures has been also perceived in India during the period 1901-2015.2015 was observed to bethewarmest year during the period. High temperature for the period of monsoon (+0.72°C above average)and for the post monsoon period (+1.1°C aboveaverage) was the main contributor to the high annual temperature.7
The state of Jammu and Kashmir has also been presumed to suffer the consequences of global climate change. The state is expected to have a surge in the number of rainy days by 2030. Similarly, annual temperature is likely to increase in the next century compared to the base period of 197010 An increasing trend in annual maximum and minimum temperature as well as precipitation has also been predicted for the region under SRES A2 Scenario.9
In this study, the decision support tool viz. SDSM (Statistical Downscaling Model) was used to downscale climate data of future years from the SRES A1B scenario for Kashmir province of Jammu & Kashmir state.The A1B scenario characterizes an up and coming world of exceptionally expedient economic advance, low populace development, and the quick establishment of novel and more proficient innovations, with an adjusted accentuation on all energy sources. Major topics are convergence among locales, capacitycreation, and expanded social and cultural associations, with a significant decrease in territorial variations in per capita income.
Study Area
The Kashmir valley is the principal valley among the numerous valleys located in the state of Jammu and Kashmir. The valley is surrounded by the Pir Panjal Range on the southwest side and the Himalayan range on the northeast. The valley covers an area of about 15,948 sq. km. and has analtitude of about 1730 m above msl. Climate in the valley is moderate due to its geographic location. The normal annual precipitation in the valley 823.9 mm and the normal annual maximum and minimum temperatures are 19.6 ºC and 6.8 ºC respectively. The valley has been witnessing an increased annual precipitation and relative humidity in the past few years.
The species diversity, habitats, forests, wildlife, fisheries and the water resources of the valley face a severe threat from climate change. Wetlands that support 20% of the known biodiversity of the region will face adverse effects due to climate change. Change in climate is expected to affect some horticultural crops. Climate change is also expected to considerably influence the agricultural sector and increase its vulnerability. Reduction in precipitation, will affect the rain-fed agriculture as well as horticultural crops like apple leading to reduction in production.
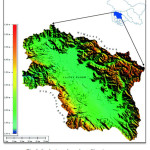 | Figure 1: Study Area through satellite view Click here to View figure |
Materials and Methods
Observed climatic data comprising of maximum temperature, minimum temperature and precipitation for the reference period 1985-2015 and predicted climatic data (2021-2100) form the SRES A1B scenario for the study area were downscaled using SDSM (Statistical Downscaling Model). The SDSM predictors were downloaded for the study area from the Canadian Climate Impacts Scenarios Group (CCISC).
Once downscaling finished, the correction factor was calculated from the daily modelled data and observed climatic data for the same period i.e. 1985-2015. The calculated correction factor was further applied to the modelled data for the period 2021-2100 to correct it.This corrected modelled climatic data was the studied on monthly, seasonal, cropping season and yearly basis to measure the variations in maximum temperature, minimum temperature and precipitation as compared to reference period.
Results and Discussions
The variations of maximum temperature, minimum temperature and rainfall from the baseline period during the periods 2021-2050, 2051-2075 and 2076-2100 under the A1B scenario as predicted by the SDSM model in Kashmir valley are discussed below:
Change Anomalies in Maximum Temperature
The predictions point towards the fact that annual maximum temperature will increase by 0.1 ºC for the period 2021-2050 which is not quite significant. For the period 2051-2100, an overall decreasing trendin the annual maximum temperature will be observed with the annual maximum temperature plunging by 3ºC and 3.5 ºC during 2051-2075 and 2076-2100 respectively. The maximum temperature will decrease by about 0.9 ºC during Kharif (2021-2050). However, for the same period, the maximum temperature for Rabi season will surge by 1.3 ºC. For the period, 2051-2100, maximum temperature will increase during both Kharif and Rabi season. The deviations in monthly, seasonal, cropping season and annual maximum temperature with respect to the baseline period 1985-2015 for 2021-2050, 2051-2075 and 2076-2100 are represented in Fig. 2-5. 0ºC on the X-axis represents the maximum temperature of the baseline period (1985-2015).
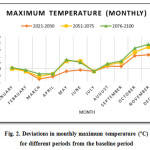 | Figure 2: Deviations in monthly maximum temperature (ºC)for different periods from the baseline period Click here to View figure |
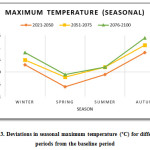 | Figure 3. Deviations in seasonal maximum temperature (ºC) for different periods from the baseline period Click here to View figure |
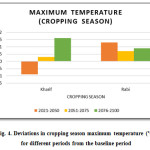 | Figure 4: Deviations in cropping season maximum temperature (ºC) for different periods from the baseline period Click here to View figure |
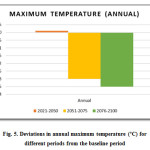 | Figure 5: Deviations in annual maximum temperature (ºC) for different periods from the baseline period Click here to View figure |
Change Anomalies in Minimum Temperature
The predictions point towards the fact that annual minimum temperature will not vary for the period 2021-2050. For the period 2051-2100, an overall decreasing trend in the annual minimum temperature will be observed with the annual minimum temperature plunging by 1ºC and 1.2ºC during 2051-2075 and 2076-2100 respectively. The minimum temperature will increase by about 0.1ºC during both Rabi and Kharif (2021-2050). For the period, 2051-2100, minimum temperature will increase during both Kharif and Rabi season. The deviations in monthly, seasonal, cropping season and annual minimum temperature with respect to the baseline period 1985-2015 for 2021-2050, 2051-2075 and 2076-2100 are represented in Fig. 2-5. 0ºC on the X-axis represents the minimum temperature of the baseline period (1985-2015).
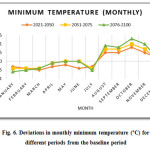 | Figure 6: Deviations in monthly minimum temperature (ºC) for different periods from the baseline period Click here to View figure |
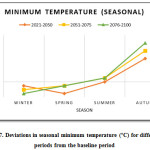 | Figure 7: Deviations in seasonal minimum temperature (ºC) for different periods from the baseline period Click here to View figure |
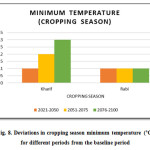 | Figure 8: Deviations in cropping season minimum temperature (ºC) for different periods from the baseline period Click here to View figure |
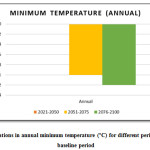 | Figure 9: Deviations in annual minimum temperature (ºC) for different periods from the baseline period Click here to View figure |
Change Anomalies in Precipitation
The predictions point towards the fact that annual precipitation will increase by 35.2mm during the period 2021-2050. For the period 2051-2100, increasing trendin the annual precipitation will be observed with the annual precipitation increasing by 38.7mm and 32.5mm during 2051-2075 and 2076-2100 respectively. The precipitation will increase by about 17.7mm during both Kharif and 45.3mm duringRabi (2021-2050). For the period, 2051-2100, there precipitation varies significantly during both Kharif and Rabi season. The deviations in monthly, seasonal, cropping season and annual period with respect to the baseline period 1985-2015 for 2021-2050, 2051-2075 and 2076-2100 are represented in Fig. 2-5. 0ºC on the X-axis represents the precipitation of the baseline period (1985-2015).
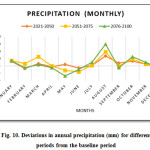 | Figure 10: Deviations in annual precipitation (mm) for different periods from the baseline period Click here to View figure |
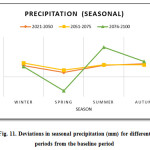 | Figure 11: Deviations in seasonal precipitation (mm) for different periods from the baseline period Click here to View figure |
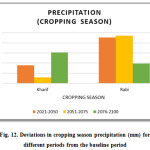 | Figure 12: Deviations in cropping season precipitation (mm) for different periods from the baseline period Click here to View figure |
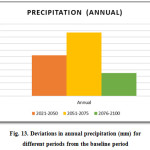 | Figure 13: Deviations in annual precipitation (mm) for different periods from the baseline period Click here to View figure |
The climate of Kashmir Valley has witnessed a different change in climate and climatological variables as compared to the other parts of India. During last few decades the maximum and minimum temperatures of the region have shown no significant increasing or decreasing trends. The amount of rainfall has however shown an increase in quantity during this period.2 The results obtained from the present study are therefore in agreement with the current conditions prevailing in the valley.
Conclusions
The results obtained from SDSM (Statistical Downscaling Model) of A1B scenario indicates that the maximum and minimum temperature would decrease towards the end of 21st century while as precipitation would increase but with an uneven distribution with respect to baseline period of 1985-2015. Furthermore, the changes in maximum and minimum temperature during 2021-2050 would not be significant whereas precipitation variation would be quite significant. Correspondingly, for the period between 2051-2100, the change in all these three parameters would be quite significant.
Acknowledgment
We would like to thank AgriMet. field Unit, Srinagar, Division of Agronomy, SKUAST-K for providing us with the data required for the study and their valuable guidance and advice. They inspired us greatly to work in the research. Their willingness to motivate us contributed tremendously to our research. The source of finance for the research is mutual contribution by the authors without any external support.
References
- Dash, S.K. and Hunt, J.C.R., Variability of climate change in India. Current Science, 93(6): 782-788 (2007).
- Department, Agriculture Production. "Overview of Jammu and Kashmir." Jammu and Kashmir Agriculture Production Department. Jammu and Kashmir Agriculture Production Department, 12 June 2015. Web. 12 Dec. 2016.
- IPCC, Impacts, adaptation and vulnerability. Contribution of working group II to the fourth assessment report of the Intergovernmental Panel on Climate Change (2007).
- Islam, A. and Sikka, A.K., Climate Change and Water Resources in India: Impact Assessment and Adaptation Strategies. In Natural and Anthropogenic Disasters: 386-412 (2010).
- Meehl, G.A., Stocker, T.F., Collins, W.D., Friedlingstein, P., Gaye, A.T., Gregory, J.M., Kitoh, A., Knutti, R., Murphy, J.M., Noda, A. and Raper, S.C.B., Global Climate Projections. In ‘Climate Change 2007: The Physical Science Basis. Contribution of Working Group I to the Fourth Assessment Report of the Intergovernmental Panel on Climate Change’.(Eds S Solomon, D Qin, M Manning, Z Chen, M Marquis, KB Averyt, M Tignor, HL Miller) : 747–845 (2007).
- Rajendra, K. and Kitoh, A., Indian summer monsoon in future climate projection by a super high resolution global model. Current Science, 95(11): 1560-1569 (2008).
- Rohini, P., Rajeevan, M. and Srivastava, A.K., On the Variability and Increasing Trends of Heat Waves over India. Scientific reports, 6 (2016).
CrossRef - Rosenzweig, C. and Hillel, D.,Climate change and the global harvest (1998).
- Parvaze, S., Parvaze, S., Haroon, S., Khurshid, N.,Khan, J. N. and Ahmad, Latief (2016) Projected Change in Climate Under A2 Scenario in Dal Lake Catchment Area of Srinagar City in Jammu and Kashmir. Current World Environment, 11(2), 429-438.
​​​​​​​CrossRef - Sharma, S.K. and Chauhan, R., Climate change research initiative: Indian network for climate change assessment. Current Science(Bangalore), 101(3): 308-311 (2011).


