Ecological Studies of Barwala Link Canal in Narwana Region, Haryana
Anil K. Tyor1 * and Parmila Devi1
http://dx.doi.org/10.12944/CWE.12.1.14
The present paper deals with the monthly variations in physico-chemical characteristics and planktonic diversity of Barwala Link Canal which link the Bhakra Main Canal with Sirsa Branch of Western Yamuna Canal in Narwana Region, Haryana. Surface water samples were collected on monthly basis and analyzed for physico-chemical parameters (water temperature, total dissolved solids, electrical conductivity, turbidity, pH, dissolved oxygen, free CO2, alkalinity, hardness, chlorides, biochemical oxygen demand, o-phosphate, nitrate and ammonia). An attempt was also made to assess the biological parameters including population density, their abundance and species diversity index of plankton life which were used as a measure of water quality. Phytoplankton was abundant as compared to Zooplankton. A total of 14 taxa of phytoplankton were recorded of which 9 taxa of Chlorophyceae and 5 taxa of Bacillariophyceae. 8 taxa of zooplankton were recorded of which 4 taxa of protozoa, 3 taxa of rotifera and one taxa of insecta. Shannon diversity index of phytoplankton ranges from 2.47 to 3.29 and Zooplankton ranges from 2.60 to 2.99. It is revealed that the quality of canal water is good throughout study period as estimated by the weighted arithmetic index method.
Copy the following to cite this article:
Tyor A. K, Devi P. Ecological Studies of Barwala Link Canal in Narwana Region, Haryana. Curr World Environ 2017;12(1). DOI:http://dx.doi.org/10.12944/CWE.12.1.14
Copy the following to cite this URL:
Tyor A. K, Devi P. Ecological Studies of Barwala Link Canal in Narwana Region, Haryana. Curr World Environ 2017;12(1). Available from: http://www.cwejournal.org?p=993/
Download article (pdf) Citation Manager Publish History
Introduction
Haryana is the northwest state of India and located between 27º39’ to 30º35’N latitude and between 74º28’ to 77º36’E longitude. It’s climate is arid to semiarid with average rainfall of 354.4 mm. Around 29% rainfall is received during the monsoon season (July to September) and remaining is received during winter season (December to February). To cultivate the land, irrigation depends upon the canals. The two main canals which are operating in the state include Bhakra canal and Western Yamuna canal. The supplies in Western Yamuna canal fluctuate with variations in flow of river Yamuna. All the distributaries could not be fed all together; hence, all the distributaries are fed on rotational basis. In 1972, feeder canal, Barwala link canal was constructed to supply water from Bhakra Main Line into Sirsa branch of Western Yamuna Canal.
Ecology of lotic waters is characterised by a range of hydrological parameters, source of water, substrate, and availability of nutrients and by their associated organisms.1 Physical habitat structure (depth, current velocity and substrate) influence species composition and species diversity in correlation with habitat diversity.2 There are two methods for the measurement of water quality deterioration in lotic systems.3 The first method involves the measurement of physico-chemical parameters of lotic systems in to gain some insight into their water quality. In many of the cases, this method allows only immediate measurements which restrict the knowledge of water conditions during the measurements period. The second method involves use of biological methods (biological monitoring), which provide a direct measurement of ecological integrity by using the response of biota to environmental changes. Keeping in view of above, present investigations have been undertaken to assess the water quality of Barwala Link Canal. It originates from Khanauri head (Sangrur district, Punjab) on Bhakra Main Line and joined with Sirsa branch of Western Yamuna Canal in Narwana region.
Materials and Methods
Study site is located in Narwana region on Barwala link canal (Longitude 29º61’N and latitude 76 º15’E). The dimensions of canal at site are top width-25m, and height-20.97 ft with slope of 1.50:1. Bottom width of this canal is zero because of their bowl shape. Surface water samples for the present investigation were collected in polythene bottles. Physicochemical parameters like temperature, depth, width, water current, pH, fixation of dissolved oxygen were determined on the spot, whereas, other parameters were analysed in the laboratory according to standard procedures4,5 within 3 to 4 days, during which samples were kept in cold storage. The weighted arithmetic index method6 has been used for the calculation of Water Quality Index.
For plankton study, the water samples were collected with the help of conical plankton net fitted with a wide mouthed bottle. 100 litres of canal water was filtered through the net. Plankton was preserved in 4% formaldehyde solution. The organisms were sorted out manually for qualitative and quantitative study and standard references7-9 were consulted for the identification of plankton. Population density was calculated from the concentrated sample following drop method and biodiversity indices were calculated Shannon and weaver diversity index,10 Simpson Diversity Index11 and Pielou’s evenness index12 Correlation between various recorded parameters was calculated by Karl Pearson correlation coefficient.
 |
|
Results
Physico-chemical characteristics of water
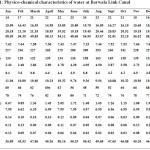
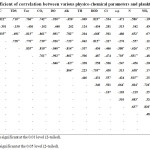
Monthly fluctuations in the physico-chemical characteristics of canal water have been given Table 1. The value of temperature during the present investigation ranged from 14.0ºC-24.0ºC with maximum values in July and minimum in January. Depth and width values recorded high during March and lower during the month of April. Maximum water current (58.59 cm sec-1) was recorded in January and minimum (48.60 cm sec-1) in April. The pH values were in the range of 7.25-7.66 throughout the year. The DO values were more than 8 mg L- 1 (9.36-11.04mgL-1) throughout the study period indicating the healthy nature of canal water. The maximum values of free CO2 (5.8mg L-1), total hardness (85 mg L-1), total alkalinity (68 mg L-1), BOD (1.25 mg L-1) and chloride (9.94mg L-1) were recorded in summer months, whereas the values of electrical conductivity (293 µScm-1), total dissolved solids (163 mg L-1) and turbidity (4.95NTU) were maximum in rainy months. TDS showed significant positive correlation with temperature (r=0.710,p<0.05), conductivity (r=0.728, p<0.05), turbidity (r=0.855, p<0.05), free CO2 (r=0.810, p<0.05)and magnesium (r=0.874, p<0.05) and significantly negative correlated with pH (r= -0.691,p<0.01), DO (r= -0.840, p<0.05), alkalinity (r= -0.814, p<0.05), o-phosphate (r= -0.580, p<0.01), and nitrate (r= -0.626, p<0.01) (Table 2). The concentration of o-phosphate, nitrate and ammonia in canal was recorded high during April-May and low during July-August. The values of Water Quality Index ranged from 36.89 to 50.42 and water quality status was good and safe for human consumption throughout the study period (Table 1).
 |
|
Biological Characteristics
Phytoplankton
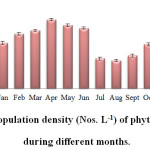
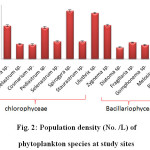
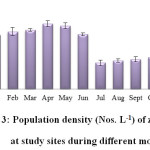
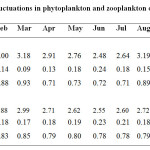
During present study, a total of 14 taxa of phytoplankton were recorded of which 9 taxa (64.28%) belonged to Chlorophyceae, followed by 5 taxa (35.71%) of Bacillariophyceae (Fig. 2). Mean values of Shannon-Weaver diversity index in different months fluctuated from 2.47 to 3.29 (Table 3) and high diversity was recorded during September and October. Simpson’s diversity index ranged from 0.11 to 0.23 revealed maximum species dominance in the month of June and minimum in October. Equitability index ranged from 0.71 to 0.93 which shows variation in species distribution (Table 3). Maximum density of phytoplankton (495±5.31L-1) was recorded during April and minimum (203±8.49 L-1) during August (Fig. 1). Spirogyra sp. was found to be dominant followed by Ulothrix sp., Zygnema sp. and Cladophora sp.. Species like Diatoma sp., Fragillaria sp., Gomphonema sp., Melosera sp., Pinnularia sp. and Staurastrum sp. were found relatively in less number (Fig. 2).
 |
|
Zooplankton
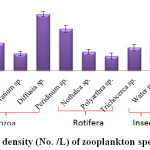
They are heterotrophic planktonic animals floating in water. The findings of zooplankton community residing in fresh water have significant potential for assessing aquatic ecosystem health. Zooplankton comprised a minor portion of total plankton. A total of 8 taxa of zooplankton were recorded of which 4 taxa (50%) belonged to protozoa, followed by 3 taxa (37.5%) of rotifera and one taxa (12.5%) of insecta. Maximum density of zooplankton (94±2.38 L-1) was observed in the month of April and minimum (38±2.09 L-1) in the month of July (Fig. 3). Dominant taxa were Diffusia sp. and Peridinum sp. of family Protozoa and water mite of family Insecta (Fig. 4). Zooplankton density show significant negative correlation with water current, TDS, turbidity and electrical conductivity (Table 3).
 |
|
**Correlation is significant at the 0.01 level (2-tailed).
*Correlation is significant at the 0.05 level (2-tailed).
(Dpt=Depth, Wdt=Width, WC=Water Current, EC=Electrical Conductivity, TDS=total dissolved solids, Tur.=Turbidity, CO2=free CO2, DO=dissolved oxygen, Alk=Alkalinity, T.H.=Total hardness, Ca=Calcium hardness, Mg= Magnesium hardness, BOD=Biochemical oxygen demand, Cl= Chloride, o-p=ortho-phosphate, N=Nitrate, NH4=Ammonia, Ppkt.=Phytoplankton, Zpkt.=Zooplankton)
 |
|
 |
|
Shannon-Weaver diversity index ranged from 2.60 in July to 2.99 in March which indicated that this site had great diversity throughout the study period (Table 3). Simpson’s diversity index ranged from 0.16 in September to 0.23 in June. Equitability index in different months varied from 0.75 to 0.85 which show small variations in species distribution (Table 3).
 |
|
Discussion
All physico-chemical parameters were within the limits as prescribed by WHO.13 Water quality status was good and safe for human consumption at study site. Jindal and Sharma14 have found water quality in the range of good at Ropar Head Works on Sutlej River, Punjab. Thus Bhakra canal receive clean and relatively unpolluted water from its source.
During the whole study period, Phytoplankton was abundant as compared to Zooplankton which goes in concurrence with the findings of many workers15-17 Their abundance in summer was because of higher values of temperature, hardness and nutrients; moderate values of water current, turbidity and alkaline pH.18 Minimum number of plankton during July-August could be attributed to cloudy weather, high values of turbidity, fast current of water and dilution in the concentration of some salts. Dominance of green algal flora indicated unpolluted nature of the site which was also supported by other workers.19-21
Statically, significant negative correlation between phytoplankton density and water current (r= -0.935, p<0.05), TDS (r= -0.824, p<0.05) and turbidity (r= -0.923, p<0.05) was observed. However correlation between phytoplankton density and DO (r=0.707, p<0.01), hardness (r=0.881, p<0.05) and alkanity (r=0.608, p<0.01) was significantly positive.22,23 also reported negative correlation between volume of plankton and water current. The current of fast water not only results in high turbidity and high TDS but also causes the mechanical damage to the plankton which resulting the destruction of plankton by churning.24 Shannon-Weaver diversity index values showed a decline in diversity from April-May to July-August and then progressively increased in the month of October-November. The maximum density and diversity of plankton in winter was due to relatively less values of temperature and turbidity; moderate values of nutrients; and higher values of dissolved oxygen.
Total phytoplankton density was positively correlated with total zooplankton density. Zooplankton peaks either coincided or followed the peaks of phytoplankton17 but highly significant (p<0.001) inverse correlation between relative abundance of phytoplankton and Zooplankton was observed.25
Conclusion
It could be concluded from present findings that the water in Barwala link canal is of good quality and safe for human consumption throughout the study period. Biological analysis revealed that plankton density as well as diversity recorded high during summer and postmonsoon season and lower during monsoon season and values of species diversity indices also indicate unpolluted nature of water.
References
- Mathews, W.J. Patterns in freshwater fish Ecology. Chapman and Hall, International Thomson Publishing Company, U.S.A. pp 731 (1998)
CrossRef - Schlosser, I.J. Fish community structure and function along two habitat gradients in headwater streams. Monogr., 52: 395-414 (1982)
CrossRef - Karr,R. Biological integrity: a long-neglected aspect of water resource management. Ecol. Appl., 1(1): 66-84 (1991)
CrossRef - A.P.H.A. Standard methods for the examination of water and waste water. American Public Health Association, Washington, pp: 1193 (1998)
- Garg, S.K., Bhatnagar, A., Kalla and Johal, M.S. Experiment ichthyology 1st CBS publishers and distributors, New Delhi. (2002)
- Brown, R.M., McCleiland, N.J., Deininger, R.A. and O’Connor, M.F. Water quality index - crossing the physical barrier, (Jenkis, S.H., ed.) Proc . Int. Conf. on Water Poll. Res., Jerusalem, 6: 787-797 (1972)
- Ward, G.B. and Whipple, G.C. Freshwater Biology, John Willey and Sons, New York, pp 1248 (1959)
- Needham, J.E. and Needham, P.R. A guide to the study of fresh water biology. Holden Day Inc. San Francisco, California (1972)
- Kumar, H.D. and Singh, H.N. A textbook of Algae, Ed. 4th, Affliated East West Press Pvt Ltd. New Delhi. pp 82 (1995)
- Shannon, C.E. and Weaver, W. The mathematical theory of communication, University of Illinois, Press, Urbana, pp117 (1963)
- Simpson, G.H. Measurement of diversity. Nature, 163: 688 (1949)
CrossRef - Pielou, E.C. The measurement of diversity in different types of biological collections. Theor. Biol., 13: 131-144 (1966)
CrossRef - W.H.O. International standards for drinking water, Geneva: World Health Organization (2001)
- Jindal, and Sharma, C. Studies on water quality of Sutlej river around Ludhiana with reference to physico-chemical parameters. Environ. Moni. Assess., 174 : 417-425 (2011)
CrossRef - Jindal, and Rumana, H.S. Biomonitoring of water pollution in Western Yamuna Canal at Yamunanagar, Haryana. J. P. A. S., 2(1): 177-182 (2000)
- Chughtai, M.I., Mahmood, K. and Awan, A.R. Assessment of planktonic diversity in river Chenab as affected by sewage of Multan city. J. Bot., 43(5): 2551-2555 (2011)
- Sharma, C., Jindal, R., Singh, U.B., Ahluwalia, A.S. and Thakur, R.K. Population dynamics and species diversity of plankton in relation to hydrobiological characteristics of river Sutlej, Punjab, India. Env. & Cons., 19 (3): 717-724 (2013)
- Saravanakumar, A., Rajkumar, M., Thivakaran, G.A. and Serebiah, J.S. Abundance and seasonal variations of phytoplankton in the creek waters of western mangrove of Kachchh-Gujarat. Environ. Biol., 29: 271-274 (2008)
- More, Y.S. and Nandan, S.N. Hydrobiological study of algae of Panzara river (Maharashtra). Ecol Environ. Cons., 6: 99-103 (2000)
- Nandan, S.N. and Aher, N.H. Algal community used for assessment of water quality of Haranbaree dam and Mosam river of Maharashtra. Environ. Biol., 26: 223-227 (2005)
- Tas, B. and Arif, G. An ecologic and taxonomic study on phytoplankton of a shallow lake, J. Environ. Biol., 28: 439-445 (2007)
- Arhonditsis, G. B., Stow, C.A., Paerl, H.W., Valdes-Weaver, L.M., Steinberg, L.J. and Reckhow, K.H. Delineation of the role of nutrient dynamics and hydrologic forcing on phytoplankton patterns along a freshwater-marine continuum. Model., 208: 230-246 (2007)
CrossRef - Bertrand, C., Siauve, V., Fayolle, S. and Cazaubon, A. Effects of hydrological regime on the drift algae in a regulated Mediterranean river (River Verdon, southeastern France). Regulated Rivers Research and Management,17:407-416 (2001)
CrossRef - Bishnoi, R.K., Sharma, B.K., Durve, V.S. and Sharma, L.L. Primary productivity in relation to planktonic biodiversity in a stretch of Gang Canal (Rajasthan). Universal J. Environ. Res. Tech., 3(2): 266-272 (2013)
- Chughtai, M.I., Kausar, T., Mahmood, K. , Naeem, M. and Awan, A.R. Studies on limnological characteristics and planktonic diversity of D.G. Khan Canal water at D.G. Khan, Pakistan. Pak. J. Bot., 45(2): 599-604 (2013)


