ICP-MS Determination of Trace Metals in Drinking Water Sources in Jazan Area, Saudi Arabia
Mohamed Albratty1 , Ismail Adam Arbab1,2 , Hassan Ahmad Alhazmi1 , Ibraheem M. Attafi3 and Abdul Jabbar Al-Rajab4 *
http://dx.doi.org/10.12944/CWE.12.1.02
Requisite reference facts about essential elements in treated and plastic bottled drinking water is usually mentioned on the products. However, more information is sometime crucial regarding trace elements in treated, bottled and other sources of drinking water such as tap water to evaluate their quality. This study is aimed to evaluate drinking water quality in the main governorates (Jazan, Sabya and Abu Arish) of Jazan province located in the South-Western region of Kingdom of Saudi Arabia. This is the first such study carried out in Jazan city so that the research team can come out with valuable recommendations in the issue. The research team has collected a sum of 68 water samples from different sources comprising hospitals (treated tap water), stations for drinking water treatment (large blue bottles of drinking water) and bottled drinking water (purchased from local markets). Using inductively coupled plasma-mass spectrometry (ICP-MS), the concentrations of 20 elements were determined. The physiochemical parameters of water samples were measured. All parameters were within the recommended limits of the World Health Organization (WHO, 2011) and Gulf Cooperation Council Standardization Organization (GSO, 2008). Trace and major elements were found to be below the standard guideline values , except for uranium in some tap water samples. This preliminary study will significantly improve the awareness and knowledge among the society about the drinking water quality in Jazan area.
Copy the following to cite this article:
Albratty M, Arbab I. A, Alhazmi H. A, Attafi I. M, Al-Rajab A. J. ICP-MS Determination of Trace Metals in Drinking Water Sources in Jazan Area, Saudi Arabia. Curr World Environ 2017;12(1). DOI:http://dx.doi.org/10.12944/CWE.12.1.02
Copy the following to cite this URL:
Albratty M, Arbab I. A, Alhazmi H. A, Attafi I. M, Al-Rajab A. J. ICP-MS Determination of Trace Metals in Drinking Water Sources in Jazan Area, Saudi Arabia. Curr World Environ 2017;12(1). Available from: http://www.cwejournal.org/?p=16826
Download article (pdf) Citation Manager Publish History
Introduction
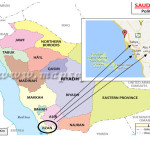
Pure drinking water is one of the basic needs for every human being in the world. For a large portion of the African and Asian populations, safe drinking water is not effectively accessible.1 Out of the 7 billion individuals on earth, more than one billion and half need to get pure and safe drinking water and around 2.7 billion do not have admittance to satisfactory sanitation administrations.2-3 Notwithstanding these deficiencies, different sorts of waterborne illnesses execute more than 6 million kids every year i.e. around 20,000 kids a day.4-5 Water covers 70 percent of the globe's surface, mostly saltwater. Freshwater covers only 3 percent of the world's surface and quite a bit of it falsehoods solidified in the Antarctic and Greenland polar ice.5 New water that is accessible for human utilization originates from waterways, lakes and subsurface aquifers. These sources represent just a single percent of total water on the earth. Six billion individuals rely on the supply water and a noteworthy segment of the total populace is confronting water deficiencies (Fig.1).5
Groundwater represents the main source of drinking water in Saudi Arabia.6-7 The quality of water is of scientific as well as public concerns, till now no serious issue in drinking water quality has been reported in the country.8 Many resources of chemical and microbial contaminations of groundwater including wastewater, pesticides, fertilizers, and industrial wastes have been reported.9-10
In the recent years, there was a considerable increase in the consumption of bottled drinking water. This means that systematic and regular independent tests on the quality of bottled drinking water must be applied, and different organizations worldwide set standards for bottled drinking water.11-12
The consumption of bottled drinking water has considerably been increased from last few years. This means that, there is an enormous requirement of systematic and regular independent tests for its quality. Different regulatory organizations worldwide have set the quality standards for bottled drinking water.
Jazan is located in the South-Western part of the Saudi Arabian Peninsula [16°53’21”N 42°33’40”E], and it is considered the second smallest province which comes after Al Bahah region of the kingdom in terms of area considerations. Jazan spreads over 300 km along the southern coast of the Red Sea directly north of Yemen. A total of 11,671 km² is the representative area of Jazan province with total population of 1,365,110 according to the 2010 census. Jazan city itself is the capital of the province with its 14 governorates, table 1.13
In this area, the drinking water is mainly provided either as bottled water of various capacities ready to use, or filled after treatment in plastic containers (20L or larger). However, the information about the concentrations of heavy metals in the drinking water supplied to Jazan area is inadequate. The aim of this study was to evaluate the levels of essential and toxic elements, and evaluate the physicochemical properties of drinking water from different available sources. To the best of our knowledge, this is the first scientific effort for determination of heavy metal contents in drinking water from all types of resources in Jazan area.
Materials and Methods
Water Sample Collection
Three types of drinking water samples were collected: bottled, filled treated and tap water. The samples of all the three types of water sources were collected during August-September 2016. A total of 68 samples were collected including; (I) tap water samples (n = 12) from 4 different hospitals in the Jazan province, (II) treated (filtered and ozonized) drinking groundwater (n = 17), and (III) bottled drinking water (n = 39) of different brand available in the market. After collection the samples were directly transported to the laboratory and stored in their original package at 4oC till analysis.
Analytical Methods
The physiochemical parameters such as EC (full form) and pH were measured using a Bluelab combo meter (Tauranga, New Zealand) in the laboratory of Pharmaceutical Analytical Chemistry, Faculty of Pharmacy, Jazan University.
Major and trace elements (beryllium Be, magnesium Mg, calcium Ca, aluminum Al, titanium Ti, chromium Cr, manganese Mn, cobalt Co, nickel Ni, copper Cu, zinc Zn, arsenic As, rubidium Rb, strontium Sr, cadmium Cd, cesium Cs, barium Ba, lead Pb, and uranium U) were measured by inductively coupled plasma-mass spectrometry ICP-MS (X-SeriesII; Thermo-Fisher Scientific Inc., Waltham, MA, USA) equipped with an autosampler (Cetac ASX-520 with 4 × 60 place sample racks). The operation condition of ICP-MS is summarized in table 2.
Table 1: The region of Jazan province is sub-divided into 14 governorates and the main four of these governorates are listed here with necessary data
|
S. No. |
Name |
Census15 September 2004 |
Census (Preliminary)28 April 2010 |
|
1 |
123,943 |
197,112 |
|
|
2 |
255,340 |
157,536 |
|
|
3 |
198,086 |
228,375 |
|
|
4 |
128,447 |
201,656 |
Table 2: Operation conditions of ICP-MS
|
Parameter/unit |
Setting |
|
|
RF power (W) |
1500 |
|
|
RF Matching (V) |
1.7 |
|
|
Carrier gas (L/min) |
0.90 |
|
|
Makeup Gas (L/min) |
0.27 |
|
|
Sampling depth (mm) |
8 |
|
|
S/C temp (ºC) |
2 |
|
|
Nebulizer pump (rps) |
0.1 |
|
|
Torch-horizontal (mm) |
1.2 |
|
|
Torch-vertical (mm) |
1.4 |
|
|
Extract 1 (V) |
4.3 |
|
|
Extract 2 (V) |
-99 |
|
|
Omega Bias-ce (V) |
-16 |
|
|
Omega Lens-ce (V) |
2.6 |
|
|
Cell Entrance (V) |
-26 |
|
|
Cell Exit (V) |
-20 |
|
|
Channel spacing |
0.02 |
|
|
QP Focus (V) |
5 |
|
Results and Discussion
Table 3 summarizes the recommended values of heavy metals and physico-chemical properties of the drinking water. In the tables (4-13) the levels of all tested parameters are presented for the samples from all types of water resources.
Table 3: Regulatory limits of different parameters and trace elements levels in the treated and bottled drinking water [17].
|
Organization |
WHO [14] |
USEPA [18] |
GSO [19] |
SASO [20] |
|
|
Parameter |
Unit |
Guideline value |
Guideline value |
Guideline value |
Guideline value |
|
pH |
6.5–9.5 |
6.5–8.5 |
– |
6.5–8.5 |
|
|
EC |
µS/cm |
– |
– |
– |
800–2,300 |
|
TH |
mg/L |
500 |
– |
– |
500 |
|
TDS |
mg/L |
1,000 |
500 |
– |
1,500 |
|
Li |
µg/L |
|
|||
|
Be |
µg/L |
- |
- |
- |
- |
|
Mg |
mg/L |
– |
– |
– |
30–150 |
|
Ca |
mg/L |
– |
– |
– |
200 |
|
Al |
µg/L |
200 |
50–200 |
– |
– |
|
Ti |
µg/L |
– |
– |
– |
– |
|
Cr |
µg/L |
50 |
100 |
50 |
– |
|
Mn |
µg/L |
400 |
50 |
400 |
50 |
|
Co |
µg/L |
– |
– |
– |
– |
|
Ni |
µg/L |
70 |
– |
70 |
– |
|
Cu |
µg/L |
2,000 |
1,300 |
1,000 |
– |
|
Zn |
µg/L |
3,000 |
5,000 |
– |
– |
|
As |
µg/l |
10 |
10 |
10 |
– |
|
Rb |
µg/L |
– |
– |
– |
– |
|
Sr |
µg/L |
– |
4.2 mg/L |
– |
– |
|
Cd |
µg/L |
3 |
5 |
3 |
– |
|
Cs |
µg/L |
– |
– |
– |
– |
|
Ba |
µg/L |
700 |
2,000 |
700 |
– |
|
Pb |
µg/L |
10 |
15 |
10 |
– |
|
U |
µg/L |
15 |
30 |
15 |
– |
Physico-chemical Properties
To know the different physico-chemical parameters of drinking water is very essential for the safety of human beings. The average pH values were compared for all the samples within a type of water and also for the samples of the different types. It was found that the tap water samples and collected from stations have recorded comparatively higher pH values than those of bottled drinking water samples (Tables 4, 5, and 10). Within the tap water from hospitals, the sample from Abu Arish Public Hospital showed the highest pH (7.86). The overall variation may be due to the presence of the materials that coagulate and which utilized for purification of water.
Overlapping in the pH values was observed between the range of pH of treated samples from stations of drinking water and those of bottled drinking water. Still the range is within the permissible limit of WHO and other national and international organizations regulating the water quality and related health issues14. This permissibility is not excluding the tap water samples from hospitals. In general, the pH values of water samples in this study were found to be within the acceptable and permissible limit. Thus, it may be concluded that valuable positive outcome is indicated from water treatment processes in terms of pH, a significant physico-chemical parameter. Even though, pH values of some water samples are marginally near the highest permissible values recommended by WHO and other related organizations. A proper control and follow up is required during all the stages of water treatment and distribution to the consumer points so that to maintain the purity of drinking water and minimize the associated health risks. This will also participate in minimizing water corrosion through distribution systems15.
Although the values of other physico-chemical parameters such as EC, TDS and TH were found to be within the acceptable range set by the national and international organizations’ guidelines, a considerable variation was observed among all the water samples.
Major Elements
Presence of sodium, calcium, magnesium and potassium in drinking water is considered to be essential to the heath of mankind is ranging between 10 mg ̸ L to 100 mg ̸ L for sodium and calcium respectively and between 1 mg ̸ L to 10 mg ̸ L for magnesium and potassium.16 In this study, sodium is not included as one of the 20 elements under investigation. However, calcium (Ca) and magnesium (Mg) concentrations in all representative samples were measured. Treated drinking water of stations and bottled drinking water samples have scored the lower concentrations of the two major elements compared to the samples of tap water from hospitals.. (Table 4, 5 and 8). Depletion of these elements during the treatment processes may be the significant cause of their varying results. Only two samples (Alrraidah, Jazan and Aljisr-Bish) from treated drinking water samples of stations were found to contain calcium (Ca). On the other hand, calcium is not detected in bottled drinking water samples indicating the deficiency of this major element in all the brands of bottled water samples tested.
Table 4: Parameters measured in treated tap water samples from hospitals of Jazan region
|
Parameter |
Unit |
P.M.H.a |
A.P.Hb |
K.F.Hc |
J.P.Hd |
Permissible limits |
||||||
|
|
n= 3 |
n= 3 |
n= 3 |
n=3 |
WHO, 2011 |
USEPA, 2009 |
GSO, 2008 |
ASAO, 1984 |
||||
|
pH |
7.22 |
7.86 |
7.72 |
7.48 |
6.5–9.5 |
6.5–8.5 |
NM |
6.5–8.5 |
||||
|
EC |
µS/cm |
1222 |
1468 |
1396 |
1272 |
NM |
NM |
NM |
800–2300 |
|||
|
TH |
mg/L |
3017 |
6179 |
1059 |
2516 |
500 |
NM |
NM |
500 |
|||
|
TDS |
mg/L |
686 |
1242 |
597 |
1124 |
1000 |
500 |
NM |
1500 |
|||
|
Li |
µg/L |
42.82 |
40.94 |
38.91 |
39.00 |
NM |
0.005 |
NM |
NM |
|||
|
Be |
µg/L |
62.22429 |
Nil |
Nil |
Nil |
NM |
NM |
NM |
NM |
|||
|
Mg |
Mg/L |
3017 |
6179 |
1059 |
2516 |
NM |
NM |
NM |
30–150 |
|||
|
Ca |
Mg/L |
Nil |
Nil |
Nil |
Nil |
NM |
NM |
NM |
200 |
|||
|
Al |
µg/L |
Nil |
Nil |
Nil |
Nil |
200 |
50–200 |
NM |
NM |
|||
|
Ti |
µg/L |
5.217 |
5.188 |
5.183 |
5.183 |
NM |
NM |
NM |
NM |
|||
|
Cr |
µg/L |
Nil |
Nil |
Nil |
Nil |
50 |
100 |
50 |
NM |
|||
|
Mn |
µg/L |
Nil |
Nil |
Nil |
Nil |
400 |
50 |
400 |
50 |
|||
|
Co |
µg/L |
Nil |
Nil |
Nil |
Nil |
NM |
NM |
NM |
NM |
|||
|
Ni |
µg/L |
Nil |
Nil |
Nil |
Nil |
70 |
NM |
70 |
NM |
|||
|
Cu |
µg/L |
Nil |
Nil |
Nil |
Nil |
2,000 |
1300 |
1,000 |
NM |
|||
|
Zn |
µg/L |
311.8 |
215.6 |
59.18 |
88.45 |
3,000 |
5000 |
NM |
NM |
|||
|
As |
µg/L |
94.96 |
27.88 |
Nil |
Nil |
10 |
10 |
10 |
NM |
|||
|
Rb |
µg/l |
2947 |
720.1 |
142.5 |
264.8 |
NM |
NM |
NM |
NM |
|||
|
Sr |
µg/L |
640.7 |
117.2 |
21.31 |
41.59 |
NM |
4.2 mg/L |
NM |
NM |
|||
|
Cd |
µg/L |
Nil |
Nil |
Nil |
Nil |
3 |
5 |
3 |
NM |
|||
|
Cs |
µg/L |
Nil |
Nil |
Nil |
Nil |
NM |
NM |
NM |
NM |
|||
|
Ba |
µg/L |
Nil |
Nil |
Nil |
Nil |
700 |
2,000 |
700 |
NM |
|||
|
Pb |
µg/L |
5.779 |
8.250 |
4.558 |
5.532 |
10 |
15 |
10 |
NM |
|||
|
U |
2.018 |
Nil |
Nil |
Nil |
15 |
30 |
15 |
NM |
||||
|
|
Total No. of Samples 12 |
|||||||||||
Key: a = Prince Mohammed Bin Nasir Hospital (Al-shawajrah); b= Abu Arish Public Hospital (Abu Arish); c = King Fahd Hospital (Abu Arish); d = Jazan Public Hospital (Jazan); n = No. of samples from each hospital; NM = Not mentioned; Nil = Not available in the sample
Table 5: Parameters measured in treated water samples collected from different governorates of Jazan region (group I elements)
|
Information about samples |
Concentrations (µg/L) |
Physico-chemical parameters |
||||||||
|
Code-S No. |
Station Name |
Li |
Be |
Mg |
Al |
Cr |
pH |
EC µS/cm |
TH mg/L |
TDS mg/L |
|
Y-1 |
Alrraidah, Jazan |
38.97 |
Nil |
1544 |
Nil |
Nil |
7.21 |
124.5 |
1.6674 |
698.2 |
|
Y-2 |
Rafhaa Waters |
138.99 |
Nil |
302.7 |
Nil |
Nil |
7.34 |
187.3 |
140.2 |
|
|
Y-3 |
Alssadeem Labs-Jazan |
39.06 |
Nil |
1141 |
Nil |
Nil |
7.54 |
211.6 |
1.141 |
346.6 |
|
Y-4 |
Faris-Beesh |
38.86 |
Nil |
2662 |
Nil |
Nil |
7.56 |
222.4 |
2.662 |
432.4 |
|
Y-5 |
Aljisr-Beesh |
39.10 |
Nil |
546 |
384 |
Nil |
8.14 |
198.1 |
0.594 |
211.6 |
|
Y-6 |
Alghariya Waters-Jazan |
38.98 |
Nil |
1694 |
124.7 |
Nil |
7.43 |
344.5 |
1.694 |
789.3 |
|
Y-7 |
RoohAlfirdos Labs-Jazan |
38.89 |
Nil |
2213 |
Nil |
Nil |
7.22 |
31.6 |
2.213 |
812.4 |
|
Y-8 |
QatratSehab Waters-Jazan |
39.19 |
Nil |
1509 |
20.86 |
Nil |
7.28 |
198.2 |
1.509 |
562.3 |
|
Y-9 |
Marwiah-WadiJazan |
38.84 |
Nil |
1490 |
Nil |
Nil |
7.55 |
256.8 |
1.490 |
665.4 |
|
Y-10 |
Alrayan-WadiJazan |
38.97 |
Nil |
1689 |
Nil |
Nil |
7.98 |
229.8 |
1.689 |
698.5 |
|
Y-11 |
Alqana’a Lab-WadiJazan |
39.02 |
Nil |
1727 |
Nil |
Nil |
8.12 |
276.7 |
1.727 |
885.8 |
|
Y-12 |
Alkauther Waters-Sabeya |
39.12 |
Nil |
2876 |
49.98 |
Nil |
8.06 |
290.0 |
2.876 |
316.6 |
|
Y-13 |
Aishifa Waters-Sabeya |
38.95 |
Nil |
1551 |
0.3609 |
Nil |
7.87 |
265.7 |
1.551 |
498.6 |
|
Y-14 |
Dafa Waters-Sabeya |
43.52 |
Nil |
537.6 |
907.2 |
Nil |
7.76 |
318.4 |
0.5376 |
756.3 |
|
Y-15 |
Alnaqa’a-Sabeya |
39.12 |
Nil |
2389 |
149.8 |
Nil |
7.30 |
341.6 |
2.389 |
357.9 |
|
Y-16 |
Tohama Lab-Sabeya |
38.97 |
Nil |
870.3 |
112.1 |
Nil |
8.11 |
309.2 |
0.8703 |
1034.6 |
|
Y-17 |
Almanhal-Sabeya |
39.17 |
Nil |
3292 |
184.1 |
Nil |
7.86 |
299.7 |
3.292 |
622.4 |
Key: = Not available in the sample
Table 6: Parameters measured in treated water samples collected from different governorates of Jazan region (group II elements)
|
Information about samples |
Concentrations (µg/L) |
|||||
|
Code-Ser No. |
|
Mn |
Co |
Ni |
Cu |
Zn |
|
Y-1 |
Alrraidah, Jazan |
Nil |
Nil |
Nil |
Nil |
28.34 |
|
Y-2 |
Rafhaa waters |
Nil |
Nil |
Nil |
Nil |
21.86 |
|
Y-3 |
Alssadeem Labs-Jazan |
Nil |
Nil |
Nil |
Nil |
27.36 |
|
Y-4 |
Faris-Beesh |
Nil |
Nil |
Nil |
Nil |
50.93 |
|
Y-5 |
Aljisr-Beesh |
Nil |
Nil |
Nil |
Nil |
80.59 |
|
Y-6 |
Alghariya Waters-Jazan |
Nil |
Nil |
Nil |
Nil |
33.25 |
|
Y-7 |
RoohAlfirdos Labs-Jazan |
Nil |
Nil |
Nil |
Nil |
28.73 |
|
Y-8 |
QatratSehab Waters-Jazan |
Nil |
Nil |
Nil |
Nil |
34.43 |
|
Y-9 |
Marwiah-WadiJazan |
Nil |
Nil |
Nil |
Nil |
19.50 |
|
Y-10 |
Alrayan-WadiJazan |
Nil |
Nil |
Nil |
Nil |
19.50 |
|
Y-11 |
Alqana’a Lab-WadiJazan |
Nil |
Nil |
Nil |
Nil |
16.16 |
|
Y-12 |
Alkauther Waters-Sabeya |
Nil |
Nil |
Nil |
Nil |
30.11 |
|
Y-13 |
Aishifa Waters-Sabeya |
Nil |
Nil |
Nil |
Nil |
15.38 |
|
Y-14 |
Dafa Waters-Sabeya |
Nil |
Nil |
Nil |
14.14 |
98.47 |
|
Y-15 |
Alnaqa’a-Sabeya |
Nil |
Nil |
Nil |
Nil |
31.09 |
|
Y-16 |
Tohama Lab-Sabeya |
Nil |
Nil |
Nil |
Nil |
33.25 |
|
Y-17 |
Almanhal-Sabeya |
Nil |
Nil |
Nil |
Nil |
51.32 |
|
|
GSO,2009 |
|||||
|
|
WHO, 2011 |
|||||
Key: Nil = Not available in the sample
Table 7: Parameters measured in treated water samples collected from different governorates of Jazan region (group III elements)
|
Information about samples |
Concentrations (µg/L) |
|||||
|
Code-S. No. |
Names of stations |
Ca |
As |
Rb |
Sr |
Cd |
|
Y-1 |
Alrraidah, Jazan |
123.4 |
Nil |
89.04 |
11.86 |
Nil |
|
Y-2 |
Rafhaa waters |
Nil |
Nil |
28.09 |
1.470 |
Nil |
|
Y-3 |
Alssadeem Labs-Jazan |
Nil |
Nil |
159.7 |
23.32 |
Nil |
|
Y-4 |
Faris-Bish |
Nil |
Nil |
169.2 |
25.36 |
Nil |
|
Y-5 |
Aljisr-Bish |
48.08 |
Nil |
3.114 |
ND |
Nil |
|
Y-6 |
Alghariya Waters-Jazan |
Nil |
Nil |
149.5 |
22.06 |
Nil |
|
Y-7 |
RoohAlfirdos Labs-Jazan |
Nil |
Nil |
195.5 |
29.71 |
Nil |
|
Y-8 |
QatratSehab Waters-Jazan |
Nil |
Nil |
201.2 |
30.91 |
Nil |
|
Y-9 |
Marwiah-WadiJazan |
Nil |
Nil |
127.4 |
17.92 |
Nil |
|
Y-10 |
Alrayan-WadiJazan |
Nil |
Nil |
139.8 |
20.18 |
Nil |
|
Y-11 |
Alqana’a Lab-WadiJazan |
Nil |
Nil |
140.2 |
20.40 |
Nil |
|
Y-12 |
Alkauther Waters-Sabya |
Nil |
Nil |
249.9 |
38.79 |
Nil |
|
Y-13 |
Aishifa Waters-Sabya |
Nil |
Nil |
125.7 |
18.18 |
Nil |
|
Y-14 |
Dafa Waters-Sabya |
Nil |
Nil |
16.10 |
0.6073 |
Nil |
|
Y-15 |
Alnaqa’a-Sabya |
Nil |
Nil |
176.2 |
26.62 |
Nil |
|
Y-16 |
Tohama Lab-Sabya |
Nil |
Nil |
75.66 |
9.535 |
Nil |
|
Y-17 |
AlmanhalSabya |
Nil |
Nil |
201.2 |
31.04 |
Nil |
Key: Nil = Not available in the sample
Table 8: Parameters measured in treated water samples collected from different governorates of Jazan region (group VI elements)
|
Information about samples |
Concentrations (µg/L) |
|||||
|
Code-Ser. No. |
Names of stations |
Cs |
Ba |
Tl |
Pb |
U |
|
Y-1 |
Alrraidah, Jazan |
Nil |
Nil |
5.178 |
7.590 |
Nil |
|
Y-2 |
Rafhaa waters |
Nil |
Nil |
Nil |
5.176 |
5.195 |
|
Y-3 |
Alssadeem Labs-Jazan |
Nil |
Nil |
5.175 |
4.325 |
2.016 |
|
Y-4 |
Faris-Beesh |
Nil |
Nil |
5.176 |
4.777 |
Nil |
|
Y-5 |
Aljisr-Beesh |
Nil |
Nil |
5.186 |
5.624 |
Nil |
|
Y-6 |
Alghariya Waters-Jazan |
Nil |
Nil |
5.179 |
5.394 |
22.18 |
|
Y-7 |
RoohAlfirdos Labs-Jazan |
Nil |
Nil |
5.175 |
4.393 |
Nil |
|
Y-8 |
QatratSehab Waters-Jazan |
Nil |
Nil |
5.178 |
4.261 |
42.34 |
|
Y-9 |
Marwiah-WadiJazan |
Nil |
Nil |
5.175 |
4.216 |
Nil |
|
Y-10 |
Alrayan-WadiJazan |
Nil |
Nil |
5.174 |
4.213 |
Nil |
|
Y-11 |
Alqana’a Lab-WadiJazan |
Nil |
Nil |
5.180 |
4.265 |
Nil |
|
Y-12 |
Alkauther Waters-Sabeya |
Nil |
Nil |
5.181 |
4.244 |
22.18 |
|
Y-13 |
Aishifa Waters-Sabeya |
Nil |
Nil |
5.174 |
4.264 |
Nil |
|
Y-14 |
Dafa Waters-Sabeya |
Nil |
Nil |
14.22 |
15.71 |
Nil |
|
Y-15 |
Alnaqa’a-Sabeya |
Nil |
Nil |
5.186 |
5.225 |
Nil |
|
Y-16 |
Tohama Lab-Sabeya |
Nil |
Nil |
5.183 |
4.935 |
Nil |
|
Y-17 |
Almanhal-Sabeya |
Nil |
Nil |
5.178 |
5.600 |
Nil |
Key: Nil = Not available in the sample
Trace Elements
Although, the trace elements contribute in the natural occurrence of dissolved constituents in groundwater by only 1 %, there should be a periodical follow up and measurement of trace element in bottled and treated drinking water to avoid contamination by these toxic metals from unexpected sources. Some of the trace elements are essential to human health such as vanadium, selenium, cobalt and nickel upto certain concentration range. On the other hand some of these trace elements are toxic to human beings such as cadmium, aluminum, arsenic and lead with concentrations not exceeding 1 µg/L and uranium with a concentration lower than 10 µg/L.16
Water samples of treated tap water and from stations recorded the highest values of Rb and Sr. However, their concentrations did not exceed the recommended values of the organizations including WHO. The average concentrations of a total of 14 trace elements measured in all the samples were within the permissible limits except three samples from treated drinking water of stations [Alghariya Waters-Jazan (22.18 mg/L), QatratSehab Waters-Jazan (42.34 mg/L) and Alkauther Waters-Sabeya (22.18 mg/L)] in which the uranium level exceeded the permissible limits of all national and international organizations including WHO which might due to the geophysical properties of Sabeya area.
Improvement of distribution systems and application of systematic regular maintenance may be effective to avoid the existence of these toxic elements. These elements can be considered safe at the lower concentrations levels as shown in (Table 3). Cobalt concentration values were very low in all the tested samples and also remained undetected in some of the water samples. The strontium is a naturally occurring element and its permissible limit is 4200 µg/L which is very high as shown in (Table 10). It is noteworthy that none of the deliberate components in the drinking water tested in this study exceeded their maximum allowable limits. Hence, on the basis the investigation results, one can infer that the drinking water quality in Jazan area is maintained as per the global regulatory standards.
Table 9: List of bottled drinking water samples, brands, codes and number of samples in each brand collected from the market of Jazan city
|
Serial |
Brand |
Code |
Number of Samples (n) |
|
Z-1 |
QatratSahab |
QS |
2 |
|
Z-2 |
Hana |
H |
2 |
|
Z-3 |
Pure life |
PL |
3 |
|
Z-4 |
Hada |
HD |
1 |
|
Z-5 |
Aquqfina |
AF |
1 |
|
Z-6 |
Panda |
P |
2 |
|
Z-7 |
Arwa |
A |
2 |
|
Z-8 |
Fayha |
F |
2 |
|
Z-9 |
Nova |
N |
2 |
|
Z-10 |
Mozen |
M |
2 |
|
Z-11 |
Al-gassim |
AQ |
1 |
|
X-12 |
Najran |
NJ |
1 |
|
Z-13 |
Hilwa |
HL |
1 |
|
Z-14 |
Maeen |
MA |
2 |
|
Z-15 |
Haley |
HA |
2 |
|
Z-16 |
Dala |
D |
3 |
|
Z-17 |
Zamzam |
Z |
2 |
|
Z-18 |
Manhal |
ZM |
3 |
|
Z-19 |
Juman |
J |
2 |
|
Z-20 |
Safa |
S |
2 |
|
Z-21 |
One |
O |
1 |
|
Z-22 |
Al-wadi |
AW |
1 |
|
Total No. of Samples |
39 |
||
|
Total No. of Brands |
22 |
Table 10: Parameters measured in bottled drinking water of samples collected from supermarkets of different governorates of Jazan city (group I of elements)
|
Samples |
Concentrations (µg/L) |
Physico-chemical parameters |
|||||||
|
Brand name |
Li |
Be |
Mg |
Al |
Cr |
pH |
EC µS/cm |
TH mg/L |
TDS mg/L |
|
QatratSahab |
38.35 |
Nil |
804.6 |
Nil |
Nil |
6.9 |
98.5 |
0.8046 |
6.7 |
|
Hana |
37.89 |
Nil |
477.9 |
Nil |
Nil |
6.8 |
231.5 |
0.4779 |
4.2 |
|
Pure life |
38.73 |
Nil |
7602 |
Nil |
Nil |
7.2 |
453.5 |
7.602 |
11.26 |
|
Hada |
38.22 |
Nil |
1765 |
Nil |
Nil |
6.7 |
135.9 |
1.765 |
4.2 |
|
Aquqfina |
4.225 |
Nil |
118.5 |
Nil |
Nil |
7.4 |
211.4 |
1.18.5 |
3.5 |
|
Panda |
38.49 |
Nil |
781.1 |
Nil |
Nil |
7.3 |
460.2 |
0.7811 |
2.6 |
|
Arwa |
37.88 |
Nil |
927.5 |
Nil |
Nil |
6.9 |
104.5 |
0.9275 |
2.1 |
|
Fayha |
38.13 |
Nil |
689.1 |
Nil |
Nil |
6.7 |
250.5 |
0.6891 |
4.6 |
|
Nova |
37.78 |
Nil |
983.7 |
Nil |
Nil |
7.5 |
332.3 |
0.9837 |
4.4 |
|
Mozen |
40.40 |
Nil |
1369 |
Nil |
Nil |
7.8 |
278.6 |
1.369 |
4.4 |
|
Al-gassim |
37.74 |
Nil |
4949 |
Nil |
Nil |
7.5 |
511.3 |
4.949 |
17.8 |
|
Najran |
38.31 |
Nil |
798.7 |
Nil |
Nil |
7.6 |
390.4 |
0.7987 |
5.6 |
|
Hilwa |
38.59 |
Nil |
6951 |
Nil |
Nil |
7.7 |
112.4 |
6.951 |
13.2 |
|
Maeen |
41.95 |
Nil |
3068 |
Nil |
Nil |
7.1 |
234.6 |
3.068 |
23.5 |
|
Haley |
38.64 |
Nil |
1054 |
Nil |
Nil |
7.4 |
234.6 |
1.054 |
15.6 |
|
Dala |
38.56 |
Nil |
302.81 |
Nil |
Nil |
7.6 |
327.7 |
0.3028 |
12.3 |
|
Zamzam |
38.63 |
Nil |
961.7 |
Nil |
Nil |
6.8 |
498.3 |
0.9617 |
6.9 |
|
Manhal |
38.41 |
Nil |
798.2 |
Nil |
Nil |
6.8 |
128.5 |
0.7982 |
5.3 |
|
Juman |
38.99 |
Nil |
3818 |
Nil |
Nil |
7.6 |
321.7 |
3.818 |
26.6 |
|
Safa |
38.02 |
Nil |
3168 |
Nil |
Nil |
7.9 |
222.5 |
3.168 |
30.5 |
|
One |
37.91 |
Nil |
6749 |
Nil |
Nil |
7.3 |
443.6 |
6.749 |
40.2 |
|
Al-wadi |
37.76 |
Nil |
724.3 |
Nil |
Nil |
6.7 |
390.0 |
0.7243 |
18.8 |
Key: Nil = Not available in the sample
Table 11: Parameters measured in bottled drinking water of samples collected from supermarkets of different governorates of Jazan city (second group of elements)
|
Samples |
Concentrations (µg/L) |
||||
|
Brand name |
Mn |
Co |
Ni |
Cu |
Zn |
|
QatratSahab |
Nil |
Nil |
Nil |
Nil |
3.395 |
|
Hana |
Nil |
Nil |
Nil |
Nil |
3.591 |
|
Pure life |
Nil |
Nil |
Nil |
Nil |
3.591 |
|
Hada |
Nil |
Nil |
Nil |
Nil |
14.20 |
|
Aquqfina |
Nil |
Nil |
Nil |
Nil |
0.6341 |
|
Panda |
Nil |
Nil |
Nil |
Nil |
3.395 |
|
Arwa |
Nil |
Nil |
Nil |
Nil |
9.484 |
|
Fayha |
Nil |
Nil |
Nil |
Nil |
4.377 |
|
Nova |
Nil |
Nil |
Nil |
Nil |
7.716 |
|
Mozen |
Nil |
Nil |
Nil |
Nil |
12.43 |
|
Al-gassim |
Nil |
Nil |
Nil |
Nil |
6.734 |
|
Najran |
Nil |
Nil |
Nil |
Nil |
8.502 |
|
Hilwa |
Nil |
Nil |
Nil |
Nil |
6.341 |
|
Maeen |
Nil |
Nil |
Nil |
Nil |
13.02 |
|
Haley |
Nil |
Nil |
Nil |
Nil |
12.04 |
|
Dala |
Nil |
Nil |
Nil |
Nil |
23.63 |
|
Zamzam |
Nil |
Nil |
Nil |
Nil |
6.734 |
|
Manhal |
Nil |
Nil |
Nil |
Nil |
6.145 |
|
Juman |
Nil |
Nil |
Nil |
Nil |
21.07 |
|
Safa |
Nil |
Nil |
Nil |
Nil |
31.68 |
|
One |
Nil |
Nil |
Nil |
Nil |
15.97 |
|
Al-wadi |
Nil |
Nil |
Nil |
Nil |
13.61 |
Key: Nil = Not available in the sample
Table 12: Parameters measured in bottled drinking water of samples collected from supermarkets of different governorates of Jazan city (third group of elements)
|
Samples |
Concentrations in (µg/L) |
||||
|
Brand name |
Ca |
As |
Rb |
Sr |
Cd |
|
QatratSahab |
Nil |
Nil |
69.43 |
8.669 |
Nil |
|
Hana |
Nil |
Nil |
177.7 |
25.49 |
Nil |
|
Pure life |
Nil |
Nil |
Nil |
Nil |
Nil |
|
Hada |
Nil |
Nil |
6.322 |
Nil |
Nil |
|
Aquqfina |
Nil |
Nil |
14.16 |
2.104 |
Nil |
|
Panda |
Nil |
Nil |
70.88 |
8.045 |
Nil |
|
Arwa |
Nil |
Nil |
40.16 |
2.765 |
Nil |
|
Fayha |
Nil |
Nil |
51.77 |
4.617 |
Nil |
|
Nova |
Nil |
Nil |
Nil |
Nil |
Nil |
|
Mozen |
Nil |
Nil |
139.6 |
20.32 |
Nil |
|
Al-gassim |
Nil |
Nil |
Nil |
Nil |
Nil |
|
Najran |
Nil |
Nil |
66.89 |
8.357 |
Nil |
|
Hilwa |
Nil |
Nil |
Nil |
Nil |
Nil |
|
Maeen |
Nil |
Nil |
60.88 |
10.26 |
Nil |
|
Haley |
Nil |
Nil |
214.8 |
32.22 |
Nil |
|
Dala |
Nil |
Nil |
6.551 |
Nil |
Nil |
|
Zamzam |
Nil |
Nil |
194.2 |
28.64 |
Nil |
|
Manhal |
Nil |
Nil |
74.49 |
9.005 |
Nil |
|
Juman |
Nil |
Nil |
199.0 |
29.54 |
Nil |
|
Safa |
Nil |
Nil |
108.7 |
14.35 |
Nil |
|
One |
Nil |
Nil |
46.27 |
3.323 |
Nil |
|
Al-wadi |
Nil |
Nil |
Nil |
Nil |
Nil |
Key: Nil = Not available in the sample
Table 13: Parameters measured in bottled drinking water of samples collected from supermarkets of different governorates of Jazan city (fourth group of elements)
|
Samples |
Concentrations (µg/L) |
||||
|
Brand name |
Cs |
Ba |
Ti |
Pb |
U |
|
QatratSahab |
Nil |
Nil |
5.172 |
5.711 |
Nil |
|
Hana |
Nil |
Nil |
5.172 |
4.658 |
22.18 |
|
Pure life |
Nil |
Nil |
5.172 |
4.431 |
Nil |
|
Hada |
Nil |
Nil |
5.174 |
4.400 |
Nil |
|
Aquqfina |
Nil |
Nil |
0.5174 |
0.4694 |
Nil |
|
Panda |
Nil |
Nil |
5.173 |
4.297 |
82.66 |
|
Arwa |
Nil |
Nil |
5.180 |
4.936 |
2.016 |
|
Fayha |
Nil |
Nil |
5.175 |
4.572 |
Nil |
|
Nova |
Nil |
Nil |
5.182 |
4.356 |
Nil |
|
Mozen |
Nil |
Nil |
5.172 |
4.342 |
Nil |
|
Al-gassim |
Nil |
Nil |
5.172 |
5.696 |
Nil |
|
Najran |
Nil |
Nil |
5.174 |
4.852 |
Nil |
|
Hilwa |
Nil |
Nil |
5.172 |
4.332 |
2.016 |
|
Maeen |
Nil |
Nil |
5.175 |
4.646 |
Nil |
|
Haley |
Nil |
Nil |
5.172 |
4.987 |
42.34 |
|
Dala |
Nil |
Nil |
5.178 |
4.682 |
Nil |
|
Zamzam |
Nil |
Nil |
5.180 |
4.955 |
Nil |
|
Manhal |
Nil |
Nil |
5.181 |
4.701 |
42.34 |
|
Juman |
210.0 |
277.2 |
5.181 |
5.727 |
2.016 |
|
Safa |
Nil |
16.41 |
5.173 |
4.952 |
Nil |
|
One |
Nil |
Nil |
5.193 |
4.278 |
Nil |
|
Al-wadi |
Nil |
Nil |
5.173 |
5.091 |
2.016 |
|
GSO,2009 |
|||||
|
WHO, 2011 |
|||||
Key: Nil = Not available in the sample
![Fig. 1. Water availability in the world; Saudi Arabia is one of the threatened areas [5].](http://www.cwejournal.org/wp-content/uploads/2017/03/Vol12_No1_ICP_Moh_Fig1-150x150.jpg) |
|
 |
|
Conclusion
The current study determined the concentration of heavy metals and physico-chemical properties of drinking water from different sources (bottled, treated, and tap water) in Jazan area. Our findings showed that the drinking water quality of the investigated sources was within the recommended limits established by WHO. However, to estimate the complete quality of the water samples additional investigations are recommended for determining other kinds of pollutants such as pesticides, polycyclic aromatic hydrocarbons (PAHs), pharmaceuticals and personal care products (PPCPs).
Funding Information
This study was fully funded by the Scientific Research Deanship, Jazan University, under the grant number 36/6/2637.
References
- Wongsasuluk, P., Chotpantarat, S., Siriwong, W., and Robson, M. Heavy metal contamination and human health risk assessment in drinking water from shallow groundwater wells in an agricultural area in Ubon Ratchathani province, Thailand. Environmental geochemistry and health, 36: 169-182. (2014).
CrossRef - ICSU, I., TWAS. 2002, in Science and Technology for Sustainable Development: Consensus Report and Background Document for the Mexico City Synthesis Workshop on Science and Technology for Sustainable Development, 20–23 May 2002 (2003).
- Adekunle, A. Effects of industrial effluent on quality of well water within Asa Dam Industrial Estate, Ilorin, Nigeria. Nature and Science, 7: 1545-0740 (2009).
- Barwick, R. S., Levy, D. A., Craun, G. F.,. Beach, M. J., and Calderon, R. L. Surveillance for waterborne-disease outbreaks—United States, 1997–1998. MMWR CDC Surveill Summ, 49: 1-21. (2000).
- Mebrahtu, G., and Zerabruk, S. Concentration and health implication of heavy metals in drinking water from urban areas of Tigray region, Northern Ethiopia. Momona Ethiopian Journal of Science, 3: 105-121 (2011).
CrossRef - Alhababy A. M., and Al-Rajab, A. J. Groundwater Quality Assessment in Jazan Region, Saudi Arabia. Curr World Environ, 10(1): 22-28 (2015).
CrossRef - Mohamed, Z. A., and Al Shehri, A. M. Microcystins in groundwater wells and their accumulation in vegetable plants irrigated with contaminated waters in Saudi Arabia. Journal of hazardous materials, 172: 310-315 (2009).
CrossRef - Fayad, N. M. Seasonal variations of THMs in Saudi Arabian drinking water. Journal (American Water Works Association), 85(1) 46-50 (1993)
- Al-Hatim, H. Y., Alrajhi, D.,.and Al-Rajab, A. J. Detection of Pesticide Residue in Dams and Well Water in Jazan Area, Saudi Arabia. American Journal of Environmental Sciences, 11(5): 358-365 (2015).
CrossRef - Alabdula'aly, A. I. Fluoride content in drinking water supplies of Riyadh, Saudi Arabia. Environmental monitoring and assessment, 48: 261-272 (1997).
CrossRef - Payment, P., Siemiatycki, J., Richardson, L., Renaud, G., Franco, E. et al. A prospective epidemiological study of gastrointestinal health effects due to the consumption of drinking water. International Journal of Environmental Health Research, 7: 5-31 (1997).
CrossRef - Birke, M., Reimann, C., Demetriades, A., Rauch, U., Lorenz, H. et al. Determination of major and trace elements in European bottled mineral water—analytical methods. Journal of Geochemical exploration, 107: 217-226 (2010).
CrossRef - Mahmoud, S. H., and Alazba, A. Identification of potential sites for groundwater recharge using a GIS-based decision support system in Jazan region-Saudi Arabia. Water resources management, 28: 3319-3340 (20140.
- WHO. Selenium in drinking-water, WHO/HSE/WSH/10.01/14 (2011).
- WHO. Chloride in drinking-water. WHO/SDE/WSH/03.04/16 (2003).
- Foster, S., Kemper , K., Tuinhof, A., Koundouri, P., Nanni, M. et al. Natural Groundwater Quality Hazards, avoiding problems and formulating mitigation strategies. GW. MATE Core Group. Briefing Note Series Note 14 (2006).
CrossRef - Brima, E. I. Physicochemical properties and the concentration of anions, major and trace elements in groundwater, treated drinking water and bottled drinking water in Najran area, KSA. Applied Water Science. DOI 10.1007/s13201-014-0255-x (2014).
- USEPA. United States Environmental Protection Agency (USEPA), EPA 816-F-09-004 (2009)
- GSO. GCC Standardization Organization (GSO). Unbottled drinking water, Standard. No. 149/2000 (2008).
- SASO. Saudi Standards, Metrology and Quality Org. Water quality and standards, Chapter 3 (1984).


