Statistical Trend Analysis of Rainfall in Amaravathi River Basin using Mann-Kendall Test
S.I. Sridhar 1 and A. Raviraj 2 *
http://dx.doi.org/10.12944/CWE.12.1.11
The present study aims to detect the trends in annual and seasonal rainfall and its magnitude in Amaravathi basin, Tamil Nadu. In this study, the mean annual and seasonal rainfall in 10 rain gauge stations of Amaravathi basin have been analysed to determine the trend and its magnitude for the period of 1982-2014. The trend analysis is done using Mann-Kendall and Sen’s slope estimator. The trend analysis results showed wide variations during all the seasons. The increasing trend of rainfall is found to be dominant during north-east monsoon season when compared to other seasons.
Copy the following to cite this article:
Sridhar S.I, Raviraj A. Statistical Trend Analysis of Rainfall in Amaravathi River Basin using Mann-Kendall Test. Curr World Environ 2017;12(1). DOI:http://dx.doi.org/10.12944/CWE.12.1.11
Copy the following to cite this URL:
Sridhar S.I, Raviraj A. Statistical Trend Analysis of Rainfall in Amaravathi River Basin using Mann-Kendall Test. Curr World Environ 2017;12(1). Available from: http://www.cwejournal.org/?p=16833
Download article (pdf) Citation Manager Publish History
Introduction
Life on earth cannot be sustained without water. Among the components of the hydrological cycle, rainfall is considered as the principle source of water to earth. In India, rainfall shows very high spatial and temporal variability. The mean yearly precipitation ranges from under 100 mm in the western Rajasthan to more than 2500 mm in north-eastern territories.1 A large portion of the precipitation in India happens affected by southwest storm between June to September with the exception of in Tamil Nadu where it is affected by north-east rainstorm amid October and November.1 In India, the agriculture planning and water utilisation depend on monsoon rainfall since75 per cent of the rainfall occurs during monsoon season.2,3
On a normal, India gets around 4000 BCM of precipitation for each year; from this, the aggregate yearly stream in waterways is around 1869 BCM. In this, because of uneven dispersion of stream in time and space, just 690 BCM is put to valuable employments.1 The major constraint in utilising all the available water is the fact that it is necessary to store the river flows during monsoon months. In order to store the river flows and for efficient management of water resources in a basin during monsoon months the accurate data on spatial, temporal and rainfall trend of a particular river basin is required. Analysis of rainfall and determination of annual maximum daily rainfall would enhance the management of water resources applications as well as the effective utilisation of water resources.4 Such information can also be used to prevent floods and droughts and applied to planning and designing of water resources related to engineerings such as reservoir design, flood control and soil and water conservation planning. The growing concern about climate change has heightened the need for accurate information about the space-time distribution of precipitation.5 There are many parametric and non-parametric methods that have been applied for detection of trends. One of the widely used non-parametric tests for detecting a trend in hydroclimatic time series is the Mann–Kendall (MK) test.6-13 The present study is an attempt to study the rainfall distribution of Amaravathi basin spatially and its trend using Mann-Kendall trend analysis and Sen’s slope estimator. The rainfall data for 33 years (1982-2014) has been used for the analysis.
Study Area
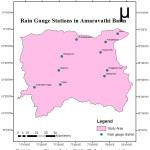
The present study was taken up in Amaravathi river Basin, (Fig. 1) a semiarid region in Tamil Nadu, India. The river Amaravathi is one among the main tributaries of the river Cauvery, in its mid reach. The river Amaravathi originates in the Western Ghats near Moonar in Kerala State at about 1554 m (5000 ft.) above MSL and flows through the dense forest of the Anamalai range of hills. It enters the plain near Amaravathinagar at 335 m (1099 ft.) above MSL. It is situated at about 18 Km from Udumalpet. It traverses a length of about 282 Km. Amaravathi basin lies between the latitude 10°06’51” N and 11°02’10” N and longitude 77°03’24” E and 78°13’06” E. It has a catchment area of 8544 km2 constituting of four districts namely Coimbatore, Tirupur, Dindigul and Karur in Tamil Nadu.
 |
|
Materials and Methods
Meteorological Data
The daily precipitation data for 33 years (1982 – 2014) for 10 rain gauge stations of Amaravathi basin namely Amaravathi Nagar, Keeranur, Palani, Uthamapalayam, Anaipalayam, Aravakurichi, Vedasandur, Karur, Kodagnar Dam, Dharapuram (Fig. 1) have been collected from the office of State Surface & Ground Water Data Centre, PublicWorks Department, Taramani, Chennai, Tamil Nadu. A rainfall analysis was carried out for all the seasons and for the whole year separately. The average seasonal and annual rainfall for each station of Amaravathi basin has been computed by the arithmetic mean method.
Rainfall Trend Analysis
The non-parametric Mann-Kendall test, which is commonly used for hydrologic data analysis, is used to detect trends that are monotonic but not necessarily linear. The null hypothesis in the Mann-Kendall test is independent and randomly ordered data. The Mann-Kendall test does not require assuming normality, and only indicates the direction but not the magnitude of significant trends.14,15
The Mann-Kendall test statistic S is calculated using the formula as follows:
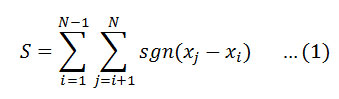
Where Xj and Xj are the annual values in years j and i,j> respectively, and N is the number of data points. The value of sgn (Xj-Xi) is computed as follows:
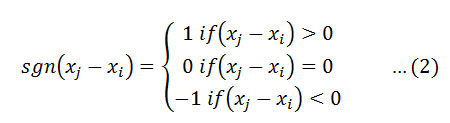
This statistics represents the number of positive differences minus the number of negative differences for all the differences considered. For large samples (N>10), the test is conducted using a normal approximation (Z statistics) with the mean and the variance as follows:
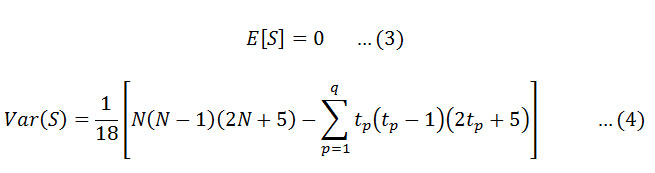
Here q is the number of tied (zero difference between compared values) groups, and tp is the number of data values in the pth group. The values of S and VAR(S) are used to compute the test statistic Z as follows
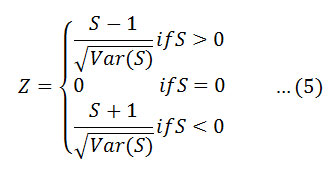
The presence of a statistically significant trend is evaluated using the Z value.A positive value of Z indicates an upward trend and its negative value a downward trend.
Rainfall trend using MMK test
The Modified Mann-Kendall test has been used for trend detection of autocorrelation series16. In this study, the autocorrelation between the ranks of the observations ρk has been estimated after subtracting the non-parametric Sen’s median slope from the slope the data10. Significant values of ρk have only been used for calculating the variance correction factor n / n* and it was calculated from the equation proposed by Hamed and Rao16,
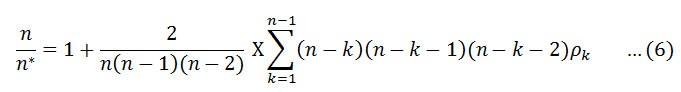
where n represents the actual number of observations, n* is represented as effective number of observations to account for the autocorrelation in the data and pk is the autocorrelation function for the ranks of the observations. The corrected variance is then given as16
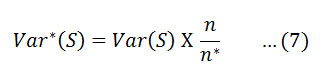
Where Var (S) is from equation (4).
Magnitude of rainfall trend
Sen (1968) developed a non-parametric method to estimate the magnitude (slope) of the trend in a time series17. This method assumes a linear trend in the time series. In this method, the slopeQi of all data value pairs are calculated by,
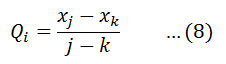
where j>k.
If there are n values xj in the time series we get as many as N = n(n-1)/2 slope estimates Qi. The Sen’s estimator of the slope is the median of these N values of Qi. The N values of Qi are ranked from the smallest to the largest and the Sen’s estimator is
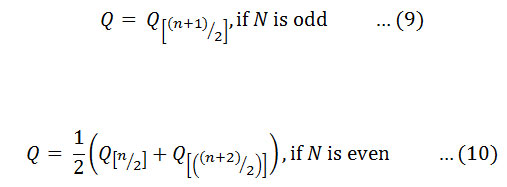
The two-sided test is carried out at 100(1 – α) % of the confidence interval to obtain the true slope for the non-parametric test in the series8. The positive or negative slope Qi is obtained as upward (increasing) or downward (decreasing) trend.
Results and Discussion
Mean annual Rainfall
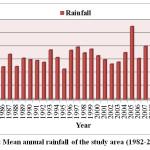
Rainfall distribution of Amaravathi river basin has been studied for 33 years (1982-2014) precipitation data. The average annual rainfall of the Amaravathi basin estimated from the 33 years (1982-2014) precipitation data of 10 rain gauge station is 657.52 mm. It is evident from the Fig 2 that the highest annual rainfall was 1107.09 mm in 2005 and the lowest one was 389.26 mm in 2013.
 |
|
Seasonal and Spatial Distribution of Rainfall
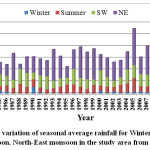
The north-east monsoon (Oct-Dec) contributed the maximum rainfall of 343.65 mm (52 per cent) followed by south-west monsoon (Jun-Sep) which contributed 173.74 mm (27 per cent), Summer (Mar-May) contributed 120.15 mm (18 per cent), and Winter (Jan-Feb) contributed the minimum rainfall of 20.73 mm (3 per cent). From the Fig 3, it is observed that among all the seasons the rainfall contribution is more from north-east monsoon.
 |
|
 |
|
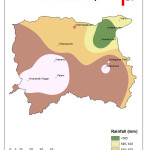
Among the 10 rain gauge stations, the annual rainfall is maximum for the station Keeranur located in the central part of the river basin which is around 755.8 mm and a minimum annual rainfall of 544.19 mm in Aravakurichi station which is located on the east side of the Amaravathi river basin. From the Fig 4, it is observed that the amount of rainfall decreases gradually from south-west side to northeast side of the river basin. The major parts of the basin receive moderate rainfall of about 585-670 mm. The southern parts of the basin receive high rainfall of about 670-700 mm. In the southern part the region around Amaravathi Nagar, Palani, and Keeranur receives every high rainfall i.e. greater than700 mm of rainfall. The region around Anaipalayam and Aravakurichi receives low rainfall when compared to another region which is less than 585 mm.
Mann-Kendall Trend Analysis
The results of the Mann-Kendall analysis to deduct the trend and the magnitude of the trend using Sen’s slope estimator for annual and seasonal rainfall for ten stations in the study area are given in Table 1 and Table 2. The Modified Mann-Kendall (MMK) z-test is) applied to annual and seasonal rainfall over different rainfall stations and the results are shown in Table 3 indicates that majority of stations shows a non-significant trend.
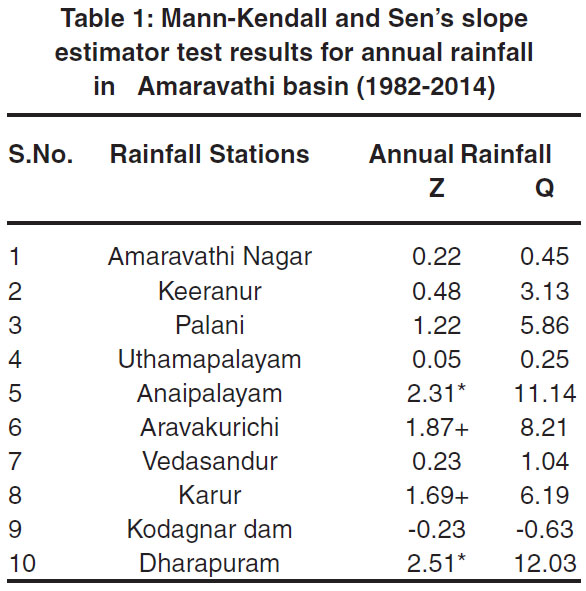 |
Table 1: Mann-Kendall and Sen’s slope estimator test results for annual rainfall in Amaravathi basin (1982-2014). Click here to view table |
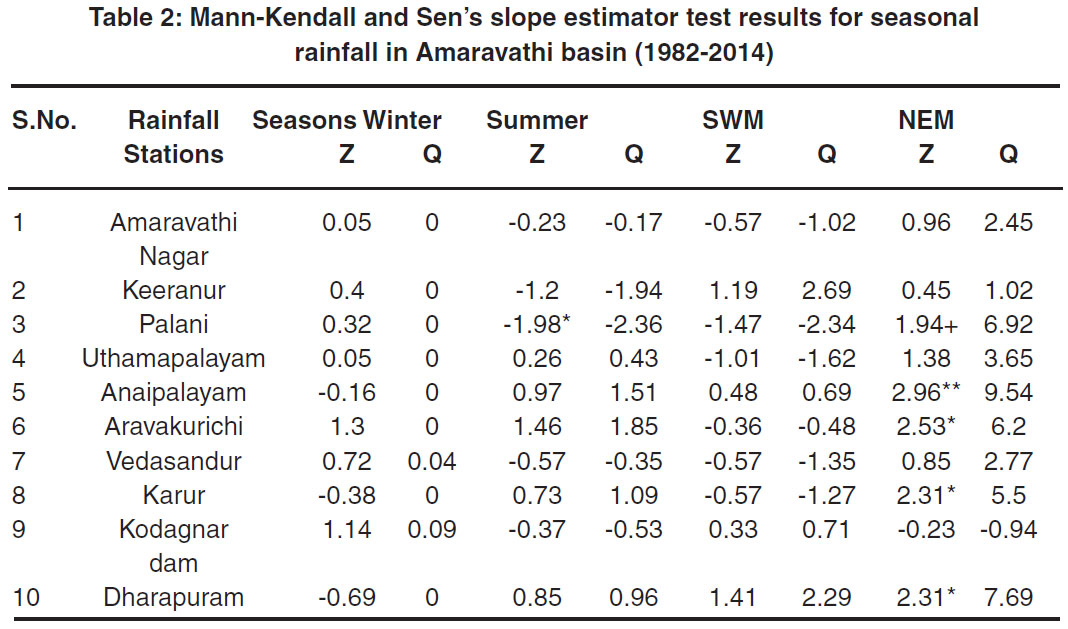 |
Table 2: Mann-Kendall and Sen’s slope estimator test results for seasonal rainfall in Amaravathi basin (1982-2014) Click here to view table |
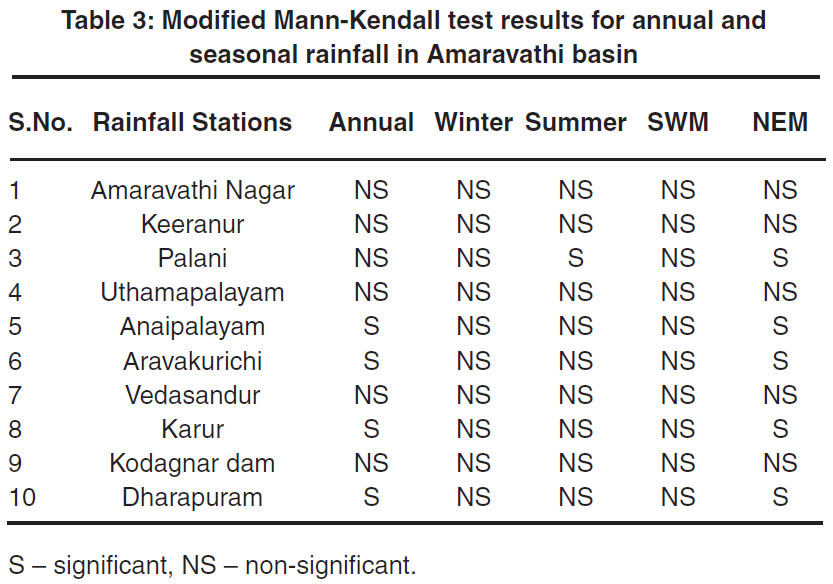 |
Table 3: Modified Mann-Kendall test results for annual and seasonal rainfall in Amaravathi basin. Click here to view table |
The trend analysis revealed that the annual rainfall in the stations Anaipalayam and Dharapuram showed a significantly increasing trend with Z values 2.31 and 2.51 respectively at 0.05 significance level. The increase in annual rainfall of Anaipalayam and Dharapuram stations are 11.4 mm/year and 12.03 mm/year respectively, which are very high when compared to other stations. The stations Aravakurichi and Karur showed the significant increasing trend at 0.1 significance level. Except for the rain gauge station Kodagnar Dam the remaining stations showed a non-significant increasing trend in annual rainfall. During winter season out of ten rain gauge stations, seven rain gauge stations namely Amaravathi Nagar, Keeranur, Palani, Uthamapalayam, Aravakurichi, Vedasandur, and Kodagnar dam had increased (positive) trend during the winter season which is non-significant whereas Anaipalayam, Karur, Dharapuram had a non-significant decreasing (negative) trend. The magnitude of rainfall trend in winter is almost zero for all the stations. In summer season only the Palani station showed significant negative trend with Z value of-1.98 significant at 0.05 level, the Sen’s slope estimator showed that the rainfall decreases by-2.36 mm/year. The south-west monsoon season rainfall trend showed non-significant results. During north-east monsoon rainfall, the Anaipalayam station showed an increasing trend at 0.01 significant level with the magnitude of 9.54 mm/year. The others stations like Palani, Aravakurichi, Karur and Dharapuram also showed significant increasing trend during north-east monsoon season.
Conclusion
This study presents the rainfall trend computed for 33 years (1982-2014) using precipitation data from 10 rain gauges in Amaravathi basin. The rainfall in Amaravathi basin is highly variable, uneven and heterogeneous. The annual average rainfall of 657.52 mm varies from a minimum of 389.26 mm in 2013 to the maximum of 1107.09 mm in 2005. The majority of the rainfall in Amaravathi basin occurs during the northeast monsoon season from October to November which accounts for 52 per cent of the average annual rainfall followed by south-west monsoon (June – September) which accounts for 27 per cent of the average annual rainfall. The trend analysis of rainfall in Amaravathi basin showed increasing trend in all stations during north-east monsoon season. The winter rainfall is found to be stable at almost all stations. The annual rainfall trend showed a significant increasing trend in Anaipalayam, Aravakurichi, Karur and Dharapuram stations where the ground water recharge potentials are higher. Since the annual rainfall seems to be increasing in these regions, water storage structures and artificial recharge structures may be constructed in these regions in order to increase the surface cum groundwater availability. Further, study of the area could be helpful in planning cropping pattern, water resource management, minimise and control the effects of floods and landslides.
Acknowledgment
Authors thank State Surface & Ground Water Data Centre, Public Works Department, Taramani, Chennai, and Tamil Nadu and Water Technology Centre for sparing the data for analysis in this study.
References
- Indian Water Resource Society, (2016).http://www.iwrs.org.in/iwr.htm.
- Guhathakurta, P. & Rajeevan, M. Trends in the rainfall pattern over India. International Journal of Climatology, 28: 1453–1469 (2008).
CrossRef - Krishan, Gopal, Rao, M.S., Kumar, Bhishma, & Kumar, C.P. Possibility of using isotopic composition of ground level vapour (Glv) for monitoring arrival and withdrawal of south-west monsoon. Current Science, 108(5):784-786 (2015).
- Subudhi, R. Probability analysis for prediction of annual maximum daily rainfall of Chakapada block of Kandhamal district in Orissa. Indian Journal of Soil Conservation, (35): 84-85(2007).
- New, M., Todd, M., Hulme, M. and Jones, P. Precipitation measurements and trends in the twentieth century.International Journal of Climatology,21(15): 1889-1922 (2001).
CrossRef - Das, P.K., A. Chakraborty, and M.V.R Seshasai. Spatial analysis of the temporal trend of rainfall and rainy days during the Indian summer monsoon season using daily gridded rainfall data for the period of 1971-2005. Meteorological Applications, 21 (3): 481–93 (2014).
CrossRef - Ganguly, A., Ranjana, R.C., and Prateek, S. Analysis of the trend of the precipitation data : A case study of Kangra district, Himachal Pradesh. International Journal of Research – Granthaalayah. 3 (2015).
- Kwarteng, A.Y., Atsu S. Dorvlo and Ganga T. Vijaya Kumar. Analysis of a 27 year (1977-2003) rainfall data in the Sultanate of Oman. International Journal of Climatology, 29: 605-617 (2009).
CrossRef - Manikandan, M., and D. Tamilmani. Statistical Analysis of Spatial Pattern of Rainfall Trends in Parambikulam Aliyar Sub-Basin, Tamil Nadu. Journal of Indian Water Resources Society, 32 (1-2): 40–49 (2012).
- Mondal, A., Sananda, K., and Mukhopadhyay, A. 2012. Rainfall trend analysis by Mann-Kendall test: A Case Study of North-Eastern Part of Cuttack District, Orissa. International Journal of Geology, Earth and Environmental Sciences,2(1): 2277–208170 (2012)
- Pandit, D. V. Seasonal Rainfall Trend Analysis. International Journal of Engineering Research and Application. 6 (7): 69–73 (2016).
- Rani, B.A., N. Manikandan, and N. Maragatham. Trend analysis of rainfall and frequency of rainy days over Coimbatore. MAUSAM, 65(3): 379–84 (2014).
- Rahman, Md. Arafat., and Monira Begum. Application of nonparametric test for trend detection of rainfall in the largest Island of Bangladesh. Journal of Earth Sciences, 2(2): 40–44 (2013).
- Mann, H.B. Nonparametric tests against trend. Econometrica, (13):245-259 (1945)
CrossRef - Kendall, M.G. Rank Correlation Methods. Charles Griffin, London, UK (1975)
- Hamed, K.H., Rao, A.R. A modified Mann-Kendall trend test for autocorrelated data. Journal of Hydrology, 204: 182–196 (1998).
CrossRef - Sen, P.K. Estimates of the regression coefficient based on Kendall’s tau. Journal of the American Statistical Association, (63): 1379-1389 (1968).
CrossRef


