Structure and Floristic Composition of Existing Agroforestry Systems in Fatehpur District of Uttar Pradesh, India
Rajiv Umrao1 * , B. Mehera1 , Neelam Khare1 and Hemant Kumar1
http://dx.doi.org/10.12944/CWE.12.1.15
The floristic-composition and structure study of existing agroforestry systems was carried out in the farmer’s fields of village Dariyapur (Site-I) and Alampur (Site-II) at Fatehpur district (Uttar Pradesh) during 2008-2010. The quantitative characteristics of vegetation were determined by the quadrat method. The floristic diversity study was made by adopting random sampling approach, under which, 20 quadrates of 10 m x 10 m were laid down. The density, frequency, abundance, IVI, Species –diversity, concentration of dominance, species-richness, equitability and beta diversity and other useful parameters for comparison of different types of existing agroforestry systems were analyzed by the simple arithmetic calculation. The study illustrated that Acacia nilotica was dominant in these sites with highest IVI values (24.91) in site- II (Alampur) lowest IVI values (22.04) in site- I (Dariyapur). Concentration of Dominance (Simpson Index) of tree species was higher in site -II (0.039) and lowest in site- I (0.032). Species diversity level among the tree species in site was observed and found higher in site-II (0.994) and lowest in site -I (0.934). Tree species equitability was same in site-I and site-II (0.055) while Beta-diversity was recorded highest in site –I (4.176) and lowest in site –II (3.944).Tree species-richness was recorded maximum in site –II (0.154) and minimum in site-I (0.149).
Copy the following to cite this article:
Umrao R, Mehera B, Khare N, Kumar H. Structure and Floristic Composition of Existing Agroforestry Systems in Fatehpur District of Uttar Pradesh, India. Curr World Environ 2017;12(1). DOI:http://dx.doi.org/10.12944/CWE.12.1.15
Copy the following to cite this URL:
Umrao R, Mehera B, Khare N, Kumar H. Structure and Floristic Composition of Existing Agroforestry Systems in Fatehpur District of Uttar Pradesh, India. Curr World Environ 2017;12(1). Available from: http://www.cwejournal.org/?p=16911
Download article (pdf) Citation Manager Publish History
Introduction
The land use pattern is one of the important aspects for analyzing the structure, composition and phyto diversity for understanding the vegetation dynamics of the existing sites. The farmers have adopted the trend of growing trees around agricultural land due to significant economics as well as social benefits. But it will be worthwhile to work out an integrated approach with the help of agricultural and forestry scientists, depending on the suitability of crops and locations.15 New land-use strategies that increase livelihood security and reduce vulnerability to climate and environmental change are necessary.13 Community structure, composition and vegetative function are the most important ecological attributes of forests, which show variations in response to environmental as well as anthropogenic activities.7,19 Species diversity is an important concept and one of the major attributes of a natural community. These differences in vegetation structure, richness, diversity and distribution are directly associated with the intensity of variables like geographical location, agricultural practices and their extent.6 In Central and Eastern Uttar Pradesh, the agroforestry systems are well established. As multiple cropping is a kind of natural resource management based on environmental, social and economic criteria which is done by combination of trees, pasture and cropland, in order to increase social, economic and environmental benefits. Tree plantation and harvesting of wood, fruits, roots, leaves, fuel, and fodder along with agricultural crops on the same piece of land has been practiced since the old days. However, under present scenario, the agroforestry techniques used by the farmers seems to be poorly developed and exploitative. In most cases, the trees are neither protected nor properly managed. Hence, there is an immense potential tool for improvement of traditional agroforestry systems in order to realize the real production potential of existing agroforestry systems. Greater agrobiodiversity also may ensure longer term stability of C storage in fluctuating environments,8 apart from the biomass production potential.10
Main aimed of this paper are to describe the structural attributes of density, frequency, diversity, equitability and species richness on the existing agroforestry systems in Fatehpur and Allahabad districts of Uttar Pradesh. This helps in determination of predominating communities of timber trees, horticultural trees and shrubs species and further identify the localities having protection and promotion of these plants.
Material and Methods
The floristic-composition and structure study of existing agroforestry systems was carried out in the farmer’s fields of village Dariyapur (Site-I) and Alampur (Site-II) at Fatehpur district (Uttar Pradesh) during 2008-2010. The research area is located between two important river Ganga and Yamuna. The study illustrated that status of density, frequency, Abundance, IVI, Species –diversity, concentration of dominance, species-richness, Equitability and Beta diversity and other useful parameters for comparison of different types of existing agroforestry systems were analyzed by the simple arithmetic calculation. The quantitative characteristics of vegetation were determined by the quadrat method. The floristic diversity study was made by adopting random sampling approach, under which, 20 quadrates of 10 m x 10 m and 5 m x 5 m size were laid out in each sites for the observation of trees and shrubs respectively. The vegetative structure of trees and shrub in each two sites was estimated for frequency; density and abundance by using expressions given by Curtis and Mc Intosh, 1950.5 Floristic diversity studies of the herbaceous species were not attempted.
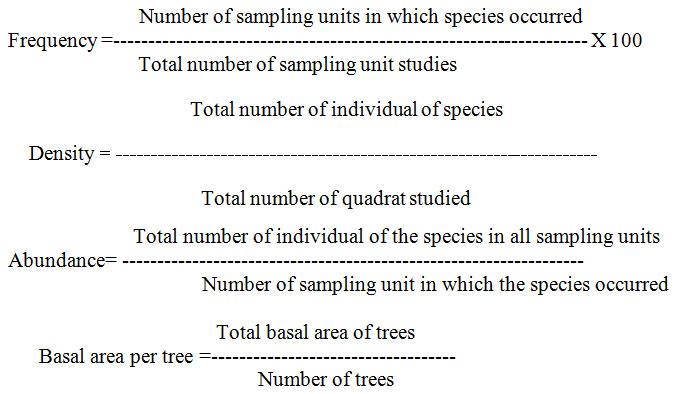
Basal area of trees was calculated as cross sectional area of stem at DBH (1.37 m), while basal area of shrubs was calculated as cross sectional area of main stem at 15 cm above from the ground level.
Basal Area = π(d2/4)
The relative density, relative frequency, relative basal areas were calculated using following formula.
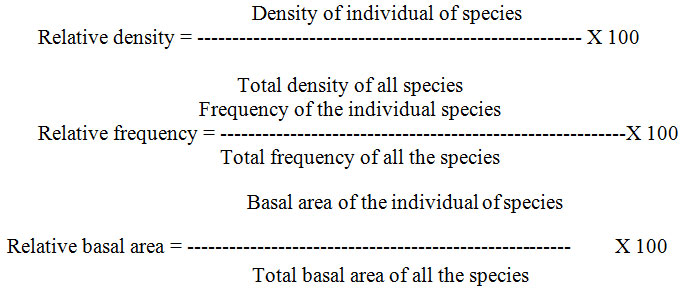
The importance value index (IVI) is an integrated measure of the relative frequency, relative density and relative basal area/dominance, was calculated for each tree species given by Curtis, 1959.4
Importance Value Index (IVI) = RD+RF+RBA
The number of trees falling in the sample unit was counted and classified as per their diameter and height. The Species diversity (Shannon index), concentration of dominance (Simpson index) and other useful parameters for comparison of different types of existing agroforestry systems were calculated.17,18
Tree Diversity Analysis
Tree diversity in all two sites of agroforestry systems (trees and shrubs) were calculated by the following diversity indices.
Species Diversity Index
It was calculated by the formula given by Margalef, 1958.12
H = -∑ [(ni/N) log (ni/N)]
Where ni was the total number of individuals of species N was the total number of individuals of all the species on that site.
Concentration of Dominance
was measured by the formula of Simpson Index developed by Simpson, 1949.18
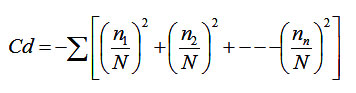
Where N was the total number of individuals of species ni was the total number of individuals of all the species on that site.
Equitability(e)
was calculated as suggested by Pielou (1975)14 as
e = H / In s
Where H is the Shannon – Wiener Index and s = total number of species
Species richness
was calculated by the following equation of Margalef (1958)12
d = s- 1/In N
Where s = number of species, and N =number of individuals of all species
Beta diversity
was calculated as outlined by Whittaker, 1977.21
bd = Sc / s
Where Sc = total number of species in all sites and‘s’ is average species per site.
Results and Discussion
Floristic-diversity analysis and distribution patterns of tree species
The distribution patterns and species composition of existing agroforestry systems viz. agrisilvicultural and agrihorticultural system commonly practiced in Fatehpur was studied.
Floristic- diversity at site–I (Dariyapur) of Fatehpur:
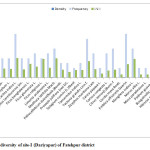
The data pertaining to floristic diversity analysis presented in Table: 1 and graphically illustrated in Figure: 1, shows that dominant and co-dominant species were Acacia nilotica and Azadirachta indica having IVI values of 22.04 and 20.31, respectively. The highest tree density (60 trees ha-1) was also recorded for Acacia nilotica. In horticultural and shrubs species, dominant and co- dominant species were Mangifera indica and Emblica officinalis with their IVI values of 19.23 and 14.02, respectively. The highest tree density (50 trees/ha) was recorded for Emblica officinalis. Total basal cover was recorded markedly higher (5.69 m2/ha) in Ficus religiosa as compared to Madhuca latifolia (5.10 m2/ha). In horticultural and shrub species the basal cover was recorded maximum in case of Mangifera indica (4.99 m2/ha) and Emblica officinalis (0.69 m2/ha).The similar results were also reported by Rawat and Chandhok (2009).16 Among tree species, total forest density ranged from 470 to 600 trees ha-1.
Floristic- diversity at site –II (Alampur) of Fatehpur
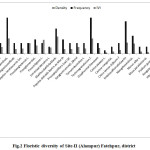
Floristic- diversity analysis data of site-II are presented in Table: 2 and graphically illustrated in Figure: 2, shows that the dominant and co-dominant species were Acacia nilotica and Madhuca latifolia having their values of IVI 24.91 and 23.95, respectively. Acacia nilotica showed highest tree density (60 trees ha-1) among the other species. Total basal cover for tree was recorded comparatively higher in case of Madhuca latifolia (4.86 m2/ha) as compared to Ficus religiosa (4.69 m2/ha). In horticultural and shrubs species, the dominant and co-dominant species were Emblica officinalis and Mangifera indica with their IVI values 15.51 and 14.25, respectively. Emblica officinalis recorded the highest value of tree density (50 trees ha-1). In horticultural and shrubs species, the basal cover was recorded markedly higher in Mangifera indica (2.58 m2/ha) and Emblica officinalis (0.61 m2/ha).
 |
|
 |
|
 |
|
 |
|
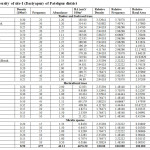
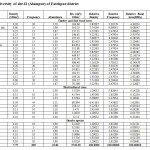
Diversity Index Analysis
Diversity index analysis of vegetation of both sites of the district Fatehpur is presented in Table: 3. A close insight of the data shows that the comparatively higher value of index of dominance (Simpson index) and species diversity (sd) was recorded (0.039) and (0.994) respectively at site –II while lowest (0.934) and (0.032) respectively. In agrihorticultural system highest species of diversity was recorded at site-I (0.330) and lowest at site-II (0.256).
Equitability (e) was found equal value (0.055) in agrisilviculture system at site-I and II whereas in agrihorticulture system the higher value was recorded at site-I (0.36) and minimum in site-II (0.032).
Perusal of data shows that higher species richness was found in agrisilviculture system in site –II (0.154) compared to agrihorticulture system in site –II (0.225). Beta diversity was found highest in agrisilviculture system in site –I (4.176) and lowest at site –II (3.944), whereas in agrihorticulture system it was found highest in site –II (3.875) and lowest at site-I (3.444).
The Shannon-Wiener Index Value (H’) showed that the diversity was almost similar to that in a tropical forest (5.45). H’ value in tropical rain forest generally varies between 5.06 in a young stand to 5.4 in an old stand.11
Table 3: Diversity Index of study sites-I, and II of Fatehpur districts
|
AF system |
Species –Diversity Index (Shannon Index)
|
Simpson Index(Concent-ration of Dominance) |
Species Richness |
Equitability |
Beta Diversity |
|||||
|
Trees |
Shrubs |
Trees |
Shrubs |
Trees |
Shrubs |
Trees |
Shrubs |
Trees |
Shrubs |
|
|
AS/SI |
0.934 |
0.084 |
0.032 |
0.0003 |
0.149 |
0.277 |
0.055 |
0.021 |
4.176 |
3.500 |
|
AS/SII |
0.994 |
0.096 |
0.039 |
0.0002 |
0.154 |
0.357 |
0.055 |
0.024 |
3.944 |
3.500 |
|
AH/SI |
0.330 |
0.047 |
0.008 |
0.0003 |
0.177 |
0000 |
0.036 |
0.023 |
3.444 |
3.000 |
|
AH/SII |
0.256 |
0.038 |
0.003 |
0.000 |
0.225 |
0000 |
0.032 |
0.019 |
3.875 |
3.000 |
Conclusions
In view of the above findings, it is concluded that the IVI was recorded maximum in Acacia nilotica in both the research sites. As far as concerned to maximum value of Concentration of Dominance (Simpson Index), Equitability, Beta diversity and Species diversity, Site-I (Dariyapur) is superior while species richness was found at site –II (Alampur).
Acknowledgment
The authors gratefully acknowledge the School of Forestry and Environment, Allahabad, Sam Higginbottom University of Agriculture, Technology and Sciences, Allahabad for facilitating this experiment and providing basic facilities.
References
- Basha, S.C. (1987).Studies on the ecology of evergreen forests of Kerala with special reference to Silent valley and Attapady. thesis. University of Kerala, Trivandrum .pp.232.
- Bijalwan, A., Sharma, C.M. and Kediyal, V.K. (2011).Socioeconomic status and livelihood support through traditional agroforestry systems in hill and mountain agro-ecosystems of Garhwal Himalaya,India. Indian 137(12) 1423-1431.
- Bijalwan, A., Swami, S.L., Sharma, C.M., Umrao, R. and Paliwal, H.B. (2011).Structure, Composition and diversity of tree vegetation in Sal mixed dry tropical forest in Chhatisgarh plains of India. Indian Forester, 137(4):453-462.
- Curtis, J.T. (1959). The Vegetation of Wisconsin: An ordination of plant communities. University Of Wisconsin press, Madison .65.Curtis, J.T. and McIntosh, R.P. (1950).The interrelationship of certain analytic and synthetic phytosociological characters.Ecology.31:434-455.
CrossRef - Criddle, R.S., Church, J.N., Smith, B.N., Hansen, L.D., 2003. Fundamental causes of the global patterns of species range and richness. Russ. J. Plant Physiol. 50, 192–199.
CrossRef - Gairola, S., Rawal, R.S., Todaria, N.P., 2008. Forest vegetation patterns along an altitudinal gradient in sub-alpine zone of west Himalaya, India. Arican J. Plant Sci. 2 (6), 042–048.
- Henry, M., Tittonell, P., Manlay, R.J., Bernoux, M., Albrecht, A., Vanlauwe, B., 2009. Biodiversity, carbon stocks and sequestration potential in aboveground biomass in smallholder farming systems of western Kenya. Ecosyst. Environ. 129 (1–3), 238–252.
CrossRef - Jose,S..Sreepathy, A., Kumar,B. and Venugopal, V.K.(1994).Structural, Floristic and edaphic attributes of the grassland-Shola forests of Eravikulam in Penunsular India.Eco.Management.65(2-3):279-291.
- Kumar, B.M., 2006. Carbon sequestration potential of tropical homegardens. In: Kumar, B.M., Nair, P.K.R. (Eds.), Tropical Homegardens: A Time-Tested Exam- ple of Sustainable Agroforestry. Advances in Agroforestry 3. Springer, The Netherlands, pp. 185–204.
CrossRef - Knight,D.H.(1975).A phytosociological analysis of species rich tropical forests on Barro Colorado Island,Panama.Monogr,45:259-289.
CrossRef - Marglef, D.R.(1958).Information Theory in Ecology. Year book of the society for General Systems Research, 3:36-71.
- Pathak, P., Hemant Kumar, G., Kumari and Halliru Bilyaminu 2016. Biomass production potential in different species of bamboo in central Uttar Pradesh, The Ecoscan. 10(1and2): 41-43.
- Pielou, E.A. (1975).Ecological Diversity. John Wiley and Sons. New York, pp. 165.
- Rajeev Kumar Ranjan, Hemant Kumar and Rajiv Umrao (2016) Efficacy of oat, berseem and lucerne under Subabul (Leucaena leucocephala) and poplar (Populous deltoides) based silvopastoral system, The Bioscan, 11(4): 2371-2374.
- Rawat, V.S. and Chandhok, A. (2009). Phytosociological analysis and distribution patterns of tree species: A case study from Govind Pashu Vihar, National Park, Uttarakhand.New York Science Journal, 2(4):58-63.
- Shannan,C. and Weaver,W.( 1963). The mathematical theory of communication. University of Illinois press,Urbana,U.S.A.. pp.
- Simpson, E.H. (1949). Measurement of diversity. Nature. pp.163:688.
- Timilsina, N., Ross, M.S., Heinen, J.T., 2007. A community analysis of sal (Shorea robusta) forests in the western Terai of Nepal. For. Ecol. Manage. 241, 223–234
CrossRef - Vidyasagaran, K., Pramod, G. K, and Gopi kumar, K. (2000).Ecological studies in a high land riverine island forest ecosystem, Kuruva, Wynaad.Proc.Symp.on Tropical Forestry Research, Kerala Forest Reseach Institue, Peechi, Kerala.2-4, August.
- Whittaker, R.H. (1977).Evolution of species diversity in land communities.In: Evolutionary Biology, (M.K. Hecht, W.C. Streere and B.Wallace eds.)vol.10, Plenum, New York, pp.1-67.


