Trend Analysis of Rainfall Variability in Western Agro Climatic Zone of Tamil Nadu
R. Pangayar Selvi 2 , S. Panneerselvam 1 and Ga. Dheebakaran 1 *
1
Agro Climate Research Centre,
Tamil Nadu Agricultural University,
Coimbatore,
Tamil Nadu
India
2
Department of Physical Science and Information Technology,
Tamil Nadu Agricultural University,
Coimbatore,
Tamil Nadu
India
http://dx.doi.org/10.12944/CWE.12.1.22
An analytical examination was done to work out the unevenness in point location and time to time variability in rainfall at Coimbatore and Erode district of Western agro climatic zone of Tamil Nadu (India) for 100 years (1916-2015). Simple descriptive statistics along with Co-efficient of Variation (CV) were worked to understand the rainfall variability. The long term mean seasonal and annual rainfall analysis showed that South West Monsoon (SWM) rainfall observed was (176.9 mm) & (257.9 mm) and North East Monsoon (NEM) of (336.9 mm) & (323.3 mm) and annual rainfall of (674.8 mm) & (764.4 mm) at Coimbatore and Erode respectively. The CV for seasonal and annual rainfall showed high dependability status by recording appropriate threshold level of CV for seasonal and annual rainfall.
The time series rainfall data for 100 years were divided into ten year period and the correlation was carried out for the SWM and NEM using Spearman’s rank-order correlation. The results indicated the correlation between two monsoons for Coimbatore (0.14) and for erode (0.07) which indicates that there was less relation between SWM and NEM.
Major emphasis was given to analyse annual and seasonal (SWM and NEM) rainfall time sequence over an extensive time gap to identify probable trend and to measure their implication. For Coimbatore and Erode districts, in both the monsoon seasons and annual analysis revealed an increasing trend for long term (100 years-1916-2015) period.
Copy the following to cite this article:
Kokilavani S, Selvi R. P, Panneerselvam S, Dheebakaran G. Trend Analysis of Rainfall Variability in Western Agro Climatic Zone of Tamil Nadu. Curr World Environ 2017;12(1). DOI:http://dx.doi.org/10.12944/CWE.12.1.22
Copy the following to cite this URL:
Kokilavani S, Selvi R. P, Panneerselvam S, Dheebakaran G. Trend Analysis of Rainfall Variability in Western Agro Climatic Zone of Tamil Nadu. Curr World Environ 2017;12(1). Available from: http://www.cwejournal.org/?p=16975
Download article (pdf) Citation Manager Publish History
Introduction
Trend analysis of rainfall on various scales (spatial and temporal) during the past century derived a vital importance, since the global climate change was studied with the past historical records. The event and uniform distribution of rainfall is considered as prime importance in scheduling and management of water requirement and agricultural production. The deviation in the amount of annual rainfall received in any place has great consequences in planning of irrigation projects for agricultural planning in India. During monsoonal period, it was observed that there are considerable rising trends in the in the frequency and the magnitude of extreme rain events over central India with respect to analysis on high resolution daily gridded rainfall data.
In India, a large spatial and temporal variation in rainfall trend has been reviewed by many authors.5 For Coimbatore district, the historical time scale analysis for monthly and annual rainfall showed that the central and northern parts of the district showed the highest annual rainfall variability and the eastern and south west parts of the district showed decreasing variability8
Knowledge on the regional level of rainfall trend from past data is of importance for agriculture. The victory or failure of crops is strongly linked with rainfall pattern in rainfed agriculture. Hence, the rainfall variability has been an essential part of water resources planning and management.
Using statistical parametric and non-parametric procedures, a significant change over time exhibited by a random variable can be detected. Temporal and spatial variability of climatic parameters can also be studied using statistical approach through the analysis of long term climatic data.7 Climatic variability of time series data can also be investigated using parametric and non-parametric statistical methods.
When the data is normally distributed and is free from outliers, parametric method is employed while non-parametric methods are free from any such hypothesis.2 The parametric t -test has less power than the non-parametric Mann–Kendall test when the probability distribution is skewed.6 For a given confidence level, the Mann–Kendall non-parametric test would confirm the existence of a positive or negative trend. Trends at the annual scale compute the inter-annual variability, which would have a negative or positive tendency. On the other hand, the implications of changes at the seasonal scale are particularly significant for water resource management processes related to seasonal cycles.
Materials and Methods
Over 100 years (1916-2015) of Southwest, Northeast monsoon and annual rainfall for Coimbatore and Erode districts were collected from India Meteorological Department, New Delhi. Simple descriptive statistics along with Co-efficient of Variation were worked to understand the variability nature of rainfall for both the districts. The data was sliced in to thirty years block period- I (1926-1955), II (1956-1985) and III (1986-2015) to understand the trend on monthly and seasonal basis.
The time series rainfall data for 100 years were divided in to ten year period (decade) and the correlation were carried out for the SWM and NEM. The Spearman's rank-order correlation was used to examine the relationship between SWM and NEM rainfall both Coimbatore and Erode district. Mann-Kendall Test (non-parametric) was applied to detect trend magnitude using Trend change detection software.
I Spearman’s Rank Correlation
The spearman rank correlation coefficient is a Pearson correlation calculated from ranks replacing scores. We present the Spearman Rank order correlation coefficients computed between the southwest and the northeast monsoon rainfall. The spearman method first determines the rank order of the sample values of each of the two variables X and Y separately. Then, it transforms the original N ordered pairs of scores to N ordered pairs of ranks. The ranks of the X scores comprise all integers from 1 to N, and similarly for the Y scores. This procedure makes it possible to derive a simple computational formula based on a sum of squared differences between ranks
where D=Rx -Ry , the difference between ranks corresponding to X and Y.
Mann-Kendall Test
This method tests whether there is a trend in the time series data. It is a non-parametric test. The n time series values (X1, X2, X3,…, Xn) are replaced by their relative ranks (R1, R2, R3,…, Rn) (starting at 1 for the lowest up to n).
The Mann-Kendall test statistic is calculated according to
where
sgn(x) = 1 for x > 0
sgn(x) = 0 for x = 0
sgn(x) = -1 for x < 0
If the null hypothesis H0is true, then S is approximately normally distributed with:
μ= 0
σ = n (n – 1) (2n + 5) / 18
The z-statistic is therefore (critical test statistic values for various significance levels can be obtained from normal probability tables):

Result and Discussion
The summary statistics encompasses of mean, standard deviation, skewness, kurtosis and CV were calculated for seasonal (SWM & NEM) and annual rainfall for both Coimbatore and Erode districts and the results were shown in Table 1. The long term mean SWM rainfall (176.9 mm) contribute 26 per cent while NEM rainfall (336.9 mm) contribute 50 per cent of annual rainfall of 674.8 mm at Coimbatore district. The SWM rainfall (257.9 mm) shares 34 per cent whereas NEM rainfall (323.3 mm) shares 42 per cent of annual rainfall of 764.4 mm at Erode district. The CV of SWM, NEM and annual rainfall for Coimbatore districts was 44.4 per cent, 33.4 per cent and 24.5 per cent and for Erode districts was 32.9 per cent, 29.47 per cent and 20.9 per cent respectively. The CV for seasonal and annual rainfall showed high dependability status by recording appropriate threshold level of CV for seasonal and annual rainfall.
Table 1: Summary Statistics for Coimbatore and Erode Districts
|
Districts |
Coimbatore |
Erode |
||||
|
SWM |
NEM |
Annual |
SWM |
NEM |
Annual |
|
|
Mean |
176.9(26%) |
336.9(50%) |
674.8 |
257.9(34%) |
323.3(42%) |
764.4 |
|
Standard Deviation |
76.1 |
108.9 |
167.4 |
66.1 |
92.5 |
149.5 |
|
Kurtosis |
7.5 |
-0.9 |
-0.01 |
-0.7 |
-0.5 |
0.1 |
|
Skewness |
1.9 |
-0.1 |
0.05 |
-0.02 |
0.1 |
0.2 |
|
Coefficient of Variation |
44.4 |
33.4 |
24.5 |
32.9 |
29.5 |
20.9 |
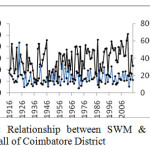
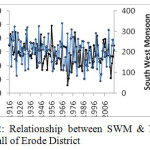
The long term time series data were divided into ten year period (decade) and the correlation were carried out for the SWM and NEM. It was inferred that for an excess or deficit of the southwest monsoon rainfall to be associated with the opposite tendency in the northeast monsoon rainfall1 (Fig.1& 2).
 |
|
 |
|
The strength between two ranked variables can be measured by using Spearman’s correlation coefficient. For a period of ten cycles correlation coefficient were calculated between SWM and NEM and the results were shown in Table 2. The result indicated that negative correlation relationship between SWM and NEM. From the analysis it was identified that a heavy south west monsoon with rainfall above the normal will cause less northeast monsoon with less confidence level.9 The overall correlation between SWM and NEM for Coimbatore district was 0.14 and for erode district it was 0.07 which indicates that there was less relation between SWM and NEM.
Table 2: Correlation Coefficient for South West and North East Monsoon for Coimbatore and Erode district
|
Year |
Length |
Correlation Coefficient |
|
|
Coimbatore |
Erode |
||
|
1916-1925 |
10 |
-0.051 |
-0.062 |
|
1926-1935 |
10 |
-0.178 |
0.117 |
|
1936-1945 |
10 |
-0.079 |
-0.150 |
|
1946-1955 |
10 |
-0.411 |
-0.041 |
|
1956-1965 |
10 |
-0.054 |
-0.386 |
|
1966-1975 |
10 |
0.758 |
0.013 |
|
1976-1985 |
10 |
-0.177 |
-0.051 |
|
1986-1995 |
10 |
-0.263 |
-0.784 |
|
1996-2005 |
10 |
-0.716 |
-0.140 |
|
2006-2015 |
10 |
-0.456 |
-0.236 |
|
1916-2015 |
100 |
0.14 |
0.07 |
Long-term and seasonal trends in monsoon rainfall
The non-parametric Mann-Kendall test is a commonly employed technique to detect monotonic trends in series of climate data.
Coimbatore
The results from the Table 3 showed that during SWM, there observed a trend towards decreasing rainfall in I block period (1926-1955) and there was a significant (5 per cent level) and increasing trend of 2.0mm/year during III block period(1986-2015) and increase in trend in II block period (1956-1985) and long term (100 years-1916-2015) period.
During NEM, there was a significant (5 per cent level) and increasing trend of 2.1mm/year in I block period and a significant (10 per cent level) rising trend of 2.8 mm/year in the long term period. Similarly in the annual analysis, there was a significant (5 per cent level) and increasing trend of 2.3mm/year in I block period and 2.1 mm/year in the long term period. Another study during northeast monsoon rainfall analysis revealed increase in quantity of rainfall in Coimbatore district with slight decrease in rainy day.4
Table 3: Non –parametric Mann-Kendall Test at Coimbatore
|
District |
Test |
SWM |
NEM |
Annual |
|||
|
Coimbatore |
Mann-Kendall Test |
Test statistic |
Result |
Test statistic |
Result |
Test statistic |
Result |
|
1926-1955(I block) |
-1.61 |
NS |
2.08 |
S(0.05) |
2.32 |
S(0.05) |
|
|
1956-1985(II block ) |
0.04 |
NS |
-1.28 |
NS |
-0.32 |
NS |
|
|
1986-2015(III block) |
2.00 |
S(0.05) |
0.59 |
NS |
0.87 |
NS |
|
|
1916-2015 (100 years) |
0.73 |
NS |
2.83 |
S (0.01) |
2.07 |
S (0.05) |
|
Monthly trends
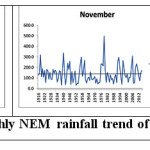
The results from Table 4 and Fig 3 indicated an increasing trend during October for the period for I block period (significant at 5 per cent level) while decreasing trend in rest of the study period. During November, irrespective of all the block period, increasing trend was observed especially for long term period (significant at 5 per cent level). In December, except II block period where decreasing trend in rainfall observed, rest of the period exhibit increasing trend in rainfall. Similar results were observed over Indo Gangetic Region in India.10
Table 4: Monthly trend analysis for three blocks and long term rainfall at Coimbatore
|
Year |
Jan |
Feb |
Mar |
Apr |
May |
Jun |
Jul |
Aug |
Sep |
Oct |
Nov |
Dec |
SWM |
NEM |
Annual |
|
1926-1955 |
↓ |
↓ |
↑ |
↑* |
↑ |
↑ |
↓ |
↓ |
↑ |
↑* |
↑ |
↑ |
↓ |
↑* |
↑* |
|
1956-1985 |
↓ |
↓ |
↓ |
↓* |
↑ |
↓ |
↑** |
↑ |
↓ |
↓ |
↑ |
↓ |
↑ |
↓ |
↓ |
|
1986-2015 |
↓ |
↑ |
↑ |
↑ |
↓ |
↓ |
↓ |
↑ |
↑** |
↓ |
↑ |
↑ |
↑* |
↑ |
↑ |
|
1916-2015 |
↓* |
↓ |
↑ |
↑ |
↑ |
↓ |
↓ |
↑ |
↑ |
↓ |
↑* |
↑ |
↑ |
↑** |
↑* |
↑ increasing trend; ↓ decreasing trend
*significant at 5%, ** significant at 1%.
 |
|
Erode
The results from the Table 5 showed that during SWM, there was a significant (5 per cent level) and increasing trend of 2.0mm/year during III block period and a significant (10 per cent level) rising trend of 1.9 mm/year in the long term period. During NEM, there was a significant (5 per cent level) and increasing trend of 2.0mm/year in I block period and an increasing trend of 2.2 mm/year in the long term period. In the annual analysis, there was a significant (5 per cent level) and increasing trend of 2.3mm/year in III block period and 2.0 mm/year in the long term period. Similar increase in annual trend was observed Over Manjalar Sub-Basin of Vaigai In Tamilnadu.3
Table 5: Non –parametric Mann-Kendall Test at Erode
|
District |
Test |
SWM |
NEM |
Annual |
|||
|
Erode |
Mann-Kendall Test |
Test statistic |
Result |
Test statistic |
Result |
Test statistic |
Result |
|
1926-1955 |
-0.571 |
NS |
1.998 |
S(0.05) |
-1.641 |
NS |
|
|
1956-1985 |
-0.607 |
NS |
-0.892 |
NS |
-0.016 |
NS |
|
|
1986-2015 |
2.031 |
S(0.05) |
0.408 |
NS |
2.303 |
S(0.05) |
|
|
1916-2015 |
1.882
|
S (0.1)
|
2.237
|
S(0.05)
|
2.057
|
S(0.05)
|
|
Monthly trends
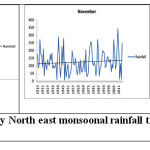
The results from Table 6 and Fig 4 indicated an increasing trend during October for the period for I block period while decreasing trend in rest of the study period. During November, except II block period, an increasing trend was observed especially for I block period (significant at 5 per cent level). In December, where decreasing trend in rainfall was observed (significant at 5 per cent level) for II block period and rest of the period exhibit increasing trend in rainfall.
Table 6: Monthly trend analysis for three blocks and long term rainfall at Erode
|
Year |
Jan |
Feb |
Mar |
Apr |
May |
Jun |
Jul |
Aug |
Sep |
Oct |
Nov |
Dec |
SWM |
NEM |
Annual |
|
1916-1945 |
↓ |
↑ |
↓ |
↑* |
↓ |
↑ |
↓ |
↓ |
↓ |
↑ |
↑* |
↑ |
↓ |
↑* |
↑ |
|
1946-1975 |
↓ |
↓ |
↓ |
↓ |
↓ |
↓ |
↓ |
↑ |
↑* |
↓ |
↓ |
↓* |
↓ |
↓ |
↓ |
|
1976-2015 |
↓ |
↓ |
↑ |
↑ |
↑ |
↓* |
↓ |
↑ |
↑* |
↓ |
↑ |
↑ |
↑* |
↑ |
↑* |
|
1916-2015 |
↓* |
↓ |
↑ |
↓ |
↑ |
↓ |
↓ |
↑ |
↑ |
↓ |
↑ |
↑ |
↑ |
↑* |
↑* |
↑ increasing trend; ↓ decreasing trend
*significant at 5%, ** significant at 1%.
 |
|
Conclusion
The spatial and temporal variability of rainfall at Coimbatore and Erode district for 100 years was assessed using Simple descriptive statistics along with Co-efficient of Variation (CV). The long term mean of South West Monsoon (SWM) rainfall (176.9 mm) contribute 26 per cent while North East Monsoon (NEM) rainfall (336.9 mm) contribute 50 per cent of annual rainfall of 674.8 mm for Coimbatore district. The SWM rainfall (257.9 mm) shares 34 per cent whereas NEM rainfall (323.3 mm) shares 42 per cent of annual rainfall of 764.4 mm for Erode district. The CV for seasonal and annual rainfall showed high dependability status by recording appropriate threshold level of CV for seasonal and annual rainfall. The Spearman’s rank-order correlation between SWM and NEM for Coimbatore district was 0.14 and for Erode district it was 0.07 which indicates that there was less relation between SWM and NEM. Mann-Kendall Test (non-parametric) was applied to detect the trend magnitude. For Coimbatore and Erode districts, in both monsoon seasons and annual analysis revealed an increasing trend for long term (100 years-1916-2015) period.
Acknowledgement
The authors of this paper would like to show appreciation of India Meteorological Department for their assistance to access their record regarding climate data.
References
- Dhar, O. N. and P.R. Rakhecha. ‘Foreshadowing northeast monsoon rainfall over Tamil Nadu’, India, Ameri. Meteorol. Society, p.109,(1983)
- Hamed, K. H. and A. R. Rao. ‘A modified Mann-Kendall trend test for auto-correlated data’. J Hydrol., 204:182-196,(1998)
CrossRef - Janapriya S and Bosu S. Santhana. ‘Analysis of Rainfall Trend Using Statistical Techniques Over Manjalar Sub-Basin of Vaigai In Tamilnadu’, Trends in Bio sci., 21,3390-3395,(2016)
- Kokilavani, S.,Dheebakaran, Ga,Panneerselvam, S. and R. Jagannathan. ‘Impact of climate change on rainfall distribution over western zone of Tamil Nadu’, Proc: In: Climate Change Impacts and Natural Resource Management,328-330, (2016)
- Kumar, V., Jain, S. K and Singh Y. ‘Analysis of long term rainfall in India’, Hydrol. Sci. J.,55(4):484-496, (2010)
CrossRef - Onoz, B. and M.Bayazit. ‘The power of statistical tests for trend detection’.Turkish J. Engg. & Enviro. Sci., 27: 247–251,(2003)
- Patle, G.T., Singh, D. K, SarangiRai, A, Khanna, M. and R. N. Sahoo. ‘Temporal variability of climatic parameters and potential evapotranspiration’. Ind. J. Agrl. Sci., 83 (4): 518-524, (2013)
- Rathod, I.M and S. Aruchamy. ‘Spatial analysis of rainfall variation in Coimbatore district, Tamil Nadu using GIS’, Intl. J. Geomatics and Geosci.,1(10):106-118, (2010)
- Selvaraj, R, S and R. Aditya. ‘Study on Correlation between Southwest and Northeast Monsoon Rainfall over Tamil Nadu’, Univ., J. Enviro., Res., & Tech.,4,578-591, (2011)
- Subash, N and H. S. Ram Mohan. ‘Trend detection in rainfall and evaluation of standardized precipitation index as a drought assessment index for rice–wheat productivity over IGR in India’, Int. J. Climatol, 31, 1694–1709, (2011)


