Water Quality Investigation by Physicochemical Parameters of Satluj River (Himachal Pradesh, India)
Navendu Sharma1 and Yogesh Kumar Walia2 *
1
Department of Chemistry,
Career Point University,
Kota,
Rajasthan
India
2
Department of Chemistry,
School of Basic and Applied Sciences,
Career Point University,
Hamirpur,
Himachal Pradesh
India
http://dx.doi.org/10.12944/CWE.12.1.21
Present investigation was carried out on Satluj river in Himachal Pradesh for the analysis of important physical and chemical water quality parameters during November, 2015 to February, 2016. Parameters such as turbidity, total alkalinity, pH, conductivity, magnesium hardness, biological oxygen demand (BOD), chemical oxygen demand (COD), dissolved carbon dioxide, total hardness, chloride, phosphate, nitrate and calciumwere analyzed from five sampling stations i.e. First Sampling Station (SS-1) – Khab, Kinnaur, Himachal Pradesh; Second Sampling Station (SS-2) – Wangtoo, Near dam site of Karcham Wangtoo Hydroelectric Plant, Kinnaur, Himachal Pradesh;Third Sampling Station (SS-3) – Bayal at the Rampur city, Shimla, Himachal Pradesh; Fourth Sampling Station (SS-4) - Kol dam, Bilaspur, Himachal Pradesh and Fifth Sampling Station (SS-5) - Wajipur Kalan, Ludhiana, Punjab in the study area. The analyses were carried out according to APHA, 2012 procedures. The analysis of data reveals that turbidity, chemical oxygen demand, biological oxygen demand and chlorides were found to be higher than the acceptable limit prescribed by Bureau of Indian standards (BIS), WHO standards. Higher values of these parameters reveal that the pollution in Satluj river is due to siltation, domestic & municipal sewage, industrial sewage and surface run-off that effect the water quality directly or indirectly.
Copy the following to cite this article:
Sharma N, Walia Y. K. Water Quality Investigation by Physicochemical Parameters of Satluj River (Himachal Pradesh, India). Curr World Environ 2017;12(1). DOI:http://dx.doi.org/10.12944/CWE.12.1.21
Copy the following to cite this URL:
Sharma N, Walia Y. K. Water Quality Investigation by Physicochemical Parameters of Satluj River (Himachal Pradesh, India). Curr World Environ 2017;12(1). Available from: http://www.cwejournal.org/?p=16770
Download article (pdf)
Citation Manager
Publish History
Introduction
Water is one of the most important and abundant compounds of the ecosystem. All living organisms on the earth need water for the irsurvival and growth1and2 The quality of water usually described by its physical, chemical and biological characteristics.4and6 India is facing a serious problem of natural resources scarcity, especially that of water in view of population growth and economic development.3,7and12 Most of fresh water bodies all over the world are getting polluted, thus decreasing the portability of water.5,8and9 The river water quality is highly variable by nature due to environmental conditions such as basin lithology, vegetation and climate.5,10and11
The Satluj river is the easternmost tributary of the Indus river and origin is located close to Lake Rakhastal in Tibet in the vicinity of the Kailash Mountain Range. The Satluj river usually runs according to a west to southwest itinerary moving into India via the Shipki La Pass located in Himachal Pradesh after that entered in the Punjab.13 In Satluj river,daily substantial quantity of domestic &municipal sewage etc. are discarded other than industrial effluents, surface run-off and siltation. As no systematic study has been undertaken to assess the water quality of Satluj river with respect to physicochemical parameters.Hence it is planned to analyze the physico-chemical parameters of Satluj river water.
Materials and Methods
In order to assess the water quality of Satluj river, five sampling stations i.e. First Sampling Station (SS-1) – Khab, Kinnaur, Himachal Pradesh; Second Sampling Station (SS-2) – Wangtoo, Near dam site of Karcham Wang too Hydroelectric Plant, Kinnaur, Himachal Pradesh;Third Sampling Station (SS-3) – Bayal at the Rampur city, Shimla, Himachal Pradesh; Fourth Sampling Station (SS-4) - Kol dam, Bilaspur, Himachal Pradesh and Fifth Sampling Station (SS-5) - Wajipur Kalan, Ludhiana, Punjabwere selected on the basis of identified pollution problems and upon the location of points of sources of waste water discharge in the selected stretch of Satluj river. The water samples were collected during winter season in the month of November 2015to February2016. The pH was recorded using digital pH meter (Environmental & Scientific Instruments 111E), turbidity was recorded using digital turbidity meter (Environmental& Scientific Instruments 331E), conductivity was recorded using digital conductivity meter (Environmental & Scientific Instruments 611E) and while remaining physicochemical parameters were measured by the procedure susing standard methods (APHA 2012).19
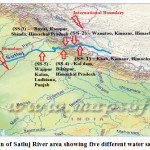 | Figure 1: location of Satluj River area showing five different water sampling stations. Click here to View figure |
Results
The results of various physicochemical parameters recorded during present study at all the five sampling stations are presented in Tables 1, 2, 3 &4.This study for physicochemical specifications of Satluj river water suggests that the various parameters depend upon the chemical hydrology of the study area and also on the different sites from which waste water is released. The results obtained for physicochemical properties during this study were found varied with the standard values for water quality given by World Health Organization, 2011 (WHO),20 Bureau of Indian Standards, 2012 (BIS)21 to classify the polluted sites as per their pollutant load.
The results obtained were analyzed and compared with the WHO, BIS and ICMR standards and discussed in brief. The analysis of data reveals that turbidity, chemical oxygen demand, biological oxygen demand and chlorides were found to be higher than the permissible limit prescribed by WHO, BIS and ICMR.
Discussion
Water Turbidity
Turbidity for the water is an important property, which effects the light penetration.Turbidity is the measure of suspended sediment such as silt, clay, organic matter, and microscopic organisms in water sample. The average value of water Turbidity in study area of Satluj river varies from 9.25 to 298.00 NTU (Tables 1, 2, 3 & 4), which was higher than of 10 mg and 25 mg/l prescribed by BIS, 2012 and ICMR23 respectively. The higher value especially on SS-1was due to confluence of high silt content.
Total Alkalinity
Alkalinity of water is the amount of fragile acid present in it and of the balanced cations across them.15 In present study average value of total alkalinity varied from minimum of 89.25 mg/l at SS-3 to a maximum of 263.75 mg/l at SS-5 within the permissible limit of 600 mg/l prescribed by BIS, 2012.The high values of alkalinity were found in SS-1, SS-2 and SS-5. The high value of alkalinity indicates the presence of weak and strong base such as carbonates, bicarbonates and hydroxides in the water body.
Table 1: Physicochemical analysis of Satluj river during November, 2015.
| S.No. | Parameter | SS-1 | SS-2 | SS-3 | SS-4 | SS-5 |
| 1 | Water Turbidity (as NTU) | 305 | 35 | 158 | 10 | 52 |
| 2 | Total Alkalinity (mg/ltr) | 181 | 100 | 92 | 83 | 367 |
| 3 | pH | 7.74 | 6.65 | 6.71 | 6.34 | 7.17 |
| 4 | Conductivity (?mho/cm) | 508 | 388 | 390 | 190 | 1368 |
| 5 | Magnesium Hardness (mg/ltr) | 26 | 21 | 5.3 | 5.3 | 24 |
| 6 | BOD (mg/ltr) | BDL | 6.2 | BDL | 12 | 41 |
| 7 | COD (mg/ltr) | 80 | 35 | 84 | 38 | 230 |
| 8 | Dissolved Carbon Dioxide (mg/ltr) | 7.9 | 42 | 35 | 40 | 60 |
| 9 | Total Hardness (mg/ltr) | 260 | 167 | 66 | 77 | 319 |
| 10 | Chloride (mg/ltr) | 7.9 | 14 | 26 | 13 | 232 |
| 11 | Phosphate values (mg/ltr) | 0.03 | 2.4 | 3 | 5 | 6.5 |
| 12 | Nitrate values (mg/ltr) | 0.99 | 1.8 | 9 | 2.8 | 28 |
| 13 | Calcium Hardness (mg/ltr) | 62 | 31 | 17 | 22 | 88 |
Table 2: Physicochemical analysis of Satluj river during December, 2015.
| S.No. | Parameter | SS-1 | SS-2 | SS-3 | SS-4 | SS-5 |
| 1 | Water Turbidity (as NTU) | 295 | 21 | 163 | 15 | 76 |
| 2 | Total Alkalinity (mg/ltr) | 184 | 149 | 11 | 121 | 345 |
| 3 | pH | 7.69 | 6.54 | 6.66 | 6.33 | 7.11 |
| 4 | Conductivity (?mho/cm) | 556 | 402 | 395 | 200 | 986 |
| 5 | Magnesium Hardness (mg/ltr) | 28 | 28 | 27 | 5 | 27.7 |
| 6 | BOD (mg/ltr) | 1.5 | 7.4 | 7.1 | 16 | 15 |
| 7 | COD (mg/ltr) | 76 | 26 | 38 | 32 | 158 |
| 8 | Dissolved Carbon Dioxide (mg/ltr) | 7.5 | 25 | 15 | 26 | 45 |
| 9 | Total Hardness (mg/ltr) | 270 | 198 | 220 | 110 | 312 |
| 10 | Chloride (mg/ltr) | 8.4 | 16.6 | 25 | 18 | 189 |
| 11 | Phosphate values (mg/ltr) | 0.02 | 1.34 | 0.02 | 3.88 | 5.45 |
| 12 | Nitrate values (mg/ltr) | 0.44 | 0.8 | 0.6 | 0.45 | 18 |
| 13 | Calcium Hardness (mg/ltr) | 68 | 26 | 36 | 34 | 78 |
Table 3: Physicochemical analysis of Satluj river during January, 2016.
| S.No. | Parameter | SS-1 | SS-2 | SS-3 | SS-4 | SS-5 |
| 1 | Water Turbidity (as NTU) | 290 | 5 | 174 | 6 | 80 |
| 2 | Total Alkalinity (mg/ltr) | 196 | 191 | 156 | 126 | 178 |
| 3 | pH | 7.79 | 6.36 | 6.57 | 6.12 | 6.92 |
| 4 | Conductivity (?mho/cm) | 607 | 368 | 327 | 227 | 903 |
| 5 | Magnesium Hardness (mg/ltr) | 28 | 34 | 32 | 3 | 21 |
| 6 | BOD (mg/ltr) | BDL | 8 | 8 | 18 | 1.9 |
| 7 | COD (mg/ltr) | 80 | 35 | 84 | 38 | 230 |
| 8 | Dissolved Carbon Dioxide (mg/ltr) | 7 | 6 | 6 | 1.2 | 27 |
| 9 | Total Hardness (mg/ltr) | 280 | 240 | 280 | 120 | 245 |
| 10 | Chloride (mg/ltr) | 9.6 | 19 | 9.6 | 21 | 126 |
| 11 | Phosphate values (mg/ltr) | 0.01 | 0.01 | 0.01 | 0.02 | 2.16 |
| 12 | Nitrate values (mg/ltr) | 0.102 | 2.73 | 0.1 | 0.85 | 17 |
| 13 | Calcium Hardness (mg/ltr) | 72 | 18 | 42 | 36 | 62 |
Table 4: Physicochemical analysis of Satluj river during February, 2016.
| S.No. | Parameter | SS-1 | SS-2 | SS-3 | SS-4 | SS-5 |
| 1 | Water Turbidity (as NTU) | 302 | 11 | 176 | 6 | 65 |
| 2 | Total Alkalinity (mg/ltr) | 173 | 154 | 98 | 91 | 165 |
| 3 | pH | 7.77 | 6.89 | 6.69 | 6.12 | 6.99 |
| 4 | Conductivity (?mho/cm) | 443 | 267 | 287 | 210 | 398 |
| 5 | Magnesium Hardness (mg/ltr) | 18 | 27 | 28 | 2 | 16 |
| 6 | BOD (mg/ltr) | 1.2 | 9 | 8 | 16 | 1.8 |
| 7 | COD (mg/ltr) | 80 | 35 | 84 | 38 | 230 |
| 8 | Dissolved Carbon Dioxide (mg/ltr) | 6.8 | 6 | 5.6 | 2.1 | 29 |
| 9 | Total Hardness (mg/ltr) | 278 | 220 | 245 | 102 | 188 |
| 10 | Chloride (mg/ltr) | 9.6 | 19 | 9.6 | 21 | 126 |
| 11 | Phosphate values (mg/ltr) | 0.01 | BDL | 0.01 | 0.02 | 2.11 |
| 12 | Nitrate values (mg/ltr) | 0.2 | 0.9 | 0.1 | 0.63 | 14 |
| 13 | Calcium Hardness (mg/ltr) | 70 | 26 | 44 | 40 | 57 |
pH
pH is used for evaluating the acid-base balance present in water. pH is correlated with electrical conductance and total alkalinity. The higher value of pH recommend that carbon dioxide, carbonate-bicarbonate equilibrium is affected more due to change in physico-chemical condition.14 In the present study pH varied from neutral to alkaline i.e. 6.22 to 7.74 maximum at SS-1 and minimum at SS-4. It is found that river water is slightly acidic; it may be due to addition of domestic, municipal sewerages and also agricultural wastes. The results show that these values are below the maximum permissible limit.
Conductivity
The conductivity is numerical expression of water’s ability to conduct electric current and depends on the concentration of ions in solution. Conductivity measurement is an excellent indicator of TDS, which is a measure of salinity that affects the taste of potable water. In present study, the average value of conductivity of Satluj river water varies from 206.75 to 913.75 ?mho/cm minimum at SS-4, and maximum at SS-1. It was seen that the maximum conductivity at SS-1 which can be attributed to excess silts.
Magnesium Hardness
Magnesium hardness contributes both carbonate and non carbonate hardness to water.3 The average value of magnesium in study area of Satluj river varies from 3.82 to 27.50 mg/l, minimum is at SS-4, and maximum is at SS-2, which was within the permissible limit of 100 mg/l prescribed by BIS, 2012.
Biochemical Oxygen Demand (BOD)
BOD test help to measure the amount of biodegradable organic material of water sample.3 In the present study the BOD of water sample was varied between 7.65 to 15.50 mg/l with minimum at SS-2 and maximum at SS-4. The unpolluted water has BOD value of 3 mg/l or less and polluted water has BOD value higher than 25mg/l. The value of BOD in the present study was highest in SS-4 which indicates that the river is polluted.
Chemical Oxygen Demand (COD)
Chemical Oxygen Demand is amount of oxygen required for the oxidation of oxidizable organic matter.3 Chemical Oxygen Demand of river varies from 34.25 to 121.75 mg/l, minimum is at SS-2 and maximum is at SS-5. A trend of increasing COD level was observed at SS-1, SS-3 and SS-5 showing the population load and activities caused by the mixing of sewage water, garbage dumping and industrial discharges. This increase in COD indicates that the pollution may increase and hence need exercise for monitoring and control.
Dissolved Carbon Dioxide (CO2)
Dissolved Carbon dioxide is the end product of organic carbon degradation in almost all aquatic environments and its variation is often a measure of net ecosystem metabolism.16and17Dissolved CO2 of Satluj river varies from 7.30 to 40.25 mg/l, minimum is at SS-1, and maximum is at SS-5.
Total Hardness
Total hardness of the water expresses the role of dissolved minerals specially in terms of Calcium and Magnesium which determines the suitability of water for various purposes such as domestic, industrial, drinking etc. and applied to the presence of bicarbonates, sulphates, chlorides and nitrates of both calcium and Magnesium.18 The observation of total hardness reveals that Hardness of the river water fluctuated between 102.25 to 272.00 mg/l with minimum at SS-4 and Maximum at SS-1. The results indicate that the Satluj river is hard based on water hardness classification showing their less suitability for drinking and industrial purposes.
Chloride
Chloride in river water are mainly due to the presence of sediments, sewage and industrial effluents.In present study the values of chloride varied between 8.75 to 150.75 mg/l with minimum at SS-1 and Maximum at SS-5. BIS, 2012 prescribed the permissible limit of chloride is as 250 mg/l.Chloride concentration in Satluj river water are within prescribed limit.
Phosphate
The main sources which increase the phosphorous load in river water areuse of fertilizers, use of detergents and domestic sewage.22 The value of Phosphate in water of river varies from 0.01 to 4.05 mg/l, minimum is at SS-1, and maximum is at SS-5. The BIS, 2012 suggested the limit of phosphate is 0.1mg/l. The higher value at SS-5 may be due to addition of domestic, municipal sewerages and also agricultural wastes.
Nitrate
The value of nitrate in water of river varies from 0.43 to 19.25 mg/l, minimum is at SS-1, and maximum is at SS-5, which was within the acceptable limit prescribed by BIS, 2012 and WHO, 2011 respectively. Basic source of nitrates is nitrogen which is constituent of proteins, chlorophyll and many other biological compounds.5
Calcium
Calcium is mainly the micronutrient which present in an aquatic environment. The hardness of the river water is of chief significance in connection with the discharge of the sewage and industrial pollutants, as shown by variations in the concentration of the hardness of the water.Calcium causes both carbonate and non carbonate hardness of water.3 The average value of calcium in study area of Satluj river varies from 25.25 to 71.25 mg/l, minimum is at SS-2, and maximum is at SS5-, which was within the acceptable limit. This concentration of calcium in river water may be due to occurrence of highly soluble halides, gypsum and easily weathered surface rocks.
Acknowledgement
The authors are thankful to Managing Director, Environ tech Laboratory, Mohali, Punjab, India and Career Point University, Hamirpur, H.P., India for providing necessary laboratory facilities to carry out these investigations.
References
- Sharma, V.; Walia, Y. K.; Kumar, A. Assessment of Physico Chemical Parameters for Analysing Water: A Review. Biol. Chem. Chron., 2(1): 25-33 (2015)
- Sharma, V.; Walia, Y. K. Analysis of water quality using physico-chemical parameters of Govind Sagar Lake H.P. (INDIA).Asian J. of Adv. Basic Sci.,2(3): 83-91 (2014)
- Sharma, V.; Walia, Y. K. Water Quality Assessment using Physico-Chemical Parameters and Heavy Metals of Govind Sagar Lake, Himachal Pradesh, India. World Environ., 10 (3): 967 – 974 (2015)
CrossRef - Sharma,V.; Walia, Y. K. Water quality assessment of Gobind Sagar Lake during rainy season in Himachal Pradesh, Biological Forum.,8(1): 559-564 (2016).
- Sharma S. and Walia Y. K. Water Quality Assessment of River Beas during Winter Season in HimachalPradesh, India. World Environ.,11(1): 194-203(2016)
CrossRef - Sharma R. K., Soni D. K. and Agrawal N. A study on physico-chemical parameters of Dah lake water, District-Ballia (U.P.), India. Journal of Applied and Natural Science., 4(2):237-240 (2012)
- Garg R. K., Rao R. J. and Saksena D. N. Water quality and conservation management of Ramsagar reservoir, Datia, Madhya Pradesh. Environ Biology, 30(5): 909-916 (2009)
- Gupta S. K., Dixit S. and Tiwari S. Assessment of Heavy Metals in Surface water of lower Lake, Bhopal. Poll Res., 24(4): 805-808 (2005)
- Ndamitso M. M., Idris S., Likita M. B., Jimoh O., Tijani A. I., Ajai A. A. and Bala M. Physico-chemical and Escherichia coli assessment of selected sachet water produced in some areas of minna, nigar state, Nigeria. International journal of water resources and Environmental Engineering, 5(3): 134-140 (2013)
- Usha Moza and Mishra, D. N. River Beas Ecology and Fishery,Central Inland Fisheries Research Institute, 150 (2007)
- Ashu, A. and Parveen, T. Water Quality Assesment of Three Tributaries of Beas Drainage System in Himachal Pradesh in Upper Reaches of Himalayan Region. Biological Forum-An International J., 2(1): 63-66 (2010)
- Shivayogimath C. B., Kalburgi P. B., Deshannavar U. B. and Virupakshiah D. B. M. Water Quality Evaluation of River Ghataprabha, India, Res. J. Environment Sci, 1(1): 12-18.
- CPCB (Central Pollution Control Board).Status of water Quality in India, MINARAS /35 2013-14 (2012)
- Karanth K. R. Groundwater Assessment Development and Management, Tata McGraw Hill publishing company Ltd., New Delhi, 725-726 (1987)
- Sverdrup H.H, Johnson M. W. and Fleming R. H. The Oceans: Their physics, chemistry and general biology. Prentice Hall, New York. (1942)
- Smith S. V. and Hollibaugh J. T. Annual cycle and interannual variability of ecosystem metabolism in a temperate climate embayment, Ecology/Ecological Monographs,67: 509 (1997)
CrossRef - Hopkinson, C. S. Shallow-water and pelagic metabolism: Evidence of heterotrophy in the near-shore Georgia Bight, Marine Biology, 87: 19 (1985)
- Taylor E.W. The examination of water and water supplies. and A Churchill Ltd, London (1949)
CrossRef - APHA Standard methods for the examination of water and wastewater. 22nd Edn., Washington, DC (2012)
- WHO, Recommendations, Water andSanitation. Guidelines for Drinking WaterQuality, Vol.1. Geneva: WHO (1984)
- BIS (Bureau of Indian Standards), Drinking water – Specification IS 10500: 2012, New Delhi, India(2012)
- Golterman H.L., Physiological Limnology Elsveri Scientific Publication Co. N.Y. 489, (1975)
- ICMR, Manual of Standards of Quality for Drinking Water Supplies, Indian Council of Medical Research, Spl. Rep. No. 44: 27 (1975)


