Assessment of Seasonal Views Based on Landscape Perception: the Case of Ktu Kanuni Campus
Emine Tarakci Eren1
*
 and Tuğba Düzenli1
1
Department of Landscape Architecture,
Karadeniz Technical University,
61080
Trabzon
Turkey
http://dx.doi.org/10.12944/CWE.12.2.01
The present study aims to discuss the expert views on different seasonal scenery in campus areas in assessment of visual landscape perception. For this purpose, photographs of the said areas were taken on snowy days and other days in 2016 and 2017. The basic material of the study included 14 photographs depicting spring and winter views of the 7 areas in Karadeniz Technical University (KTU) campus. A survey study was conducted on photographic images with a group of participating landscape architecture students, and the differences in visual perception and visual characteristics of the most preferred seasonal views were discussed. As a result, it was observed that there were differences between the visual assessments of different seasonal views of the campus areas. Study findings demonstrated that there were differences between visual perceptions based on all adjective pairs and groups. This finding supported the fact that selected campus sites had different values. Based on the study findings, the landscape components (structural and vegetative) in the views differed based on features such as size, shape, color and texture, resulting in higher positive scores for the spring views.
Copy the following to cite this article:
Eren E. T, Düzenli T. Assessment of Seasonal Views Based on Landscape Perception: the Case of Ktu Kanuni Campus. Curr World Environ 2017;12(2). DOI:http://dx.doi.org/10.12944/CWE.12.2.01
Copy the following to cite this URL:
Eren E. T, Düzenli T. Assessment of Seasonal Views Based on Landscape Perception: the Case of Ktu Kanuni Campus. Curr World Environ 2017;12(2). Available from: http://www.cwejournal.org/?p=17129
Download article (pdf) Citation Manager Publish History
Introduction
Previous studies on visual landscape assessment mainly involved landscape perception and preference. The visual landscape assessment queries the extent landscape meets a set of specified criteria. In landscape perception assessment, these criteria generally include aesthetic or landscape preferences.1,2 The concept of aesthetics has often been ignored by rational planners.3 Contrary to basic planning approaches, visual assessment studies attempt to integrate esthetics into planning, design and management. The social scientists pioneered studies in this field, mostly in environmental psychology, rural sociology and geography. The main focus in these studies was to define the landscaping or environmental features and to measure their value.
According to Tveit et al. (2001), visual landscape assessment is a common product of visible landscape features that interact with the observer's psychological (perceptual, cognitive, emotional) processes.4 Visual landscape assessment could be defined as "relative aesthetic perfection in a landscape" and could be measured through the observer's predilection.5 While certain studies on visual landscape quality evaluation6-10 examined the favorable correlation between predilection and various visual landscape features during the last 30 years, some other studies11,12 investigated the relationship between perceptual and physical, conceptual characteristics. Generally, these studies investigated the correlation between landscape views and physical, psychological, administrative, demographic and conceptual characteristics.13-21 A study by Kaplan (1987) on preferences for natural and urban views also demonstrated that individuals preferred natural views over urban views.22
The present study aimed to reveal the differences in visual perception based on seasons to conduct the visual landscape assessment for the views in certain parts of the KTU Kanuni Campus in Trabzon provincial center. Furthermore, the study aimed to determine which seasonal view was preferred the most.
Material and Methodology
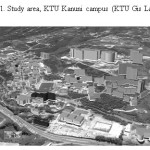
A wide variety of methods have been used to determine the impact of visual perception on individuals’ visual landscape assessment and preferences. These methods are based on the evaluation of the images presented to the participants using specific scales.23-25 In these studies, shapes, photographs and computer simulations were used for visual evaluation.26-28 In the present study participants were presented with different photos of different seasonal views of campus areas for assessment (Figure 1).
 |
|
Study Area
Karadeniz Technical University Kanuni campus, located within the borders of Trabzon province in the Eastern Black Sea region in Turkey, was selected as the study area (40 ° 33'N- 41 ° 07 'N, 37 ° 07' E 40 ° 30 'E). Trabzon, the third largest province in the region, has a population of 250,000 and a surface area of 190 km2. The altitude in Trabzon is 37 m, annual precipitation is 760 mm and the average temperature is 14.6 ° C. The study area is presented in Figure 1.
Photographs
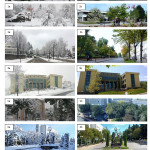
Photographs presented for the evaluation of the participants in the present study are photos taken during the winter and spring seasons in certain areas in Karadeniz Technical University Kanuni Campus (Table 1). Photos were taken with 8-megapixel digital camera. Two images of the same area were taken from the same spot in the winter and spring seasons and at the same time of the day.
Table 1: Areas that were subject to visual assessment
|
1 |
Rectorate Building environs |
|
2 |
Library Building environs |
|
3 |
Campus main transportation axis environs |
|
4 |
Landscape architecture department environs |
|
5 |
Economic and Administrative Sciences department environs |
|
6 |
Campus main transportation axis central refuge |
|
7 |
Campus main entrance environs |
Assessment of the photographs
Photographs were evaluated by 165 KTU Landscape Architecture department students. Among the photographs taken in two different seasons in the same area, the winter photographs were coded with an “a” and the spring photographs were coded with a “b”. Accordingly, photographs taken in area 1 on winter were coded as “1a” and those taken in the same area on spring were coded as “1b” and so on. The same coding method was conducted for the photographs taken in 7 different areas that would be evaluated (Table 2).
 |
|
In the study, to measure the perceptual differences, "Semantic Differential" technique was utilized.28 Based on the technique, twelve exactly opposite adjective pairs were selected to evaluate the photographs. In selection and grouping of the adjective pairs, the study by Summit and Sommer (1999) was utilized.29 Based on this study, the following adjective pairs were selected: admirable / disliked, attractive / repulsive, relaxing / disturbing, not impressive / unimpressive, interesting / boring, dynamic / monotonous, regular / irregular, pretentious / unpretentious, legible / illegible, plain / complex. The participants were asked to evaluate the presented photographs on a scale of “-2, -1, 0, 1, 2” for each adjective pair. To facilitate the assessment of the questionnaires in the computer environment “-2, -1, 0, 1, 2” values were translated to a 5-point Likert scale where 1 (very little), 2 (little), 3 (fair), 4 (good), 5 (very good).
Findings
Demographics
A survey was conducted with 165 KTU landscape architecture students to reveal the differences between the preferences and perceptions of seasonal changes in the views of campus spaces. 39% of the respondents were male, 61% were female.
Visual Preference Levels on Campus Views
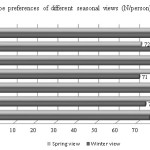
In this section, two seasonal views of seven different campus areas were presented to the participants to determine the campus view preference levels. As a result, it was determined that the spring views were preferred among the spring and winter views of the 7 areas. Spring views for the photographs of the first, second, fourth and seventh regions were preferred. Winter views were preferred for photographs of the third, fifth and sixth regions.
Survey results demonstrated that the spring views were preferred among the photographs of the spring and winter views of the 7 campus areas. However, there was no significance difference. Because the preferences and scores given by the 165 respondents were very similar.
For example, 165 participants who evaluated the winter and spring views ;
- the first area, 89 preferred the spring view and 76 preferred the winter view.
- the second area; 91 preferred the spring view and 74 preferred the winter view.
- the third are; 79 preferred the spring view and 86 preferred the winter view.
- the fourth are; 94 preferred the spring view and 71 preferred the winter view.
- the fifth area, 83 preferred the spring view and 82 preferred the winter view.
- the sixth area, 72 preferred the spring view and 93 preferred the winter view.
- the seventh area, 88 preferred the spring view and 77 preferred the winter view.
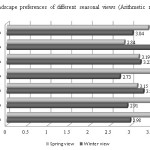
As a result, the spring view of 4 areas and the winter view of 3 areas were preferred among the spring and winter views of 7 different areas (Figure 2). The arithmetic mean of participant evaluations of these areas are presented in Figure 3.
 |
|
 |
|
Perceptive Difference Levels for Campus Views Determined with Semantic Differential Technique
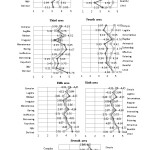
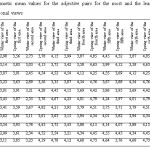
In this section, arithmetic means for adjective pairs were used to evaluate the seasonal views of the campus spaces based the perceptual processes of the participants (Table 3, Table 4).
Based on the analysis of the conducted assessments, the differences between arithmetic mean values revealed that there was a perceptual difference. Because spring view, which was the most liked view of the first area, scored 3.85 for the liked/disliked adjective pair, 3.61 for the ugly/attractive adjective pair, 3.95 for the attractive/ugly adjective pair, 3.81 for the relaxing/repellent adjective pair, 3.59 for the effective/ineffective adjective pair, 3.87 for the boring-interesting adjective pair, 3.91 from the monotonous-animated adjective pair, 3.63 for the regular-irregular adjective pair, 3.91 from the modest-ostentatious adjective pair, 3.83 for the illegible/legible adjective pair, and 3.56 from the complex-simple adjective pair. Analysis of the assessment of adjective pairs for the winter view of the first field demonstrated that the scores for all adjective pairs were lower than those of the spring view. The second field received higher values for the spring view when compared to the winter view as well. The differences between the views of spring and winter were higher when compared to that of the first area. The most liked spring view of the second area received the highest positive score of 4.82 for the boring-interesting adjective pair. The lowest positive score was 3.61 for the repellent/relaxing adjective pair. The lowest negative values for all areas were found for the winter views of the second field; 2.35 for the boring-interesting adjective pair and 2.34 for the ugly-attractive adjective pair, 2.73 for the complex-simple adjective pair, 2.45 for the modest-ostentatious adjective pair, and 2.89 for the regular/irregular adjective pair. In the third area, the winter view, which was the most admired image, received the highest positive score of 4.78 for the liked-disliked adjective pair. The lowest score was 3.35 for the irregular-regular adjective pair. The spring image, which was the most liked view of the fourth field, had the highest positive score of 4.85 for the complex-simple adjective pair. The most liked and preferred winter view of the fifth area received the highest score of 4.64 for the liked-disliked adjective pair. The most favored spring view of the sixth area received the highest positive score of 4.85 for the complex-simple adjective pair. The most preferred spring view of the seventh area received the highest positive score of 4.54 for the boring-interesting adjective pair.
 |
|
 |
|
Results and Discussion
The present study examined the changes in the visual perception of certain spaces due to the seasonal changes in KTU Kanuni campus located at Trabzon urban center. For this purpose, the study was conducted with the students attending KTU Landscape Architecture department. It was considered that the reasons and the assessments would be more reliable if they had prior knowledge about the spaces and campus surroundings. However, although there are previous studies that supported this view, there are other studies that advocated that assessments should be conducted by non-experts. Hess and King (2001) argued that expert assessments improves the reliability of the studies, while Misgav (2000) claimed that assessments of the actual users were more realistic.30,31 KTU Landscape Architecture students were considered as assessors that fit both categories since they are both experts and users who live in Trabzon. In the present study, two different seasonal images of 7 different campus locations were used. Study findings demonstrated that there were differences between visual perceptions based on all adjective pairs and groups. This finding supported the fact that selected campus sites had different values. Based on the study findings, the landscape components (structural and vegetative) in the views differed based on features such as size, shape, color and texture, resulting in higher positive scores for the spring views. For example, foliage, flower, stem, and fruit characteristics of plants affected the participant assessments. The perception of color in the winter views were increasingly weaker. As the photos were painted by the snow, the whole images were perceived as black and white, and visual features such as size, shape, color and texture cannot be perceived adequately since all the landscape was covered with snow. Thus, when the seasonal views were examined, it was observed that spring images received high perceptual scores. Therefore, these findings demonstrated that there were perceptual differences in the seasonal views of open spaces in the campus influenced the visual preference.
Conclusions
In conclusion, the effects of seasonal changes of the campus views on visual perception were determined with this research. However, it is known that not only the seasons but also several other effects are important in the perception of the views. In order to get more realistic results, not only the students but also the public should be questioned. Also this study is a preliminary work with landscape concern; it can been carried out globally.
Results showed that seasonal effects of landscape views is a visual event and effects perception of people. So, landscape designers and operators should be evaluated that in their landscape projects and applications.
References
- Gobster, Paul H., et al. "The shared landscape: what does aesthetics have to do with ecology?." Landscape ecology 22.7 959-972, (2007).
- Tempesta, Tiziano. "The perception of agrarian historical landscapes: A study of the Veneto plain in Italy." Landscape and Urban Planning 97.4 258-272, (2010).
- Berleant, Arnold. "Living in the landscape: Towards an aesthetics of environment." (1998).
- Tveit, Mari, Åsa Ode, and Gary Fry. "Key concepts in a framework for analysing visual landscape character." Landscape research 31.3 229-255, (2006).
- Arriaza, M., et al. "Assessing the visual quality of rural landscapes." Landscape and urban planning 69.1 115-125, (2004).
- Daniel, Terry C., and Joanne Vining. "Methodological issues in the assessment of landscape quality." Behavior and the natural environment. Springer US,. 39-84, (1983).
CrossRef - Roth, Michael. "Validating the use of Internet survey techniques in visual landscape assessment—An empirical study from Germany." Landscape and urban planning 78.3: 179-192, (2006).
CrossRef - Zube, Ervin H., James L. Sell, and Jonathan G. Taylor. "Landscape perception: research, application and theory." Landscape planning 9.1: 1-33, (1982)
CrossRef - Dearden, Philip. "A statistical technique for the evaluation of the visual quality of the landscape for land-use planning purposes." Journal of Environmental Management 10.1 51-68, (1980).
- Lothian, Andrew. "Landscape and the philosophy of aesthetics: is landscape quality inherent in the landscape or in the eye of the beholder?." Landscape and urban planning 44.4 177-198, (1999).
- Kaplan, A, and Hepcan Ç. C. Ege Üniversitesi Kampüsü ‘Sevgi Yolu’nun Görsel (Etki) DeÄŸerlendirme Çalışması. Ege Üniversitesi Ziraat Fakültesi Dergisi 41.1 159-167, (2004)
- Özçelik, M. Peyzaj Mimarlığında Üç Boyutlu Modelleme TekniÄŸinin Görsel DeÄŸerlendirmede Kullanımı. Yüksek Lisans Tezi. Ä°stanbul Üniversitesi, Fen Bilimleri Enstitüsü, Peyzaj Mimarlığı Anabilim Dalı. Ä°stanbul, (2010).
- Dramstad, Wenche E., et al. "Relationships between visual landscape preferences and map-based indicators of landscape structure." Landscape and urban planning 78.4: 465-474, (2006).
CrossRef - Daniel, Terry C. "Whither scenic beauty? Visual landscape quality assessment in the 21st century." Landscape and urban planning 54.1: 267-281, (2001).
CrossRef - Schroeder, H., and. Daniel T. C . Progress in predicting the perceived scenic beauty of forest landscapes. Forest Science 27.1 71-80, (1981).
- Brown, T. C., and Daniel T.C Predicting scenic beauty of timber stands. Forest Science 32.2 471-487, (1986).
- Clay, G. R., and. Daniel T. C. Scenic landscape assessment: the effects of land management jurisdiction on public perception of scenic beauty. Landscape and urban planning 49.1: 1-13, (2000).
CrossRef - Tyrväinen, L., Silvennoinen H., and Kolehmainen, O. "Ecological and aesthetic values in urban forest management." Urban Forestry & Urban Greening 1.3 135-149, (2003).
- KıroÄŸlu, E. Erzurum Kenti ve Yakın Çevresindeki Bazı Rekreasyon Alanlarının Görsel Peyzaj Kalitesi Yönünden DeÄŸerlendirilmesi. Fen Bilimleri Ens s 186 (2007).
- Beza, B. B. The aesthetic value of a mountain landscape: A study of the Mt. Everest Trek. Landscape and Urban Planning 97.4 306-317, (2010).
- Bulut, Z, and Yilmaz H. The current situation of threatened endemic flora in Turkey: Kemaliye (Erzincan) case. Pak. J. Bot 42.2 711-719, (2010).
- Kaplan, Stephen. "Aesthetics, affect, and cognition environmental preference from an evolutionary perspective." Environment and behavior 19.1 3-32, (1987).
- Shelby, B., and Harris.R. Comparing methods for determining visitor evaluations of ecological impacts: Site visits, photographs, and written descriptions. Journal of leisure research 17.1: 57-67, (1985).
- Anderson, L M. Land use designations affect perception of scenic beauty in forest landscapes. Forest Science 27.2: 392-400, (1981).
- Hull, R. B., and Stewart. W. P. Validity of photo-based scenic beauty judgments. Journal of Environmental Psychology 12.2 101-114, (1992).
- Habron, D. Visual perception of wild land in Scotland. Landscape and urban planning 42.1: 45-56, (1998).
CrossRef - Tyrväinen, L., and Tahvanainen L. Using computer graphics for assessing the aesthetic value of large-scale rural landscapes. Scandinavian Journal of Forest Research 14.3: 282-288, (1999).
CrossRef - Osgood, C. E.; Suci, G. J.; Tannenbaum, P. H. The Measurement of Meaning. New York: The University of Illinois Press, (1957).
- Summit, J, and Sommer R. Further studies of preferred tree shapes. Environment and Behavior 31.4: 550-576, (1999).
CrossRef - Hess, G R., and King. T J. Planning open spaces for wildlife: I. Selecting focal species using a Delphi survey approach. Landscape and Urban Planning 58.1: 25-40, (2002).
CrossRef - Misgav, A. Visual preference of the public for vegetation groups in Israel. Landscape and Urban Planning 48.3: 143-159, (2000).
CrossRef


