Assessment of Source Profile of Nonmethane Hydrocarbon in the Ambient Air of Metro City Delhi, India
Ram Pravesh Kumar1 * , Alok Kumar Pandey1 , Ritesh Kumar2 , Prabhat Kashyap1 and Krishan Kumar1
http://dx.doi.org/10.12944/CWE.12.2.16
In this paper presents the assessment of source profile of nonmethane hydrocarbons (NMHCs) in the ambient air of Delhi. The samples were collected from five different urban sites using tedlar bags for aliphatic NMHCs and activated adsorption charcoal tubes for aromatic NMHCs during October 2014 to September 2015. Eleven aliphatic NMHCs propane, n-butane i-butene, i-butane, 1,3-butadiene, trans-2-butene, cis-2-pentene, n-pentane, n-hexane, heptane and four aromatic NMHCs benzene, toluene, o-xylene, p/m-xylene were identified in 112 urban ambient air samples. Samples were analysed using gas chromatography which is coupled with flame ionization detector (GC-FID). Pearson correlation coefficient (r) found to be = 0.5±0.2, shows significance level to have moderate among the NMHCs, indicates NMHCs in the urban ambient air have many sources profile mentioned in PCA result. Factor analysis(FA) and receptor model, i.e., Principal Component Analysis(PCA)/Absolute Principal Component Score (APCS) was used for identification of source profile distribution. PCA analysis after the varimax rotation have identified six possible source profile and explained about 70 % of the total dataset. The average % contribution of NMHCs emitted from vehicles was found to be 23%, whereas polymer manufacturing industries contributes 19% and from refinery operation/ gas station contribute 14%, and 13%, emitted from flare emissions and 10% from natural gas emissions. The secondary industrial process, including paints, body soaps and metal fabricator and processing was contributing 8%. Out of these remaining 13% was estimated as unidentified sources. These findings may be used by government authorities to formulate policies and strategies for improvement of urban air quality that can improve the health of urban communities.
Copy the following to cite this article:
Kumar R. P, Pandey A. K, Kumar R, Kashyap P, Kumar K. Assessment of Source Profile of Nonmethane Hydrocarbon in the Ambient Air of Metro City Delhi, India. Curr World Environ 2017;12(2). DOI:http://dx.doi.org/10.12944/CWE.12.2.16
Copy the following to cite this URL:
Kumar R. P, Pandey A. K, Kumar R, Kashyap P, Kumar K. Assessment of Source Profile of Nonmethane Hydrocarbon in the Ambient Air of Metro City Delhi, India. Curr World Environ 2017;12(2). Available from: http://www.cwejournal.org/?p=17168
Download article (pdf) Citation Manager Publish History
Introduction
In the urban atmosphere nonmethane hydrocarbons (NMHCs) are most important groups of air pollutants.1 It is an important precursor of ground level ozone (O3)2–6 and peroxy acyl nitrates (PAN) formation which can injurious to human health and vegetation.7–11 These NMHCs are emitted from both anthropogenic and natural sources in the ambient atmosphere. Thus, major anthropogenic sources are fossil fuel combustion12 automobile exhaust, industrial processes,1 liquefied petroleum gases (LPG) petroleum distillation and fuel evaporation and solvent use13 and biomass burning.6,14–17 Besides of anthropogenic sources, vegetation is the major contributors of biogenic NMHCs.18,19 For instance, isoprene is the most important biogenic source of NMHCs in the rural areas.1,7,20 Other sources of biogenic NMHCs includes oceanic emissions21 and those from microbial production22. In the urban areas, NMHCs levels are largely govern by the various factors including motor vehicle type/ages, fuels used by the vehicles, flow rate, speed of traffic, road condition and human activities, seasonal variability6,14,23 and environmental conditions.14,24 However, emissions of aromatic organic hydrocarbons (i.e., aromatic, olefin and other organic compound) are increases by fuel used in the vehicles especially from without catalytic converter.25 For this, Liu et al26 has reported that the gasoline fuel and automobile exhausts are the significant emitters of aromatic organic hydrocarbons. These aromatic hydrocarbons such as benzene, toluene and xylene isomers are present in abundant in the urban atmosphere.27,28 Among the aromatic hydrocarbons, xylene is considered the most reactivity as compared to ethyl benzene, although due to low reactivity and longer lifetime benzene is the most stable in the atmosphere.29 Tan et al30 have been reported that the NMHCs are primarily emitted from vehicular emission except the aromatic hydrocarbons which mainly originated from solvent evaporation in the Foshan,China. On the other hand the major sink of NMHCs, are hydroxyl (OH) and nitrate radicals (NO3) in the atmosphere.31 Additionally, halogen atom reactions are other important sink of NMHCs in the coastal areas.32
PCA/APCS model have been more commonly used to the identification of possible source of NMHCs across the world.24,33,34 For example, Guo et al1 applied PCA/APCS receptor model to the identification of possible sources of NMHCs and identified the vehicular exhausts and bio-fuel burning were the main source in eastern China. Sanchez et al34 used PCA/APCS receptor model and they identified natural gas emissions was the major contributors of NMHCs whereas flare emissions, refinery process, fugitive gasoline emissions, industrial processes, and vehicle exhausts were lesser contributer in the coastal urban ambient air of Texas, United State. Apart of these, various studies have been conducted in the United States, Europe and Asia for the source apportionment of NMHCs in the ambient atmosphere.
In the Indian context concentration measurement of NMHCs and its source identifications are relatively fewer in number. For examples, NMHCs concentration was found to be higher in the refinery region in the Bombay city.35 Sahu and Lal,36 have reported the concentration of lighter hydrocarbons were elevated because of vehicular emission, natural gas emission and leakage of liquid petroleum gas in the urban atmosphere of Ahmedabad city,India. Pandit et al24 applied PCA receptor model on atmospheric NMHCs in Mumbai, India. They found vehicular emission was the major source of NMHCs.
In the context of ambient air of Delhi, no comprehensive study has been reported on the concentration measurement and source apportionment of NMHCs species. Delhi is a industrial, commercial, educational, tourism and transportational hub and capital city of India.These above activities are to be increased pollution load in the ambient air and pertain grave environmental concern to the city dwellers. Therefore, the complete information on ambient levels of NMHCs is needed to develop a policies and strategies by the government authorities for improving the urban air quality and controlling ground level ozone formation. In the present study, we examined the concentration of selected NMHC and its source identification and percentage contribution using PCA/APCS receptor model in the metro city, Delhi, India.
Methodology
Sampling location
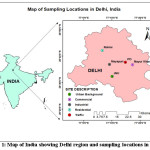
Delhi is the capital territory of India surrounded by three sides of Haryana and Gangetic plains of Uttar Pradesh to the east. It is located in between the latitudes and longitude 28°20'0"N to 28°50'0"N and longitude of 76°50'0"E to 77°20'0"E, respectively. Delhi climate is subtropical where continental air leads to dry conditions and extremely hot in the summer season. The Delhi monthly mean temperature varies from 14.3o C in January to 34.5oC in June, while the average annual temperature is 25.3oC. In Delhi, winter is a most remarkable season which is starting from December and ending in February and cold air and ground based inversion are prevailing with low wind situation, i.e., less than one meter/second leads to frequently increase the concentration of pollutants.37
Sampling
We have chosen two basic approaches for the sampling of NMHCs compounds, i.e., Tedlar bag and charcoal adsorption tube in the urban ambient air of metro city of Delhi. In the present study, for aliphatic NMHCs compounds propane, n-butane, iso-butane, trans-2-butane, iso-butene, 1,3-butadiene, iso-pentane, n-pentane, cis-2-pentene, n-hexane and n-heptane were collected with a pre-evacuated 2L Tedlar PLV sampling bag (CEL Scientific Corp. USA) using pump at the height of about 2m above the ground.38 Tedlar bags were flushed with ambient air and nitrogen gas prior to sampling of NMHCs compounds. Total 56 air samples (three sample in a week) were colleted for mesurment of aliphatic NMHCs between 6.00 AM to 9.00 AM, Indian Standard Time (IST) at different characteristic site v.z., Income Tax Office (ITO) as traffic intersection, Mayapuri (MP) as an industrial site, Rohini (ROH) as residential and Jawaharlal Nehru University (JNU) as an urban background site. Simultaneously, total 56 air samples of aromatic NMHCs benzene, toluene, o-xylene and p/m-xylene were collected through charcoal adsorption ORBOTM-32 tubes(O.D.xL6mm), Supelco,Sigma Aldrich,India, using VOCs sampler. After sampling both ends of each ORBOTM-32 tube was sealed with Teflon tape and wrapped with aluminium foil. These tubes were transferred to the laboratory and stored in the refrigerator (below 50C) until further analysis.39 Sampling locations are shown in Fig.1.
 |
|
Analytical method
During analysis of aromatic NMHCs in the laboratory,charcoal from ORBOTM-32 tubes were transferred into a 2-ml amber colour glass vial, 1 ml of CS2 (99 % purity) was added and put on the speed control spinix machine for agitation for 30 minute for the complete extraction of aromatic NMHCs from charcoal. The samples were extracted from amber colored glass vial through a syringe and put into other glass vials. These samples containing in glass vial were preserved into the freezer at a temperature below 50C. The prepared samples were analyzed using GC-FID equipped with a capillary column of 100% methyl silicone fused silica, as the dimension (60 mm × 0.25 mm, i.e.; film thickness, 1 mm; Supelco, eQuity-1) based on National Institute of Occupational Safety and Health method. 1μL of prepared sample was taken through a micro syringe and injected into the gas chromatograph. The samples were run with initial oven temperature at 40°C for 5 min, hold time and then temperature raised at the rate of 10°C/min up to 220°C, and kept for 4 min. Identification of NMHCs has done according to their retention time of calibrated standards (HC JMHW VOC Mix, 1000 μg/ml, in methanol) under a precise chromatographic conditions.Calibration standard mixture was diluted with acetone to different lower concentrations (0.0, 0.01, 0.1, 1.0, 10.0, 100.0 ppm).
For aliphatic NMHC analysis, we have taken 10-20 ml volume of concentrated sample at STP using gas tight syring ( purchased by Sigma Aldrich, India) and injected into the GC-FID system.High purity carrier gas(H2) with a flow rate of 25ml/min was used. Temperature of column program started from 35o C for 1.2 min, and then raised at the rate of 12oC/m, till it reached 65oC hold 1min. Again, the temperature was raised at the rate of 10oC/min from 65 to 150o C kept 2 min for the proper separation of compounds. The calibration gas mixture of 1ppm NMHCs of NIST calibration standard supplied by CHEMIX Speciality Gases, Bangalore, India, containing 17 component, used to calibrate Gas Chromatograph. Different concentration of calibration gas mixture(i.e.,0.0, 20, 50, 100, 200, 500 ppb) diluted using mass flow controller and analysed precisely in the same approach as for the air samples. The calibration standard mixture run every day to check the calibration curve. Detector response variation was less than 2% of the standard gas mixture. Data validity was confirmed through various steps. The result of the duplicate sample run was within 10 percent of the variation. Minimum detection limit of NMHCs compound was ranges from 0.10-0.30 ppb.24
PCA/APCS
We have applied multivariate analysis, i.e.,PCA/APCS to identification of source profile of NMHCs. For this tool, does not require prior information on source composition. The PCA used in air pollution is expressed in the equation (1):
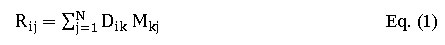
where, Rij is the normalized value of the concentration level of the ith species for the jth sample. Total number of source is denoted by N. Mkj is represents as a factor score of the kth common factor for the sample jth. Factor loadings of ith classes of the kth source is denoted as Dik and it is estimated using eigen vector disintegration matrix34,40. The detailed study of factor analysis was done by Thurston and Spengler.38 SPSS was used for data reduction factor analysis for possible source identification of NMHCs. APCS was used to assess the source distributions profile of each pollutant which was identified by PCA. PCA was performed by standardizing the variable data using the following equation (2):
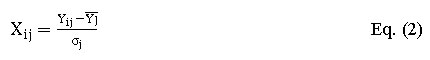
where, Yij is the calculated concentration of variable jth in the sample ith, and j the sums average concentration of variable jth, while standard deviation is σj. The normalized factor scores with zero mean is mentioned in equation (3):
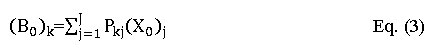
where, Bz is normalized factor scores with unit standard deviation after PCA performed. B0 is a factor scores at zero mean concentration each sample. While (P) represent as a factor scores coefficients obtained after PCA performance, and the value of (X0) computed from equation (2). The total number of variables are represents by J. APCS is estimated for each sample in each component by deducting the values of B0 of each sample from the resulting values of Bz after PCA performance of the identical variables10,16 shown in equation (4):
Multiple lenear regression analysis was done for measured concentration of dependent variables by using mass of various sources as idependent variables. The source contribution profile using multiple linear regression analysis10,41shown in the following equation (5):

where,Rj characterized to calculated concentration of sample j. (q0)j represent invariable term of multiple linear regression for pollutant j from unaccounted sources.The coefficient of multiple linear regression of the source k for pollutant j from accounted source is denoted by qkj. APCSk term is representing the rotated absolute component score of the rotated factor k for the sample j has been used in the above equation. The source profile is calculated from multiple linear regression between and qkj.APCSk16. These sources are further used to estimate the pollutant contribution from individual source34.
Results and Discussion
NMHCs concentrations
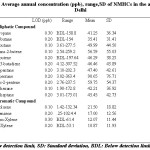
In the present study, we have summarized range, annual mean and standard deviation(SD) ambient concentration of selected NMHCs in the ambient air of metro city, Delhi(Table 1). The selected NMHCs compounds were found at all site with their similar composition. The presence of abundant concentration of aromatic hydrocarbons namely benzene, toluene, o-xylene and p/m-xylene indicates the vehicular as well as industrial emissions are common and dominant source of NMHCs compounds in the ambient air of Delhi. The sum of aliphatic hydrocarbon was found to be greater than that of the aromatic hydrocarbons. Fig.2 showed the mean concentration of iso-pentane was found to be highest followed cis-2-pentene>trans-2-butene>isobutnae>n-pentane>1,3-butadiene~i-butene>heptanes>propane of the aliphatic hydrocarbon and n-butane was observed to be lower.The mean concentration of isopentane indicates that it is emitted mostly from vehicular exhausts, secondary industrial process34. On the other hand mean concentration of o-xylene estimated lower and toluene, benzene were highest among the aromatic hydrocarbon. These results reveal that the benzene was dominated at a traffic intersection, followed by industrial and other sites. It may be due to larger lifetime in ambient air and lesser reactivity20,42,43.
An ambient mean concentration of benzene, toluene, xylene isomers and 1,3-butadine were observed to be similar and/ or higher than that estimated in previous studies23,44–48. It indicates that traffic area has heavy transportation load and their attributes are frequently inferred in urban air pollution. Apart of these, activities involved at polymer manufacturing industrial area, refinery operation and gas storage tank are the second and the third most alarming sites for urban air quality.At the same time, residential area and urban background area shows less contribution in the urban air pollution as compared to traffic and industrial site.The abundance of n-pentane and i-pentane in urban air is may be attributed diversity of fuel type used. The sources of n-hexane encountered in urban air is largely due to emission from polymer industry 49.
 |
|
 |
|
Source characteristics of NMHCs
Correlation analysis
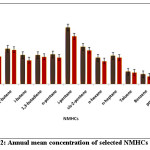
Table 2 shows the correlation analysis, among the selected NMHCs compounds. The concentration of ambient NMHCs is used to the source identification and distribution pattern during sampling period. Karl’s Pearson correlation coefficient was found to be at 99 and 95 percent of significance level. In this study, the correlation coefficient value of r>0.4, can be considered as a good correlation. Results showed the r value between the benzene and toluene was higher (0.651) among all NMHCs species. On the other hand r value between benzene and i-butane; n-pentane was found to be 0.346; 0.367 respectively. Similarly, r value between n-butane and o-xylene was found to be 0.449, and n-heptane and i-butene was found 0.412. These results are clearly shows that the r values among the selected compounds have approaches to high, good and lower, indicating the pollutants have more than one origin source, as an expected in the urban air of metro city Delhi. Benzene shows high positive correlation with toluene and lower with i-butane and n-pentane reveals that major source may be vehicle exhaust as well as other sources.34,50 In the present study, most of r value is ≤0.4, indicating that the sources of NMHCs pollutants have various origin. Overall, the r values among the NMHCs compounds are found to be r = 0.5±0.2, showed strong, moderate and low significance level. It is clearly indicates that the source NMHCs are may be vehicle exhaust, industrial, manufacturing industries, petrochemical, gas storage tank, secondary industrial process and many other sources24,34,50 while the percentage contribution of source emission is not reveal by this method.
 |
|
Characteristic ratio of NMHCs
After estimation of characteristic ratio,which may only reveal the source emissions of NMHCs in the ambient air metro city Delhi. Both aliphatic and aromatic NMHCs are key abundant compounds;some of these compounds (benzene, toluene, and xylene isomers) are important indicator of vehicular emissions source in the urban ambient air. The lifetime of benzene is higher due to its lower reactivity as compared to toluene in the urban sites15,30,43.The higher ratio of xylene/benzene (X/B) indicates the fresh air masses and lower value indicates aged air masses.51,52 However, the higher ratio value describe the source have closer to the sampling site and their photochemical processes confer the lower impact on the concentration of NMHCs compound. On the other hand, most of the anthropogenic NMHCs are emitted from vehicular exhaust in the urban areas. Thus the ratio of benzene/toluene(B/T)can be used as a tracer source for the traffic site identification. The ratio of B/T generally ≥ 0.5, is considered for vehicular emission.25,53 On the other hand B/T ratio is less than 0.5 indicate sources may be vehicles as well as other sources in the ambient air. In the present study, we found that the average mean concentration of toluene was higher than the benzene during the sampling period.Therefore, this B/T ratio is utilized to evaluate source emission in metro city Delhi. The ratio of B/T value was found to be 0.79 during the sampling period, which indicates vehicular sources, is the primary sources of NMHCs in urban air of Delhi.23,54 The ratio of T/B is approaching to1,indicates the traffic is dominated as a emission of sources and the value increases to greater than 1, then it indicates sources are close to the pollution source.55 For the xylene isomers, the ratio value of B/o-X and B/mp-X were found to be ≥ 1, indicated that the sources may be far from the sampling location during the winter and summer season. It may be influenced by the meteorological parameters and transportation of vehicles.49
Principal Component Analysis (PCA)
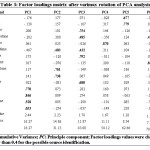
Beside of correlation and characteristics ratio analysis,we have used well-established PCA to analyze in multivariate environmental data sets16,41,56,57 for possible source profile identification(Table 3). Multivariate analyses of NMHCs is elucidate relationships between a set of correlated variables and identified a number of Principal Components (PC), it may explain the variance of data set.58 The estimated NMHCs data are arranged with low or high concentrations for the possible outlier, before applying the PCA model. The varimax rotated factor analysis was applied on an estimated data of NMHCs and found the possible source profile of NMHCs in the urban air in Delhi. In general, eigenvalues larger than 1.0 are chosen for factors or principle components (PCs).34,59 Higher factor loading of marker compound is considered to identify the possible source profile of NMHCs.49 In the present study, six PCs were extracted after varimax rotation for the identification of possible sources profile of NHMCs.For identification of possible source profile associated with origin, factor loading of marker compound is to be considered greater than 0.4. The total cumulative % of variance elucidated by six factors or PC and accounted about70.0 % of dataset. The first factor was explaining 16.2% of the total variance of a data set with high loadings of benzene, toluene, p/m-xylene and o-xylene which may emitted from combustion process. Thus, the first factor is attributed to the vehicular exhausts as a possible sources profile34,49,58. In the metro city, Delhi, as per traffic police Delhi websites has mentioned about 96 lakh vehicles in Delhi, most of them are private and operated daily(https://delhitrafficpolice.nic.in/).They have various fuel types consumption like petrol (gasoline), liquefied petroleum gas, compressed natural gas(CNG) and diesel. Most of the heavy vehicles (truck, buses) and fewer light vehicles (taxies) are using diesel as a fuel. While most of the car, auto rickshaw are using both petrol and CNG as a fuel.These fuels are emitted large amount of both aliphatic and aromatics hydrocarbons and leads to elevate the level of NMHCs into the ambient air of metro city Delhi. Aromatic NMHCs benzene, toluene and p/m-xylene are mostly emitted from vehicular exhausts.34,50 These are the byproduct of fuel combustion, but unburned gasoline is not produced much concentration of the toluene, and p/m-xylene.25 The second factor is explaining about 14.86% of the percentage variance of a data set with high loadings of iso-2-pentene,n-hexane and 1,3-butadiene and indicates polymer manufacturing industries are the major source profile.34 A third factor is to be identified as a refinery operation/gas station/storage tank/internal combustion of vehicles which explained about 11.86% of data set, associated with high loadings of n-pentane, iso-butane, n-heptane, trans-2-butane and 1,3-buatdiene 34,49,60,61. NMHCs including iso-butane associated with fourth factor which is explaining about 11.11% of data set. They are characterized as flare emission as a source profile. Fifth factor is classified as a natural gas emission which is accounted about 8.54% of data set with high loadings of isobutene. However, the sixth profile characterized by a secondary industrial process, including paints, body soaps, metal fabricators and processing as major contributors which explained about 7.36% of dataset with high loadings of iso-pentane, and trans-2-butene.34,49,50
 |
|
Absolute Principal Component Scores (APCS)
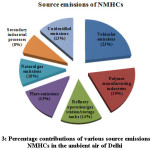
In the present study, we have calculated APCS based on the PC scores and true zero PC and these values are applied for quantification of various source profile. Further on the basis of observed APCS, we have executed the multiple linear regression analysis of the measured concentration of each compound.34,62 The coefficient of the equation is calculated by using concentration of each NMHCs compound participated in the source identification. Fig.4 showed vehicular emission source profile was estimated about (23%) of total mass apportionment in the urban ambient air of Delhi.34 Polymer manufacturing industries emitted approximately 19% of the concentrations with the second largest contributor of NMHCs.The refinery operation/gas station/storage tank and flare emissions were to be found the third and fourth supplier and accounted almost 14 % and 13 % of NMHCs.50 The other sources included natural gas emissions and secondary industrial process, including paints, body soaps, and metal fabricator and processing were participated about 10% and 8% respectively.50 However, remaining 13 % is found to be an unidentified source (Fig. 3).
 |
|
Conclusion
An ambient concentration of the fifteen different NMHCs were calculated in the metro city Delhi during the winter and summer season. An abundant concentration of benzene, toluene, o-xylene, p/m-xylene indicates it is emitted primarly from vehicular emissions. The average concentration of iso-pentane and cis-2-pentene were found to be highest among the selected NMHCs. It may emitted from vehicular exhausts(fuel types used )as well as secondary industrial processes.The presence of n-hexane in urban air, indicates polymer industry was the emission source profile.
The ratio of B/T value also confirmed that the vehicular source profile, was the main sources of NMHCs in urban air of Delhi. In the present study, the PCA/APCS receptor model is applied for the percentage contribution of possible source profil of NMHCs. Six factors after varimax rotation and explained about 70.0 % of data set of NMHCs. Further multiple linear regression analysis based on APCS of the measured concentration of each compound. As a result the vehicular emission source was found to be dominant source and accounted about (23%) of total mass apportionment in the urban ambient air. Whereas polymer manufacturing industries (19%), refinery operation/gas station/storage tank(14%), flare emissions(13%), natural gas emissions (10%), secondary industrial process, including paints, body soaps, and metal fabricator and processing (8% ) and remaining 13% was found to be an unidentified source. Over all results of this study showed the level of NMHCs has been increased and lead to worsen air quality in the metro city, Delhi. Therefore, the most effective way to avoid health hazard to the urban communities caused via air pollution required preventive measure for the mitigation of major source profile of NMHCs.
Acknowledgement
The authors are acknowledged to the School of Environmental Sciences, Jawaharlal Nehru University, New Delhi for providing the essential facilities carried out in this work. The authors are also thankful to Council for Scientific and Industrial Research (CSIR), New Delhi and Department of Science and Technology-Promotion of University Research and Scientific Excellence (DST-PURSE), Goverment of India, for the financial aid of this study.
References
- Guo, H., Wang, T. & Louie, P. K. K. Source apportionment of ambient non-methane hydrocarbons in Hong Kong: application of a principal component analysis/absolute principal component scores (PCA/APCS) receptor model. Environmental pollution (Barking, Essex : 1987) 129, 489–98 (2004).
CrossRef - Poisson, N. & Kanakidou, M. Impact of Non-Methane Hydrocarbons on Tropospheric Chemistry and the Oxidizing Power of the Global Troposphere : 3-Dimensional Modelling Results. 157–230 (2000).
- Caselli, M., de Gennaro, G., Marzocca, A., Trizio, L. & Tutino, M. Assessment of the impact of the vehicular traffic on BTEX concentration in ring roads in urban areas of Bari (Italy). Chemosphere 81, 306–311 (2010).
CrossRef - Cheng, H. R. et al. Assessing photochemical ozone formation in the Pearl River Delta with a photochemical trajectory model. Atmospheric Environment 44, 4199–4208 (2010).
CrossRef - Kato, S., Pochanart, P. & Kajii, Y. Measurements of ozone and nonmethane hydrocarbons at Chichi-jima island, a remote island in the western Pacific: Long-range transport of polluted air from the Pacific rim region. Atmospheric Environment 35, 6021–6029 (2001).
CrossRef - Madhoun, W. A. Al & Ramli, N. A. Temporal distribution of non-methane hydrocarbon ( NMHC ) in a developing equatorial island. (2015). doi:10.1007/s11869-015-0341-8
CrossRef - Sharma, U. K., Kajii, Y. & Akimoto, H. Seasonal variation of C2–C6 NMHCs at Happo, a remote site in Japan. Atmospheric Environment 34, 4447–4458 (2000).
CrossRef - Lee, G. et al. Chemosphere Characteristic behavior of peroxyacetyl nitrate ( PAN ) in Seoul megacity , Korea. 73, 619–628 (2008).
- Majumdar (neé Som), D., Dutta, C., Mukherjee, A. K. & Sen, S. Source apportionment of VOCs at the petrol pumps in Kolkata, India; exposure of workers and assessment of associated health risk. Transportation Research Part D: Transport and Environment 13, 524–530 (2008).
CrossRef - Choi, E., Choi, K. & Yi, S. M. Non-methane hydrocarbons in the atmosphere of a Metropolitan City and a background site in South Korea: Sources and health risk potentials. Atmospheric Environment 45, 7563–7573 (2011).
CrossRef - Moolla, R., Curtis, C. & Knight, J. Occupational Exposure of Diesel Station Workers to BTEX Compounds at a Bus Depot. International Journal of Environmental Research and Public Health 12, 4101–4115 (2015).
CrossRef - Sauvage, S. et al. Long term measurement and source apportionment of non-methane hydrocarbons in three French rural areas. Atmospheric Environment 43, 2430–2441 (2009).
CrossRef - Salameh, T., Sauvage, S., Afif, C., Borbon, A. & Locoge, N. Source apportionment vs. emission inventories of non-methane hydrocarbons (NMHC) in an urban area of the Middle East: Local and global perspectives. Atmospheric Chemistry and Physics 16, 3595–3607 (2016).
CrossRef - Lal, S., Sahu, L. K., Venkataramani, S. & Mallik, C. Light non-methane hydrocarbons at two sites in the Indo-Gangetic Plain. J.Environ.Monit. 14, 1159–1166 (2012).
CrossRef - Panda, U., Mahapatra, P. S. & Das, T. Study of C 2 – C 5 Non-methane Hydrocarbons and Their Ozone Formation Potential at Bhubaneswar , an Eastern Coastal Site in India. (2015). doi:10.1007/s12647-015-0134-4
CrossRef - Salameh, T., Sauvage, S., Afif, C., Borbon, A. & Locoge, N. Source apportionment vs. emission inventories of non-methane hydrocarbons (NMHC) in an urban area of the Middle East: local and global perspectives. 2010–2011 (2011). doi:10.1029/2010JC006760.Else
- Kansal, A. Sources and reactivity of NMHCs and VOCs in the atmosphere : A review. 166, 17–26 (2009).CrossRef
- Singh, A. P., Singh, R., Mina, U., Singh, M. P. & Varshney, C. K. Emissions of monoterpene from tropical Indian plant species and assessment of VOC emission from the forest of Haryana state. Atmospheric Pollution Research 2, 72–79 (2011).
CrossRef - Bauri, N., Bauri, P., Kumar, K. & Jain, V. K. Evaluation of seasonal variations in abundance of BTXE hydrocarbons and their ozone forming potential in ambient urban atmosphere of Dehradun (India). Air Quality, Atmosphere and Health 3, 95–106 (2015).
- Barletta, B. et al. Ambient mixing ratios of nonmethane hydrocarbons (NMHCs) in two major urban centers of the Pearl River Delta (PRD) region: Guangzhou and Dongguan. Atmospheric Environment 42, 4393–4408 (2008).
CrossRef - Shaw, S. L. The Production of Non-Methane Hydrocarbons by Marine Plankton. Sciences-New York 176 pp. (2001).
- Guenther, A. et al. Natural emissions of non-methane volatile organic compounds, carbon monoxide, and oxides of nitrogen from North America. Atmospheric Environment 34, 2205–2230 (2000).
CrossRef - Tang, J. H., Chan, L. Y., Chang, C. C., Liu, S. & Li, Y. S. Characteristics and sources of non-methane hydrocarbons in background atmospheres of eastern, southwestern, and southern China. Journal of Geophysical Research Atmospheres 114, (2009).
- Pandit, G. G., Sahu, S. K. & Puranik, V. D. Distribution and source apportionment of atmospheric non–methane hydrocarbons in Mumbai, India. Atmospheric Pollution Research 2, 231–236 (2011).
CrossRef - Pandit, G. G., Sahu, S. K. & Puranik, V. D. Distribution and source apportionment of atmospheric non–methane hydrocarbons in Mumbai, India. Atmospheric Pollution Research 2, 231–236 (2011).
CrossRef - Liu, Y. et al. Source profiles of volatile organic compounds (VOCs) measured in China: Part I. Atmospheric Environment 42, 6247–6260 (2008).
CrossRef - Srivastava, A. Source apportionment of ambient VOCS in Mumbai city. Atmospheric Environment 38, 6829–6843 (2004).
CrossRef - Srivastava, A., Sengupta, B. & Dutta, S. A. Source apportionment of ambient VOCs in Delhi City. Science of the Total Environment 343, 207–220 (2005).
CrossRef - Calvert, J.G 2000. The Mechanisms of Atmospheric Oxidation of Aromatic Hydro- carbons Calvert, J.G., Atkinson, R., Becker, K.H., Kamens, R.M., Seinfeld, J.H., Wallington, T.J., Yarwood, G., 2000. Oxford University Press, New York. 2000 (2000).
- Tan, J. H. et al. Non-methane hydrocarbons and their ozone formation potentials in Foshan, China. Aerosol and Air Quality Research 12, 383–394 (2012).
CrossRef - Nishanth, T., Praseed, K. M., Satheesh Kumar, M. K. & Valsaraj, K. T. Observational study of surface O3, NOx, CH4 and total NMHCs at Kannur, India. Aerosol and Air Quality Research 14, 1074–1088 (2014).
CrossRef - Arsene, C. Tropospheric OH and Cl levels deduced from non-methane hydrocarbon measurements in a marine site. (2007).
- Guo, H., Wang, T. and Louie, P.K.K. (2004a). Source Apportionment of Ambient non- Methane Hydrocarbons in Hong Kong: Application of a Principal Component Analysis/Absolute Principal Compound Scores (PCA/ APCS) Receptor Model. Environ. Pollut. 129: 489 – 4. 2004
CrossRef - Sanchez, M., Karnae, S. & John, K. Source characterization of volatile organic compounds affecting the air quality in a coastal urban area of South Texas. International Journal of Environmental Research and Public Health 5, 130–138 (2008).
CrossRef - Mohan Rao, A. M. et al. Non-methane hydrocarbons in industrial locations of Bombay. Atmospheric Environment 31, 1077–1085 (1997).
CrossRef - Sahu, L. K. & Lal, S. Distributions of C2-C5 NMHCs and related trace gases at a tropical urban site in India. Atmospheric Environment 40, 880–891 (2006).
CrossRef - Anfossi, D. et al. A new Lagrangian particle model for the simulation of dense gas dispersion. Atmospheric Environment 44, 753–762 (2010).
CrossRef - Marzocca, A., Di Gilio, A., Farella, G., Giua, R. & de Gennaro, G. Indoor Air Quality Assessment and Study of Different VOC Contributions within a School in Taranto City, South of Italy. Environments 4, 23 (2017).
CrossRef - Som.D, Dutta .C, Chatterjee.A, Mallick.D, Jana.T.K,Sen.S.Studies on commuters exposure to BTEX in the passenger Cars in Kolkata, India. Science of Total Environment 372, 426-432 (2007) gerningssted.
- So, K. L. & Wang, T. C3-C12 non-methane hydrocarbons in subtropical Hong Kong: Spatial-temporal variations, source-receptor relationships and photochemical reactivity. Science of the Total Environment 328, 161–174 (2004).
CrossRef - Thurston, G. D. & Spengler, J. D. A Multivariate Assessment of Meteorological Influences on Inhalable Particle Source Impacts. Journal of Climate and Applied Meteorology 24, 1245–1256 (1985).
CrossRef - Tang, J. H., Chu, K. W., Chan, L. Y. & Chen, Y. J. Non-methane hydrocarbon emission profiles from printing and electronic industrial processes and its implications on the ambient atmosphere in the Pearl River Delta, South China. Atmospheric Pollution Research 5, 151–160 (2014).
CrossRef - Chan, L. Y. et al. Characteristics of nonmethane hydrocarbons (NMHCs) in industrial, industrial-urban, and industrial-suburban atmospheres of the Pearl River Delta (PRD) region of south China. Journal of Geophysical Research Atmospheres 111, 1–9 (2006).
- Duffy, B. L., Nelson, P. F., Ye, Y., Weeks, I. A. & Galbally, I. E. EMISSIONS OF BENZENE , TOLUENE , XYLENES AND 1 , 3-BUTADIENE FROM A REPRESENTATIVE PORTION OF THE AUSTRALIAN CAR FLEET. 32, (1998).
- Duffy, B. L. & Nelson, P. F. Exposure to emissions of 1,3-butadiene and benzene in the cabins of moving motor vehicles and buses in sydney, Australia. Atmospheric Environment 31, 3877–3885 (1997).
CrossRef - G., B. Air pollutants in road tunnels. Science of the Total Environment 189–190, 431–435 (1996).
- Singh, A. K., Tomer, N. & Jain, C. L. ( VOCS ) IN URBAN ATMOSPHERE OF NATIONAL CAPITAL DELHI , INDIA. 2, 159–165 (2012).
- Som, D. M., Mukherjeea, A. K. & Sen, S. BTEX in Ambient Air of a Metropolitan City. 2011, 11–20 (2011).
- Pandit, G. G., Sahu, S. K. & Puranik, V. D. Atmospheric Pollution Research Distribution and source apportionment of atmospheric non – methane hydrocarbons in Mumbai , India. 2, (2011).
- Arsene, C., Bougiatioti, a & Mihalopoulos, N. Sources and Variability of Non-Methane Hydrocarbons in the Eastern Mediterranean. Global Nest Journal 11, 333–340 (2009).
- Rdenas, L. M. C. A. et al. CORRELATIONS BETWEEN CO , NO y , O 3 AND NON-METHANE HYDROCARBONS AND THEIR RELATIONSHIPS WITH METEOROLOGY DURING WINTER 1993 ON THE NORTH NORFOLK COAST , U . K . 32, (1998).
- Kuntasal, Ö. O., Kılavuz, S. A., Karman, D., Wang, D. & Tuncel, G. C5–C12 volatile organic compounds at roadside, residential, and background locations in Ankara, Turkey: Temporal and spatial variations and sources. Journal of the Air & Waste Management Association 63, 1148–1162 (2013).
CrossRef - Guo, S., Yang, F., Tan, J. & Duan, J. Nonmethane Hydrocarbons in Ambient Air of Hazy and Normal Days in Foshan, South China. Environmental Engineering Science 29, 262–269 (2012).
CrossRef - Song, P. et al. Characteristics and sources of non-methane hydrocarbons and halocarbons in wintertime urban atmosphere of Shanghai, China. Environmental Monitoring and Assessment 184, 5957–5970 (2012).
CrossRef - Tiwari, V., Hanai, Y. & Masunaga, S. Ambient levels of volatile organic compounds in the vicinity of petrochemical industrial area of Yokohama, Japan. Air Quality, Atmosphere and Health 3, 65–75 (2010).
CrossRef - Choi, E., Heo, J. B. & Yi, S. M. Apportioning and locating nonmethane hydrocarbon sources to a background site in Korea. Environmental Science and Technology 44, 5849–5854 (2010).
CrossRef - Sanchez, M., Karnae, S. & John, K. Source Characterization of Volatile Organic Compounds Affecting the Air Quality in a Coastal Urban Area of South Texas. 5, 130–138 (2008).
- Borbon, A., Locoge, N., Veillerot, M., Galloo, J. C. & Guillermo, R. Characterisation of NMHCs in a French urban atmosphere: Overview of the main sources. Science of the Total Environment 292, 177–191 (2002).
CrossRef - Adgate, J. L. et al. Outdoor, indoor, and personal exposure to VOCs in children. Environmental Health Perspectives 112, 1386–1392 (2004).
CrossRef - Duffy, B. L. & Nelson, P. F. Exposure To Emissions of 1 , 3-Butadiene a N D Benzene in the Cabins of Moving Motor Vehicles a N D Buses in Sydney , Australia. Atmospheric Environment 31, 3877–3885 (1997).
CrossRef - Fujita, E. M. Hydrocarbon source apportionment for the 1996 Paso del Norte Ozone Study. Science of the Total Environment 276, 171–184 (2001).
CrossRef - Baudic, A. et al. Seasonal variability and source apportionment of volatile organic compounds (VOCs) in the Paris megacity (France). Atmospheric Chemistry and Physics Discussions 1–51 (2016). doi:doi:10.5194/acp-2016-185
CrossRef


