Assessment of Threats to Forest Ecosystems Using Geospatial Technology in Jharkhand State of India
Firoz Ahmad 1 * and Laxmi Goparaju 1
1
Vindhyan Ecology and Natural History Foundation,
Mirzapur,
Uttar Pradesh
India
http://dx.doi.org/10.12944/CWE.12.2.19
Conservation of forest biodiversity is vital for mankind as it provides enormous benefits such as biological resources and ecosystem services. Of late, the forests are facing risk and threats such as fragmentation, degradation and forest fires which are responsible for the deteriorating condition.
The progress in the field of science and technology like satellite remote sensing and GIS since the past few decades in India and the world provide an opportunity to track and monitor the changes taking place on the Earth’s surface. Besides, analysis of large spatial data in GIS can also provide insight into the various driving factors which lead to the loss of biodiversity in the threatened ecosystems i.e forests.
This study has attempted to obtain information about the spatial extent of the three forest ecosystem degradation indicators viz. deforestation, fragmentation of forest and forest fires using methodical approach in the Jharkhand state of India. The satellite remote sensing data sets belonging to Landsat-8 were used to analyse the forest cover of Jharkhand state.
To identify the areas of threat, grid cells (5KmX5Km) were generated in GIS domain. Analysis of deforestation was conducted using multi source data of the time periods 1935 and 2015. Evaluation of deforestation spanning over a time period reveals that vital changes have occurred in the forests of Jharkhand and determined 1224 extinct, 248 critically endangered, 318 endangered and 396 vulnerable ecosystem grid cells. The fragmentation analysis has determined 148 critically endangered, 296 endangered and 402 vulnerable ecosystem grid cells. Forest fire point’s data from the year 2005 to 2016 were utilized and analysis was executed. Further frequency of forest fires for each grid was noted. The result indicates that 67.3% of grid cell of Jharkhand forest was affected with forest fire. Conservation status has been evaluated based on the value of threat for each grid which was the fundamental criteria for conservation priority hotspot. About 2.1% of Jharkhand forest ecosystem grids are defined as extremely high ecosystem risk stage and have been designated in the category of conservation priority hotspot-1 followed by 19.7% conservation priority hotspot-2, 41.3% conservation priority hotspot-3, 27.8% conservation priority hotspot-4 and 9.1% lowest conservation priority hotspot-5. This study highlights the capability of integrating remote sensing and GIS data for mapping the forest degradation, which can be useful in formulating the strategies and policies for protection and conservation of forests.
Copy the following to cite this article:
Ahmad F, Goparaju L. Assessment of Threats to Forest Ecosystems Using Geospatial Technology in Jharkhand State of India. Curr World Environ 2017;12(2). DOI:http://dx.doi.org/10.12944/CWE.12.2.19
Copy the following to cite this URL:
Ahmad F, Goparaju L. Assessment of Threats to Forest Ecosystems Using Geospatial Technology in Jharkhand State of India. Curr World Environ 2017;12(2). Available from: http://www.cwejournal.org/?p=17534
Download article (pdf)
Citation Manager
Publish History
Introduction
The Convention on Biological Diversity (CBD) was drafted in Rio in 1992 and since then the issue of conservation of forests has become a major concern worldwide. About 40% of the Earth’s surface is covered by forests and woodlands which form the biodiversity rich areas occurring throughout the world.1 The global biodiversity is concentrated in the forests.2 Tropical dry deciduous forests are one of the largely neglected natural resources all over the world. They are the most inadequately safeguarded forest categories in the world with only 5% area under protection3 as stated by Kapos and Iremonger.2 Nevertheless, these forests satisfy the demands of the local tribal populations of basic necessities of life which include food, fuelwood, fodder, fibre and medicines. Besides, they play a vital role in ecosystem function, livelihood for tribals and wildlife habitat.
The factors which influence forests are fragmentation of contiguous forests, fire and deforestation which have a negative impact on biodiversity influencing from the unit of genes, species and communities. Increasing forest fragmentation impacts biodiversity loss.4 Thus it is important to evaluate the threats for biodiversity conservation.5 Nature conservation is governed by ancient forest species since they incorporate both qualitative (forest quality) and quantitative (diversity) conservation criteria.6 Fragmentation of a habitat happens when a parcel of land or forest is disintegrated into smaller parcels either by a natural phenomenon like fire or storm or by human intervention and infrastructure activity (e.g construction of roads or agriculture expansion).7 The forest biodiversity is lost due to threats like forest disappearance and fragmentation which has been recognized lately.8 Spatial heterogeneity occurs naturally but of late human activities have modified the abundance and spatial pattern. The after math of forest fragmentation is decline in populations of flora and fauna and loss of species diversity.9,10
Deforestation implies clearing the forest cover by felling trees or removing the plantations to make way for agricultural, infrastructure and development purposes. A permanent loss of forest cover occurs which cannot be restored to a forest again. According to FAO, it is estimated that the loss in forest cover per year is 18 million acres (7.3 million hectares) (http://www.conserve-energy-future.com/various-deforestation-facts.php). Removal of trees causes imbalance in the ecosystem and in the long run will affect the environment also. Another major factor which causes loss of trees is forest fire in various parts of the world. It occurs mainly due to the warm summers and mild winters. They may be natural or human induced but in both cases cause large damage to the forest ecosystem. Both the above factors are responsible for increase of carbon in the atmosphere thus causing global climate change. The biogeochemical cycles are altered by deforestation.11
Forest degradation is often associated with varied degree of habitat fragmentation. The theory of island biogeography states that when a large part of native habitat is lost and the rest is fragmented the area would finally lose some of its important species.12
Conservation was defined by McNeely et al.13 as regulating the human exploitation of the biosphere in a manner that it suffices the present needs and is also conserved for the future generations. Biodiversity revolves around mankind thus its conservation should be a priority and must be given attention as much as national security1. Entire landscapes need to be preserved not only protected area or reserves.14 For any landscape conservation at regional scale, core areas should be focused along with buffers which would act as transitional zones allowing human access such that they can take advantage of forest produce.
RS and GIS applications in forest conservation planning
Satellite Remote sensing data facilitate as a source of rapid acquisition of any land use information coupled with ground truth of low cost.15 In this regard, the Landsat satellite data has been successfully employed for various research activities since 1972 which is the year of its launch. This remote sensing satellite data has a medium spatial resolution and covers worldwide.16 When such data is analysed in GIS (Geographic Information Tool) many of the ecosystems could be studied spatially and temporally.17,18 Some of them were used to study the changing levels of biodiversity with respect to changing forest fragment size9. Further it has been utilized for forest inventory, periodic monitoring and estimating the terrestrial biodiversity at regional19; landscape20 level. Besides, it can employ to identify lacuna in the protection network which is a methodology adopted in GIS domain.21 In a gap analysis of Western Ghats in India22, 23 found that high biodiversity areas were eliminated from the protection network.
Few researches have addressed the issue of evaluating the threats and determining the conservation priority hotspot. Reddy et al.5 have evaluated the forest ecosystem of the Orissa state of India using the five threats viz. deforestation, forest degradation, fragmentation index, forest fire risk map and invasive species abundance. The study used 5kmX 5 km grid. Further, by integrating various threats by providing equal weights to all, conservation priority hotspot was achieved. A similar study was conducted by Reddy et al.24 who have evaluated the forest ecosystem of Telangana state of India using three threats viz. deforestation, fragmentation index and forest fire risk map. Kanga and Singh25 studied the forest fire in the Taradevi forest of Himachal Pradesh (India). The study analyze the forest fire spread analysis and loss assessment using simulation modeling techniques using FARISTE. Findings of the study are helpful in development of forest fire management and planning.
Apart from Orissa and Telangana states of India such studies has not been conducted for any other state of India thus this is potential research gap at the state level. The present study has been conducted in the Jharkhand state. It is a land of forest and tribal. A symbiotic relationship persists among the tribals and the forests.26 Of late, the forests are threatened due to human and anthropogenic activities, which has deteriorated the condition of forests as well as threatened the livelihood of the tribal people who are mainly dependent on them. The forests have not only witnessed the degradation in forest quality but also in quantity in the recent past.27 The problem regarding food and livelihood insecurity has escalated due to deforestation. Further problems like displacement, migration and being deprived of the natural environment have accelerated. Massive deforestation is responsible for decline in annual rainfall which may further case scarcity of water.
This study aims to document the data regarding forests of Jharkhand in spatial domain and identify hotspots for conservation priority. In this aspect, an integrated procedure was adopted to evaluate the three threats that is forest fire, deforestation and forest fragmentation using remote sensing and GIS data with synergistic approach for spatial assessment and analysis.
The Study area
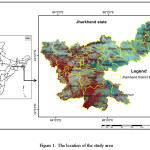
The state of Jharkhand lies between latitude 21 º 58' 02'' N to 25 º 08' 32''N and longitude 83º 19' 05''E to 87º 55' 03 '' E, whereas the total geographical area is 79,714 km² accounted for nearly 2.4 % of total geographical area of the country (Figure 1). The word ‘Jharkhand’ implies as ‘a parcel of land enfolded with forests’. The state is a home to 30 different tribal groups. Some of the aboriginal races are Santhals, Mundas, Oraons, Hos, Kharia, Bhumij, Birhors, etc. They have a close association with nature. They are commonly known as “adivasis” which means that they are the original settlers of the land. Their livelihood revolves around these forests. They begin their day by collecting items like fruits, roots of some plants, some flowers, edible mushrooms, tubers of some plant and fuel wood etc. for their daily requirement. Medicinal herbs, fruits, grasses and leaves etc. serve the purpose of curing diseases and common ailments. Besides, they also preserve the sacred groove in the vicinity of the forest known as Sarna. The forests of this region are tropical dry deciduous with elevation varies from 6 m to 1366 m from the mean sea level. Jharkhand average moderate rainfall varies from 945 mm to 1297 mm with temperature variation of 6ºC in winter to 47ºC in summer.
 |
|
Materials and Methods
Data Preprocessing and analysis
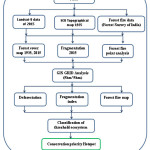
The identified indicators viz. deforestation, fragmentation, forest fires are utilized to determine the forest health of Jharkhand. Flowchart describing the methodology has been provided in Figure 2. The geospatial evaluation for the threats in forest ecosystem in Jharkhand was analysed using various criteria which are briefly described in Table 1. The forests in the present case have been described as area of land with more than 1% of grid area harboring local tree species having a canopy cover of greater than 10%. In order to comprehend the condition of threats, a grid of 5 km × 5 km (each 25 km2) size was prepared. Historical/long term changes of forest cover have been quantified. The terminology used to describe the ecosystems is recommended by IUCN for Red list of species and has been utilized in the present case also.28 The concept of criteria for each category of threatened ecosystems has been prepared by Reddy et al. 5 which is used in this study. If no threat is discovered as per selected parameters, forest ecosystems are considered as least Concern or low risk.
 |
|
Processing of the satellite data
The software used was ERDAS IMAGINE (version 11) for digital image processing and ArcGIS for geospatial analysis. The nine Landsat images (Table 1) of the time period December 2015 were downloaded from USGS website. The data was mosaicked and resampled using nearest neighbor resampling method in order to retain the radiometry and spectral information in the imagery.29 For classification we have used hybrid classification techniques (conjunction of visual interpretation, supervised classification and Normalized Difference Vegetation Index (NDVI)) to deleneate the forest cover with two classes viz. forest and non-forest class. In order to remove the noise and to smoothen the classified image, a 3X3 filter was executed. The accuracy of the forest cover map was assessed using around 250 random sampling points. They were assigned to the respective classes after confirming them against ground truth data and literature sources. Overall accuracy and Kappa statistic were computed using the error matrix.
Table1: Satellite data details
|
Satellite |
Sensor |
Path/ Row |
Dates |
|
Landsat 8 |
OLI_TIRS |
142/43
|
01-12-2015
|
|
Landsat 8 |
OLI_TIRS |
141/43 141/44 |
26-12-2015 26-12-2015 |
|
Landsat 8 |
OLI_TIRS |
140/43 140/44 140/45 |
19-12-2015 19-12-2015 19-12-2015 |
|
Landsat 8 |
OLI_TIRS |
139/43 139/44 139/45 |
28-12-2015 28-12-2015 28-12-2015 |
Threatened forest ecosystem indicator
Deforestation
The spatial distribution of forest cover during the last 80 years has been mapped. Survey of India topographical maps of 1924–1935 (say 1935) were downloaded (http://www.lib.utexas.edu/maps/ams/india/) and interpreted visually to generate spatial datasets at 1:250,000 scale. Remote Sensing data pertaining to Landsat 8 (2015) was used to see the changes with respect to the year 1935. FAO defined deforestation as in change in land cover with reduction of tree crown cover to less than 10% 30 was the criteria of deforestation in our study.
On comparing the spatial data on forests in the time series 1935–2015 the forest cover change for the period of 1935–2015 has been considered for assessment of the historical decline wherein if the reduction in geographical distribution of forest cover exceeds >90% considered as Critically Endangered, >70% as Endangered and >50% as Vulnerable.31 In long term decline, if the reduction in geographical distribution of forest cover exceeds >80% considered as Critically Endangered, >50% as Endangered and >30% as Vulnerable.31 In our study we have used the criteria for identification of threatened forest ecosystem based on deforestation were based on reduction in forest cover exceeds >80% considered as Critically Endangered, >50% as Endangered, >30% as Vulnerable, >10% as near threatened and < 10% as least concern.
The analysis of the results has taken these three main points into consideration: firstly, grid cell size of 5 km × 5 km was taken for assessment of threatened ecosystems; secondly, as the analysis was based on multi-time frame data (1935–2015) there is a change in number and distribution of threatened ecosystems, thirdly, the assessment was carried out on 1:250,000 scale.
Fragmentation
Forest fragmentation means the disintegration of a large parcel of forested land into several small patches and less connected with each other. In the present study, the forest fragmentation has been expressed in terms of number of forest patches and non-forest patches per unit area. The number of forest patch per unit grid was evaluated based on the forest cover map prepared for the year 2015, it was converted to vector which was used for spatial analysis grid wise. The criteria for recognization of threats to forest ecosystem based on forest fragmentation were identified on number of forest fragmented patch. The forest fragmentation index > 70% as critical endangered, > 50% as endangered, > 40% as vulnerable, > 30% as near threatened and < 30% as least concern.
Forest fires
To analyze the forest fires analysis in the state of Jharkhand, the forest fire data was downloaded from Forest Survey of India (http://fsi.nic.in/forest-fire.php) from 2005 to 2016. The forest fire point file downloaded was in MS-EXCEL file with latitude and longitude. It was exported into shape file year wise using ARC/ GIS Software. The number of forest fires per unit grid was evaluated based on decadal forest fire data. The criteria for identification of forest fire ecosystem were based on number of forest fires. The number of fires >21 as critical endangered, 20-12 as endangered, 11-6 as vulnerable, 5-1 as near threatened and 0 as least concern.
Conservation priority hotspots
The analysis so far has considered as a single potential threat factor. Here, we focus on threatened forest ecosystems which are facing multiple threats like deforestation, fire and fragmentation rather than single threat factor, as the most prominent, readily useful and identifiable zones for high conservation priority. The values for categories derived from Deforestation, Forest fragmentation and Forest fire were in between 1-5 which, helped in determining the conservation status of the ecosystems. These factors represent equal weights such that they can be integrated to achieve various levels of ranking for conservation. They were classified into five categories. The evaluation of the threats revealed that conservation biodiversity hotspot -1 has the highest threat value in range of 12-13, conservation priority hotspot-2 with threat value of 10–11, conservation priority hotspot-3 with threat value of 8–9, conservation priority hotspot-4 with threat value of 6–7, conservation priority hotspot-5 with threat value of 3–5.
Results
Deforestation
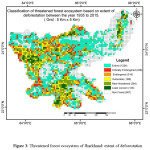
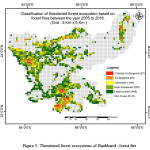
A metamorphosis if the forest cover was observed during 1935–2015 (Table 2 and Figure 3).Based on this, the study identified 1224 extinct, 248 Critically Endangered, 318 Endangered, 396 Vulnerable, 284 nearly threatened and 126 least concern ecosystems. Most of the least concern ecosystem is in the middle of the forest surrounded by less dense forest highly inaccessible due to complexity of terrain and mostly away from population. The driving factors of deforestation between the period 1935 and 2015 were industrialization, urbanization, mining activity and transformation of forest land to other land use activity viz. dam construction, agriculture purpose etc. The loss in forest ecosystems was conspicuous in areas of high population density where anthropogenic activity is a major factor. The forest cover map (2015) had an overall accuracy of 94.1%. The value of the kappa statistic was 0.91.
 |
|
Fragmentation
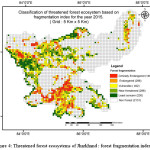
Patterns of forest fragmentation were identified across the state of Jharkhand.The study identified 148 grids under the category of high fragmentation index and assigned as Critically Endangered, followed by 296 Endangered, 402 Vulnerable, 296 nearly threatened and 230 least concern ecosystems (Table 2 and Figure 4). The severe forest fragmentation was found in southern part of Ranchi, eastern part of Garhwa, western part of Palamu and southern part of Gumla district require immediate conservation efforts in order to arrest further deterioration due to land use practices.
 |
|
Forest fires
The average of 12 years (2005-2016) indicates Jharkhand face 452 number of forest fire every year. In the year 2010 the forest fire frequency was roughly 3 times higher with the annual average, the same year was also declared as drought year (http://nidm.gov.in/PDF/DP/JHARKHAND.pdf). The forest fire analysis reveals the very high identified 27 grids is under high forest fire impact and categorized as Critically Endangered, followed by 85 Endangered,184 Vulnerable, 628 nearly threatened and 448 least concern ecosystems (Table 3 and Figure 5). Study reveals 67.3% of grid cell of Jharkhand forest was affected with fire. Very highly forest fire grid falls in South of Jharkhand (Pachim Singhbhum district area) , North west of Jharkhand (south of Palamu and Garhwa district area) and North east of Jharkhand (at the junction of Pakur, Sahabganj and Godda district area). The Pascim Singhbhum and Palamu district together roughly receive 50 % of annual forest fire. Therefore immediate conservation efforts are required in severe forest fire grids of Pascim Singhbhum and Palamu district to arrest further deterioration.
 |
|
Conservation priority hotspots
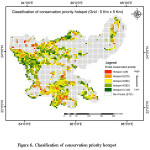
The above analysis advocates the present situation of the threatened forest ecosystem facing risk from the above mentioned factors. The high conservation priority in threatened ecosystem is considered as hotspot-I, followed by hotspot-II, hotspot-III, hotspot-IV and lowest conservation priority is for hotspot-V.
Around 2.1% (29 grids of the existing forest) have reported severe ecosystem level risk and thus have been incorporated conservation priority hotspot-I, suceeded by 19.7% (270 grids of forest) in conservation priority hotspot-II, 41.3% (566 grids of forest) in conservation priority hotspot-III, 27.8 % (382 grids of forest) in conservation priority hotspot-IV and 9.1% (125 grids of forest) in conservation priority hotspot-V, (Figure 6). The majority of conservation priority hotspot-I mostly falls in West Singhbhum, Ranchi, Palamu and Garhwa district.
Similar studies carried out for the states of Orissa and Telangana have reported considerable loss of biodiversity at ecosystem level. It was observed in Orissa state that 326 grids of existing forest constitute 5.8% which face serious ecosystem level risk and were assigned under conservation priority hotspot-I.5 In Telangana state, 39 grids of existing forest (2.1%) had reported acute ecosystem level risk and placed under conservation priority hotspot-I.24
The regions reported to have exceeding risk have been prioritized since the prospects for loss of species in such areas increases. Thus, understanding the conservation priority hotspots helps directly in conservation programs of forest ecosystems.
 |
|
Table 2: Threatened forest ecosystems analysis based on deforestation, fragmentation and forest fire.
|
Ecosystem |
Deforestation |
Fragmentation
|
Forest fire
|
|||
|
No. of grids |
% of grids |
No. of grids |
% of grids |
No. of grids |
% of grids |
|
|
Extinct |
1224 |
34.9 |
||||
|
Critically Endangered |
248 |
7.1 |
148 |
4.2 |
27 |
0.8 |
|
Endangered |
318 |
9.1 |
296 |
8.4 |
85 |
2.4 |
|
Vulnerable |
396 |
11.3 |
402 |
11.5 |
184 |
5.3 |
|
Near Threatened |
284 |
8.1 |
296 |
8.4 |
628 |
17.9 |
|
Least Concern |
126 |
3.6 |
230 |
6.6 |
448 |
12.8 |
|
Non-forest |
907 |
25.9 |
2131 |
60.8 |
2131 |
60.8 |
|
3503 |
100 |
3503 |
100 |
3503 |
100 |
|
Discussion
The above analysis has attempted to evolve maps based on multiple grid analysis. Ecosystem degradation drivers such as (1) deforestation, (2) fragmentation and (3) forest fire play a vital role in the forest degradation. Such geospatial approach identifies all the forest ecosystems threats which can be grouped under various categories. They are responsible for degradation of forests within the state which is a home to the tribes and supports a large number of flora and fauna. Hence, there is an urgent need to formulate the conservation measures and strategies along with environmental education and people participation which would involve local bodies to manage biodiversity in conservation priority hotspots. It is recommended that an immediate and suitable conservation action plan for the identified hotspots of study area be implemented.
Systematic forest restoration activities are required in conservation priority hotspots-I, II and III. Jharkhand has witnessed severe forest fire in the past and the year 2010 was the worst. In the year 2017 it is reported that only within 5 days (from 1st April to 5th April) 441 forest fires were recorded by the Forest Survey of India (FSI). There is a need to formulate the forest fire policies at state and country level to safeguard the forests. Infrastructure development which bifurcate the forests should be discouraged.
Authors’ contributions
FA conceived the idea and analyzed the satellite and ancillary data in GIS domain and drafted the manuscript, LG supervised the analysis and improved the manuscript. All authors read and approved the final manuscript.
Competing interests
The authors declare that they have no competing interests.
Acknowledgment
The authors are grateful to the USGS for providing free download of Landsat data. www.divagis.com provided the required GIS layers for free download.
The current work was carried out without any funding.
References
- WRI-IUCN-UNEP. Global Biodiversity Strategy: Guidelines for Action to Save, Study, and Use Earth’s Biotic Wealth Sustainably and Equitably. World Resource Institute, Washington, D.C. (1992)
- Kapos, V., & Iremonger, S.F., Achieving Global and Regional Perspectives on Forest Biodiversity and Conservation. In: Assessment of Biodiversity for improved Forest Planning. Proceedings of the conference on Assessment of Biodiversity for improved Planning, 7-11 October 1996, Monte Verita, Switzerland. (eds.). P. Bachmann, M. Kohl, and R. Paivenen. Kluwer Academic Publishers, London. pp 3-13. (1998)
- WCMC, World Conservation Monitoring Centre. Global Biodiversity: Status of the Earth’s Living Resources. Chapman and Hall, London. (1992)
- Jha, C.S., Goparaju, L., Tripathi, A., Gharai, B., Raghubanshi, A.S., & Singh, J.S., Forest fragmentation and its impact on species diversity: an analysis using remote sensing and GIS. Biodiversity and Conservation 14(7): 1681–1698. (2005)
CrossRef - Reddy, C. S., Khuroo, A. A., Harikrishna, P., Saranya, K. R. L., Jha, C. S., & Dadhwal, V. K., Threat evaluation for biodiversity conservation of forest ecosystems using geospatial techniques: a case study of Odisha, India. Ecological Engineering, 69: 287–303. (2014)
CrossRef - Peterken, G.F., Natural Woodland: Ecology and Conservation in Northern Temperate Regions. Cambridge University Press, Cambridge. (1996)
- Dale, V.H., & Pearson, S.M., Quantifying Habitat Fragmentation due to Land use change in Amazonia. In: Tropical Forest Remnants: ecology, management and conservation of fragmented communities. (eds.). W.F. Laurance., and R.O. Bierregaard, Jr. University of Chicago Press, Chicago, USA. pp 400-409. (1997)
- Harris, L.D., The fragmented Forest: Island Biogeography Theory and the Preservation of Biotic Diversity. University of Chicago Press, Chicago. (1984)
- Goparaju L., Tripathi A.,& Jha C.S., Forest fragmentation impacts on phytodiversity – An analysis using remote sensing and GIS, Current Science 88: 1264-1274. (2005)
- Goparaju L. & Jha C.S., Spatial analysis of plant communities in fragmented forest of dry tropics in Vindhyan highlands using remote sensing and GIS, International Journal of Tropical Ecology 51(1): 55-65.(2010)
- Potter,S.C., Terrestrial biomass and the effects of deforestation on the global carbon cycle results from a model of primary production using satellite observation. Bioscience 49, 769–778.(1999)
CrossRef - MacArthur, R.H.,& Wilson, E.O., The theory of island biogeography. Princeton University Press. Princeton, NJ. (1967)
- McNeely, J.A., Miller, K.R., Reid, W.V., Mittermeier, R.A., & Werner. T.B., Conserving the World's Biological Diversity. Gland, Switzerland: and Washington, D.C.: IUCN, WRI, CI, WWF-US, and the World Bank. (1990)
- Noss, R.F., Indicators for monitoring Biodiversity: A Hierarchical Approach. Conservation Biology 4(4): 355-364. (1990)
CrossRef - Pal, M., Mather, P.M., Assessment of the effectiveness of support vector machines for hyperspectral data. Future Gener. Comput. Syst. 20, 1215–1225. (2004)
CrossRef - Hansen, M.C.,& Loveland, T.R., A review of large are monitoring of land cover change using Landsat data. Remote Sens. Environ.122, 66–74. (2012)
CrossRef - Ahmad, F., & Goparaju, L., Geospatial Assessment of Forest Fires in Jharkhand (India) Indian Journal of Science and Technology. 10(21): DOI: 10.17485/ijst/2017/v10i21/113215 (2017a)
CrossRef - Ahmad, F. & Goparaju, L., Long term deforestation assessment in Jharkhand state, India: A grid based geospatial approach. Biological Forum 9(1):183-188. (2017b)
- Shi, H., & Singh, A., An assessment of biodiversity hotspots using remote sensing and GIS, J Indian Soc. Remote Sens. 30: 105 (2002)
CrossRef - Roy, P.S., & Behera, M., Biodiversity characterization at landscape level. Tropical ecology 43 (1), 151-171. (2002)
- Scott, J. M., Davis, F., Csuti, B., Noss, R., Butterfield, B., Groves, C., Anderson, H., Caicco, S., DiErchia, F., Edwards, T. C., Ulliman, J., &Wright, R. G., Gap analysis: A geographic approach to protection of biological diversity. Wildlife Monographs, 123: 3-41.(1993)
- Ramesh, B.R., Menon, S., & Bawa, K.S., A vegetation based approach to biodiversity gap analysis in the Agastyamalai Region, Western Ghats, India. Ambio 26(8), 529-536. (1997)
- Jha, C.S., Dutt C.B.S.,& Bawa K.S., Deforestation and land use changes in Western Ghats, India. Current Science 79: 231–238. (2000)
- Reddy,C.S., Pasha,S.V., Jha, C.S. & Dadhwal, V.K., Geospatial characterization of deforestation, fragmentation and forest fires in Telangana state, India: conservation perspective. Environ Monit Assess. 187(7):455. (2015)
CrossRef - Kanga, S. & Singh. S.K., Forest Fire Simulation Modeling using Remote Sensing & GIS. International Journal of Advanced Research in Computer Science 8(5):326-332. (2017)
- Dungdung, G., Mission Saranda. Publisher: Desaj Prakashan, Bihar-Jharkhand. pp. 75(2015) ISBN 978-81-908959-8-9
- Priyadarshini, N., Impact of mining and industries in Jharkhand. http://www.sacw.net/article302.html# (Accessed on 22nd March 2017). (2008)
- IUCN., Guidelines for using the IUCN Red List categories and criteria. Version 8.0. Standards and Petitions Subcommittee of the IUCN Species Survival Commission, IUCN, Species Survival Commission, Gland. (2010)
- Sabins, F. F. Jr., Remote sensing principles and interpretation. 2nd ed., - 499 pp., San Francisco (Freeman). (1987)
- FAO., Assessing forest degradation—towards the development of globally applicable guidelines. Forest Resources Assessment Working Paper, 177. Rome. (2011).
- Keith, D.A., Rodriguez, J.P., Rodriguez-Clark, K.M., Nicholson, E,, Aapala, K., et al., Scientific foundations for an IUCN Red List of ecosystems. PloS One 8(5). (2013)
CrossRef


