Correlation Studies for Morphological and Biomass Traits in Half Sib Families of Terminalia Arjuna (L.)
Hemant Kumar 1 * , S. B. Lal 1 and A. M. Wani 1
http://dx.doi.org/10.12944/CWE.12.2.18
Estimation of phenotypic and genotypic correlation between various traits provides necessary information in breeding program, when selection is based on two or more characters. The intensity and trend of association among characters may be estimated by genetic coefficients of correlations and genotypic and phenotypic coefficient of correlation depending on the type of materials studied. The knowledge of genetic inter-relationship between characters is also of theoretical and practical interest because a genotypic correlation may drive genetic linkage or from developmental induced relationships between components that are only indirectly the consequences of gene action. Terminalia arjuna is a medium to large sized fast growing versatile tree popularly known as Arjun. It has immense economic potential in various industries viz., pharmaceutical, timber, paper, soap, tannin, dye, match, food, fodder and fuel. Thirty candidate plus trees (CPTs) of T. arjuna were selected as seed source from 30 different provinces of Uttar Pradesh for the study of correlation study morphological & biomass traits. After 12 months of growth under nursery condition, data were collected and analyze for association studies. Present study concludes that magnitudes of phenotypic correlation coefficients were lower compare to corresponding genotypic values. A strong positive and highly significant phenotypic correlation with collar diameter, bark content, fresh shoot weight, dry shoot weight, fresh root weight, dry root weight and total biomass of seedling were exhibited. Therefore, these characters may be given proper emphasis during selection and breeding program of Arjun tree species where the amount of leaf, bark and biomass production is of immense importance.
Copy the following to cite this article:
Kumar H, Lal S. B, Wani A. M. Correlation Studies for Morphological and Biomass Traits in Half Sib Families of Terminalia Arjuna (L.). Curr World Environ 2017;12(2). DOI:http://dx.doi.org/10.12944/CWE.12.2.18
Copy the following to cite this URL:
Kumar H, Lal S. B, Wani A. M. Correlation Studies for Morphological and Biomass Traits in Half Sib Families of Terminalia Arjuna (L.). Curr World Environ 2017;12(2). Available from: http://www.cwejournal.org/?p=17436
Download article (pdf) Citation Manager Publish History
Introduction
Terminalia arjuna is a fast growing tree having high biomass production potential and ability to grow on marginal and degraded lands. It has immense economic importance in various industries viz., pharmaceutical, timber, paper, soap, match, food, fodder and fuel. The dried stem bark of Terminalia arjuna has been used widely as a drug in Ayurvedic medicine as a cardio-tonic, for injury or wound, blood disorders, obesity, urinary disorders and ulcer or wound. The tree species is usually used in agro and social forestry for reclamation of degraded lands. For instance saline and alkaline soils, deep ravines and mine spoil. The growing interest in the bark of Terminalia arjuna and the realization of the need for raising high biomass and bark yielding plantations has led to the search for technologies for its growth and profitable production.24 Owing to the multipurpose value of T. arjuna, the need for its adequate regeneration is important. Collection of seeds at the appropriate time, consideration of seed size and pre-sowing treatments have been found to be useful for improving seedling traits in some species of Terminalia.2,3 Selection of superior genotypes and seeds size may be useful for efficient germination and establishment of seedlings.31 Effect of seed source on seedling emergence and growth parameter in T. arjuna under nursery conditions is reported in this research paper. The effectiveness of tree improvement program largely depends upon the nature and magnitude of existing genetic variability and also on the degree of transmission of traits.4 Genetic diversity in plant species is a gift to a mankind as it forms the basis for selection and further improvement. The overall expression of a traits is sum total of the contribution of so many other characters and therefore, screening/ selection should be required on the basis of components contributing towards that dominant character. Correlation study is biometrical tools which gives idea about the extant and degree of association between various traits. So, the knowledge of association for different characters among themselves is of utmost importance for any improvement program. Based on the estimation of genotypic and phenotypic correlations the breeder decides the breeding methodology to be followed so that the useful correlations can be exploited and the undesirable ones put off by generating fresh variability to obtain new recombinants.12 Estimation of phenotypic and genotypic correlation between various traits provides necessary information in breeding program, when selection is based on two or more characters. The intensity and trend of association among characters may be estimated by genetic coefficients of correlations and genotypic and phenotypic coefficient of correlation depending on the type of materials studied. The knowledge of genetic inter-relationship between characters is also of theoretical and practical interest because a genotypic correlation may drive genetic linkage or from developmental induced relationships between components that are only indirectly the consequences of gene action. Therefore, present study was undertaken to scrutinize the simple, genotypic and phenotypic correlation among different morphological and biomass traits to find out which characters should be given more emphasis. To overcome the future demand for fuel, fodder and pharmaceuticals, it play vital role in establishment and extensive scale plantations. However, shortage of elite planting material, low seed viability and insufficient seed germination are some important factors which hindered the improvement of Terminalia arjuna.
Material and Methods
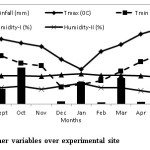
The investigation was carried out in Research Farm of College of Forestry SHUAT, Allahabad, U. P. during 2014-15 to find the association between seed size and germination parameter. The experimental site is at elevation of 98 m above sea level at 28.87° N latitude and 81.15° E longitude. The characteristics of the soil are sandy loam in order to Inceptisol soil. The research area has a sub-tropical climate with extremes of summer and winter. During the summer season, the temperature reaches 460C to 480C, while during winter season, especially in the month of Nov. and Jan. temperature drops down to as low as 1-20C. During winter, frost and during summer, hot scorching wind are common features. The average rainfall in this area is around 882 mm, during the monsoon i.e. June to Sept, with a few occasional light showers and drizzles are seen in the winter also.
More than 3000 mature fruits were collected from different parts of the crown of an individual plus tree selected from 30 different locations of state Uttar Pradesh30 (Table: 1). The fruits were cleaned and stored in muslin bags at ambient conditions before sowing. All lots were dried under similar temperature and humidity to reach constant weight. Observations on fruit characters were taken of plus tree and replication wise. Dark brown, matured (ripened) seeds of T. arjuna, were collected from different parts of Uttar Pradesh in the month of March 2014. For taking observations on seedling characters, 30 fruits / tree was collected randomly from different parts of the tree and average of 30 fruits measurement was recorded for fruit length, width and fruit weight for sorting and seedling establishment in the nursery. The seed sample comprised large and small seeds, which were separated out for experimental purpose. All the seeds were weighed (digital electronic balance, Mx 7000 series) and the length and diameter (Digital Vernier calipers) of the seeds were also measured. Air-dried seeds of each category were given pre-germination treatments of 2 days of water soaking and sown in triplicate (each replicate containing 20 seeds) under nursery conditions (100 × 152 mm polybags (containing soil, farmyard manure [FYM], and sand in a ratio of 1:1:1) at a depth of 20 mm in the first week of July. The seedlings were regularly monitored in terms of the growth over a period of 12 months. The data on morphological and biomass characters viz., morphological and biomass characters viz., seedling height, collar diameter, intermodal length, leaf area, bark content, fresh shoot weight, dry shoot weight, fresh root weight, dry root weight, shoot/root ratio, wood specific gravity and total biomass were recorded in each replicate and averaged. The data were subjected to statistical analysis and Karl Pearson’s (simple) correlation coefficient was worked out22 whereas, phenotypic and genotypic correlation coefficients were estimated as per the methodology.11
Results and Discussion
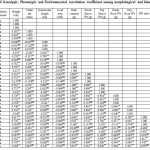
The nature and magnitude of variation and correlation studies in a selected parent population is one of the prerequisite in any genetic improvement program.20 Correlation study is necessary to obtain the response of various traits to the characters interesting for selection.13 Breeders also plans about breeding methodology on the genotypic and phenotypic correlation estimates. Therefore, genotypic, phenotypic and environmental correlation has been worked out using mean value (Table: 2) of traits to estimate the magnitude of association between the characters. Out of 198 correlation coefficient among morphological and biomass traits, 81 were found positive and highly significant (at 1%), 3 positive significant (at 5%), 41 positive non-significant, 15 highly negative significant, 11 negatively significant while 45 are negatively non-significant.
Phenotypic Correlation Coefficient
An inquisition of Table 3, revealed that the seedling height exhibited positive and highly significant correlation (at 1% level of significance) with collar diameter (0.382), bark content (0.762), fresh shoot weight (0.765), dry shoot weight (0.765), fresh root weight (0.739), dry root weight (0.740), shoot/root ratio (0.617) and total biomass of seedling (0.762) while, positive and non-significant association with intermodal length (0.048). The negative and significant correlation is found in leaf area (-0.235) and wood specific gravity (-0.280). Collar diameter depicted positive and highly significant correlation with bark content (0.264), fresh shoot weight (0.276), dry shoot weight (0.272), fresh root weight (0.288), dry root weight (0.289 and total biomass of seedling (0.276) while positive and non-significant correlation is in shoot/root ratio (0.027). The intermodal length shows negative and non-significant correlation (-0.057) while negative and significant correlation was found in wood specific gravity (-0.435) and leaf area (-0.228). Intern-odal length exhibited positive and significant correlation with leaf area (0.624) while non-significantly correlated with bark content (0.010), fresh shoot weight (0.020), dry shoot weight (0.006), fresh root weight (0.020), dry root weight (0.012), wood specific gravity (0.178) and total biomass of seedling (0.007). Leaf area revealed positive and non- significant correlation with bark content (0.011) and wood specific gravity (0.062) whereas bark content (-0.076), fresh shoot weight (-0.085), dry shoot weight (-0.083), fresh root weight (-0.088), dry root weight (-0.086), shoot/root ratio (-0.076) and total biomass of seedling (-0.084) showed negative and non-significant correlation. Bark content exhibited positive and significant correlation with fresh shoot weight (0.998), dry shoot weight (1.00), fresh root weight (0.983), dry root weight (0.983), shoot/root ratio (0.636) and total biomass of seedling (0.999) whereas, wood specific gravity showed negative and non-significant correlation (-0.144). Fresh shoot weight resulted positive and highly significant correlation with dry shoot weight (0.998), fresh root weight (0.986), dry root weight (0.985), shoot/root ratio (0.624) and total biomass of seedling (0.998) whereas negatively and non-significant correlated with wood specific gravity (-0.149). Dry shoot weight showed positive and highly significant correlation with fresh root weight (0.984), dry root weight (0.983), shoot/ root ratio (0.634) and total biomass of seedling (0.999) whereas negatively and non-significant correlated with wood specific gravity (-0.149).
Fresh root weight exhibited positive and highly significant correlation with dry root weight (0.996), shoot/root ratio (0.521) and total biomass of seedling (0.989) while wood specific gravity (-0.111) showed negative significant correlation. Dry root weight revealed positive and significant correlation with shoot/root ratio (0.509) and total biomass of seedling (0.989) while wood specific gravity (-0.110) showed negative significant correlation. Shoot/root ratio showed negative significant correlation wood specific gravity (-0.262) while positive and significant correlation with total biomass of seedling (0.612). Wood specific gravity has negative and significant correlation with total seedling biomass (-0.140). Phenotypic correlation is higher than the genotypic correlation because it is accumulation of genotype as well as environmental influence. The characters like collar diameter, bark content, fresh shoot weight, dry shoot weight, fresh root weight, dry root weight and total biomass have more environmental influence hence shows higher correlation compare to inter-nodal length, shoot-root ratio and specific gravity.
Genotypic correlation coefficient
Perusal of Table 3 revealed that the genotypic correlations were found significant for most of the character combinations studied, thereby suggesting the strong association of the character at genotypic level. Seedling height exhibited positive and highly significant correlation (at 1% level of significance) with collar diameter (0.424), bark content (0.770), fresh shoot weight (0.772), dry shoot weight (0.773), fresh root weight (0.752), dry root weight (0.753) shoot/root ratio (0.756) and total biomass of seedling (0.770) while intermodal length showed positive and non-significant correlation(0.051). The leaf area (-0.278) and wood specific gravity (-0.399) shows negative and highly significant correlation. Collar diameter have positive and highly significant correlation with bark content (0.288), fresh shoot weight (0.305), dry shoot weight (0.297), fresh root weight (0.320), dry root weight (0.313) and total biomass of seedling (0.300) whereas positive non-significant correlation with shoot/root ratio (0.063). The intermodal length (-0.122), leaf area (-0.317), wood specific gravity (-0.654) shows negative correlation. Intern-odal length exhibited positive and highly significant correlation with leaf area (0.799) and wood specific gravity (0.328) whereas bark content (0.029), fresh shoot weight (0.031), dry shoot weight (0.025), fresh root weight (0.038), dry root weight (0.032), and total biomass of seedling (0.026) show positive non-significant correlation. The shoot/root ratio recorded negative correlation (- 0.050). Leaf area revealed positive and non-significant correlation with wood specific gravity (0.110) whereas bark content (-0.086), fresh shoot weight (-0.096), dry shoot weight (-0.094), fresh root weight (-0.095), dry root weight ((-0.104), shoot/root ratio (-0.080) and total biomass of seedling (-0.096) have negative and non-significant correlation. Fresh shoot weight have positive and highly significant correlation with dry shoot weight (0.999), fresh root weight (0.992), dry root weight (0.992), shoot/root ratio (0.753) and total biomass of seedling (0.999) whereas wood specific gravity (-0.202) shows negative and significant correlation. Dry shoot weight showed positive and highly significant correlation with fresh root weight (0.991), dry root weight (0.990), shoot/ root ratio (0.760) and total biomass of seedling (1.00) whereas wood specific gravity (-0.208) shows negative and significant correlation. Fresh root weight exhibited positive and highly significant correlation with dry root weight (1.00), shoot/ root ratio (0.675) and total biomass of seedling (0.994) while, wood specific gravity (-0.160) shows negative and significant correlation. Dry root weight revealed positive and highly significant correlation with shoot/root ratio (0.683) and total biomass of seedling (0.994) while negative correlation with wood specific gravity (-0.158). Shoot root ratio revealed positive and highly significant correlation with total seedling biomass (0.747) while negatively correlated with wood specific gravity (-0.392).Wood specific gravity has negative and significant correlation with total seedling biomass (-0.199). Genotypic correlation is result of either linkage action of pleotropic action or more likely both.
Environmental correlation coefficient
Table3 depicted the seedling height shows negative and non-significant environmental correlation with collar diameter (-0.070), bark content (-0.251), fresh shoot weight (-0.127), dry shoot weight (-0.223), fresh root weight (-0.278), dry root weight (-0.248),shoot/root ratio (- .018)and total biomass of seedling (-0.290) whereas intermodal length (0.082),leaf area (0.020), and wood specific gravity (0.087) have positive and non-significant correlation. Collar diameter shows positive non-significance correlation with intermodal length (0.191), leaf area (0.096) bark content (0.031), dry shoot weight (0.030),dry root weight (0.088) and total biomass of seedling (0.061) while fresh shoot weight (-0.150), fresh root weight (-0.082),shoot/root ratio (-0.091) and wood specific gravity (-0.006) have negative and non-significant correlation. Inter-nodal length exhibited negative and significant correlation with bark content (-0.507), fresh shoot weight (-0.333), dry shoot weight (-0.509), fresh root weight (-0.231), dry root weight (-0.276), specific gravity (-0.077) and total biomass of seedling (-0.547) whereas leaf area (0.129) and shoot/root ratio (0.039) have positive non-significant relation. Leaf area showed positive and non-significant correlation with dry root weight (0.043) while bark content (-0.078), fresh shoot weight (-0.134), dry shoot weight (-0.081), fresh root weight (-0.136), shoot/root ratio (-0.066), wood specific gravity (-0.016) and total biomass of seedling (-0.052) shows negative and non-significant correlation. Fresh shoot weight resulted positive and highly significant correlation with dry shoot weight (0.652) and total biomass of seedling (0.561) while, positive non-significant correlation with fresh root weight (0.155), dry root weight (0.065) and shoot/root ratio (0.175). Wood specific gravity shows negative and non – significant correlation (-0.090). The dry shoot weight showed positive and highly significant correlation with total biomass of seedling (0.920) while positive and non- significant correlation with fresh root weight (0.124), dry root weight (0.152), shoot/ root ratio (0.270) and wood specific gravity (0.109). Fresh root weight exhibited positive and highly significant correlation with dry root weight (0.659) and total biomass of seedling (0.364) while, shoot/root ratio (-0.511) showed negative correlation. Wood specific gravity has positive non-significant correlation (0.185). Dry root weight revealed positive and highly significant correlation with total biomass of seedling (0.527) and negative association with shoot/root ratio (-0.784) while wood specific gravity have positive non-significant correlation (0.045). Shoot root ratio have negative and non-significant correlation with wood specific gravity (-0.073) total biomass of seedling (-0.073). Wood specific gravity has positive non-significant relation with total biomass of seedling (0.112).The value of environmental correlation is very low in compare to genotypic or phenotypic correlation. This is due to high contribution of genotypic influence of the genotypes. These findings are also in close conformity with the findings in Terminalia bellerica and Santalum album, and Eucalyptus grandis.14,15,23,26,27,28
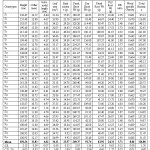
Table 1: Details of morphological observations and other relevant information for 30 CPTs of Terminalia arjuna
|
Seed source |
Location |
Latitude |
Longitude |
Age of tree (years) |
Tree height (m) |
Tree girth (cm) |
Fruit length (mm) |
Fruit width (mm) |
|
S 1 |
Chaman bagh, Fatehpur |
25094’N |
80080’E |
10-12 |
14.00 |
72.10 |
31.07 |
22.94 |
|
S 2 |
Allen forest , Kanpur |
26050N |
80030’E |
12-18 |
16.00 |
85.90 |
27.04 |
20.27 |
|
S 3 |
Cant, Varanasi |
25033’N |
82098’E |
12-15 |
14.00 |
73.40 |
42.04 |
31.14 |
|
S 4 |
Kendriya Vidyalaya, Basti |
26080’N |
82070’E |
10-15 |
12.00 |
78.60 |
41.90 |
31.24 |
|
S 5 |
Baghauch ghat, Deoria |
26.57’N |
84.00’E |
10-15 |
16.00 |
84.10 |
39.57 |
29.14 |
|
S 6 |
Fazil nagar, Kushinagar, |
26068’N |
84005’E |
15-17 |
12.00 |
78.10 |
39.77 |
29.10 |
|
S 7 |
Kartaniaghat Range Office, Bahraich |
28033’N |
81013’E |
12-16 |
14.00 |
114.20 |
38.77 |
29.04 |
|
S 8 |
Irrigation Department, Gonda |
27013’N |
81095’E |
15-17 |
12.00 |
74.30 |
29.17 |
21.70 |
|
S 9 |
Kawwa Bagh Colony, Gorakhpur |
26075’N |
83038’E |
11-14 |
10.00 |
73.10 |
31.77 |
23.77 |
|
S 10 |
Gandhi Udhyan, Bareilly |
28034’N |
79043’E |
10-13 |
15.00 |
77.20 |
25.67 |
19.24 |
|
S 11 |
Railway station road, Sirathu, Kaushambhi |
25065’N |
81032’E |
12-14 |
14.00 |
87.30 |
38.10 |
28.34 |
|
S 12 |
Sita samahit sthal sitamarhi, Bhadohi |
25027’N |
82026’E |
11-12 |
14.00 |
112.10 |
32.87 |
24.53 |
|
S 13 |
Kukrail , Lucknow |
26091’N |
80098’E |
11-16 |
14.00 |
114.70 |
32.57 |
24.34 |
|
S 14 |
U P Forest Corporation Lakhimpur, |
27094’N |
80079’E |
14-15 |
11.00 |
82.20 |
31.27 |
23.27 |
|
S 15 |
Company Garden Beribagh, Saharanpur, |
29097’N |
77056’E |
12-16 |
11.00 |
102.30 |
23.84 |
18.24 |
|
S 16 |
SHUATS, Allahabad |
25041’N |
81085’E |
15-18 |
17.00 |
71.80 |
23.94 |
17.97 |
|
S 17 |
Shahjahanpur road , Sitapur |
27058’N |
80065’E |
11-15 |
12.00 |
85.30 |
22.90 |
17.17 |
|
S 18 |
V.B.S.Purvanchal University, Jaunpur |
25083’N |
82068’E |
12-15 |
11.00 |
54.80 |
20.34 |
15.44 |
|
S 19 |
Railway ground, Mau |
25094’N |
83056’E |
12-17 |
10.00 |
75.70 |
21.10 |
15.94 |
|
S 20 |
Obra forest , Sonbhadra |
24046’N |
82099’E |
12-16 |
11.00 |
68.30 |
25.37 |
18.97 |
|
S 21 |
Malka Park, Bulandshahar |
28041’N |
77085’E |
15-18 |
11.00 |
98.10 |
25.20 |
18.77 |
|
S 22 |
Deer park, Moradabad |
28082’N |
78081’E |
10-14 |
10.00 |
62.80 |
29.04 |
21.60 |
|
S 23 |
Company Garden, Pratapgarh |
25092’N |
82007’E |
12-14 |
11.00 |
68.80 |
25.77 |
19.40 |
|
S 24 |
Gandhi Park, Meerut Cantt |
29001’N |
770 70’E |
11-15 |
14.00 |
111.10 |
25.37 |
18.93 |
|
S 25 |
Indira Gandhi Vanaspati Udyan, Raibareily |
26020’N |
81025’E |
12-15 |
11.00 |
102.20 |
33.57 |
24.97 |
|
S 26 |
Barkachha, Mirzapur |
25005’N |
82060’E |
12-15 |
10.00 |
96.30 |
14.80 |
12.48 |
|
S 27 |
Lohiya park, Kanauj |
27001’N |
79092’E |
11-16 |
11.00 |
66.20 |
22.33 |
16.60 |
|
S 28 |
Katai Mill, Banda |
25051’N |
80034’E |
11-16 |
10.00 |
61.70 |
23.44 |
17.60 |
|
S 29 |
Dr. Bhimrao Ambedkar Park, Unnao |
26055’N |
80048’E |
12-16 |
10.00 |
62.60 |
23.03 |
17.24 |
|
S 30 |
Aarogya Dhaam Chitrakoot |
25016’N |
80086’E |
11-16 |
14.00 |
90.20 |
24.94 |
18.60 |
 |
|
 |
|
 |
|
Conclusion
The results of present study revealed that the magnitudes of phenotypic correlation coefficients were lower compare to corresponding genotypic values. A strong positive and highly significant phenotypic correlation exhibited with collar diameter, bark content, fresh shoot weight, dry shoot weight, fresh root weight, dry root weight which influences the total biomass of seedling of Terminalia arjuna. Therefore, these characters may be given proper emphasis during selection and breeding program of Arjun tree species for achieving better results on yield where the amounts of leaf, bark and biomass production are of immense importance.
Acknowledgment
The authors are grateful to the College of Forestry & Environment, Sam Higginbottom University of Agriculture Technology and Sciences, (Formerly Allahabad Agriculture Institute), Allahabad, India for providing all necessary helps and facilities during the course of experiment and valuable comments of anonymous reviewers helped us a lot to improve this manuscript.
References
- Aabd, N.A., Ajodi, F.E., Msanda, E. and Mousadik, A.E. Evaluation of agro morphological variability of Argan tree under different environmental conditions in Morocco: implications for selection. J. Biodiversity & Cons., 3(3):73-82(2011).
- Agboola, D.A. E.O. Etejere, M.O. Fawole. Effect of orientation and soil types on germination of seeds of some tropical forest tree species, Seed Research, 21 , pp. 13-20, (1993)
- E.M. Germination of Terminalia sericeaBuch ex DC seeds: effect of temperature regime, photoperiod, gibberellic acid and potassium nitrate, American-Eurasian Journal of Agricultural and Environmental Sciences, 8, pp. 722-727, (2010).
- , R.K. and S.V. DWIVEDI. Association studies for morphological and biomass traits of Bauhinia variegata Linn, International Journal of Agricultural Sciences, 10 (1), 61-65(2014).
- Andrew, I. A.. Variation in leaf morphology among provenance of Eucalyptus camaldulensis Rhodisia Agriculture Research, (11), pp.159-169(1973).
- Troup’s the silviculture of Indian trees. Vol. IV, Delhi: controller of Publication (1983).
- Bhat, G.S.; and Chauhan, P.S. Seed source variation in seed and seedling traits of Albezzia lebbek J. Tree Science, 21(1-2), pp. 52-57(2003).
- Burley, J.; and Burrows, P. M. Multivariate analysis of variation in species in needles among provenances of Pinus kesiya Silvae Genetica, (21), pp.69-77(1972).
- Chaturvedi, O.P.; and Pandey, N.. Correlation and path analysis studies between biomass and other characters in Bombax ceiba Silvae. Genet., 53(5-6), pp.269-272(2004).
- Chauhan, V.K. and Verma, S.. Progeny performance of different provenances of Khair (Acacia catechu). Tree Sci., 12(1): 51-54(1993).
- Chavan, R., Viswanath, S. and Shivanna, H.. Correlation and path coefficient analysis in five casurina species for productivity of biomass. Kernataka J. Agric. Sci., 24(5):678-680(2011).
- Divakara, B.N.; Krishnamurthy, R.,. Genetic variability, association and divergence studies in seed traits and oil content of Madhuca latifolia accessions. J. Oilseeds Res., (26), 686-689(2009).
- Falconer, D.S.. Introduction to quantitative genetics. 2nd Longman, New York, U.S.A. (1989).
- Geera, Mohit and Gera, Neelu. Genetic variability and character association in Acacia catechu Indian Forester, 132: 785-795(2006).
- Gupta, Tara, Prakash, Tej and Gupta, R.K.. Genetic variability and correlation study in Acacia catechu seed source in Himachal Pradesh. Range Mgmt. & Agrofores., 33(1): 47-52(2012).
- Hosalli, Raveendra, B.. Variation and character association studies in some Leucaena species/ varieties. M.Sc. Thesis Dr.Y.S. Parmar University of Horticulture and Forestry, Solan, H.P. (INDIA) (1997).
- Jha, R.K.. Variability, associations, path coefficient and stability analysis in poplar (Populus deltoids ex Marsh). Indian J. Agroforestry, 11(1): 32-40(2009).
- Jha, Suman Kumar. Evaluation of open pollinated families of Dalbergia sissoo. Sc. Thesis, Dr. Y.S. Parmar University of Horticulture and Forestry, Solan, H.P. (INDIA) (2001).
- Katoch, R., Thakur, M., Kumar, N. and Bandhari, J.C. Golden timothy-present status and future perspectives in North West Himalayas. Range Mgmt. & Agroforest., 33(1): 1-7(2012).
- Majumder, D.A.N., Hassan, L., Rahim, M.A. and Kabir, M. A.. Correlation and path coefficient analysis of mango (Mangifera indica ). Bangladesh J. Agric. Res., 37 (3): 493- 503(2012).
CrossRef - Manga, V.K. and Sen, David N.. Variability and association among root and shoot traits in seedlings of Prosopis cineraria. J. Tree Sci., 17(1&2): 33-38(1998).
- Panse, V.G. and Sukhatme, P.V.. Statistical methods for agricultural workers. ICAR, New Delhi (INDIA) (1967).
- Patil, J.V., Deshmukh, R.B., Nambhal, N.D., Patil S.C. and Kunjir, N.T. Correlation and path analysis in Eucalyptus. Indian J. Forestry, 20(2): 132-135(1997).
- Rathore, P., R. Suthar, S.D. Purohit Micro propagation of Terminalia bellerica from juvenile explants, Indian Journal of Biotechnology, 7 , pp. 246-249(2008).
- Reddy, Manoj Kumar M. and Subramanian, Sukanya.. Correlation and path coefficient studies in sandal (Santalum album ). Ann. Forest., 6(1): 39-43. Searle, S.R. (1961) (1998).
- Srivastav, P.K., Beck, Shova, Brahmachari, B.N. and Thangavelu, K.. Correlation, path and coheritability studies in various genotypes of Terminalia arjuna , T. tomentosa W. and A. and their natural hybrids. Ann. Forest., 7(2): 243-250(1999).
- Subramanian, K.N., Mandal, A.K. and Necodemus, A. Genetic variability and character association in Eucalyptus grandis. Forestry, 3(2): 134-137(1995).
- Thakur, I.K, Thakur, R.C. and Gupta, A.. Variability, heritability and genetic advance estimates in Alnus nitida at nursery stage. Indian J. Tropical Biodiversity, 7-8(1-4): 73-76 (2000).
- Veerendra, H.C.S. and Shrama, C.R.. Variation studies in sandal (Santalum album): time of emergence and seedling vigour. Indian Foester, 116(17): 568-571(1990).
- Zobel, B. and Talbert. J. (1984). Applied forest tree improvement.
- Kuniyal, C.P., V. Purohit, J.S. Butola, and R.C. Sundriyal. "Seed size correlates seedling emergence in Terminalia bellerica", South African Journal of Botany, (2013).


