Radon Concentration Measurement in Groundwater of Roorkee, Uttarakhand, India
Pankaj Garg1 and Gopal Krishan1 *
1
National Institute of Hydrology,
Roorkee,
247667
Uttarakhand
India
http://dx.doi.org/10.12944/CWE.12.2.23
Groundwater is the largest fresh water resource and radon is a radioactive naturally occurring noble gas that may be found anywhere in soil, air and water due to decay of uranium in rocks. It is important to investigate the radon in groundwater to safeguard against the health hazard caused due radon. The results presented here are from radon concentrations measured using RAD7 detector in 9 representative groundwater samples collected from hand pumps from southern parts of Roorkee in Haridwar district of Uttrakhand. Radon activity concentration was found in the range of 0.55+0.22 Bq L-1 to 3.39+0.28 Bq L-1 with an average value of 2.16+0.37 Bq L-1. Radon values were compared with United State Environmental Protection Agency value of 11 Bq L-1. The radon activity trend was found within the permissible limit.
Copy the following to cite this article:
Garg P, Krishan G. Radon Concentration Measurement in Groundwater of Roorkee, Uttarakhand, India. Curr World Environ 2017;12(2). DOI:http://dx.doi.org/10.12944/CWE.12.2.23
Copy the following to cite this URL:
Garg P, Krishan G. Radon Concentration Measurement in Groundwater of Roorkee, Uttarakhand, India. Curr World Environ 2017;12(2). Available from: http://www.cwejournal.org/?p=17545
Download article (pdf) Citation Manager Publish History
Introduction
Human beings are vulnerable to more than half of the dose exposure from natural radiation sources1,2 of the radon (222Rn) and its progeny, produced during the radioactive decay chain of uranium (238U) contributing approximately 55% of internal radiation exposure to human life.3 Radon coming on to contact with the land surface get mixed with the groundwater depending on various factors and its level depends on the radium concentration.
Groundwater can create a health risk while acting as a carrier of radon into domestic environment4 and the levels of radon in indoor dwellings can be enhanced partially by radon derived from water supply.5,6 The exposure to high concentrations of radon can lead cancers of lung7 and stomach and gastrointestinal.8
Many researchers have conducted research all over the world for monitoring radon concentrations in different environments and efforts are on to find out the methods to reduce its adverse effects on the human beings9-16 and on the other side simultaneously finding its applications.17-19 In Uttarakhand various studies had been carried out in river waters of Garhwal and Shiwalik Himalayas and groundwater of the Doon valley where high radon concentrations have been reported.20-22 In Shivalik Himalyas of Himachal Pradesh,20 the radon concentration varied from 1.0 ± 0.3 to 653.5 ± 8.0 Bq L-1 where as in Doon valley,21 in tube wells and hand pumps radon concentration varied from 25.4 ± 1.8 to 92.5 ± 3.4 Bq L-1 with an average of 53.5 ± 2.6 Bq L-1.
Keeping in view the above points, the present study is carried out in southern part of Roorkee area of Uttarakhand, India to investigate the radon levels in groundwater as it is widely used for drinking.
Study Area
Roorkee lies on the coordinates 29°52’ N latitude, 77°53’ E longitude and altitude 268m. Normal rainfall is 1156.4 mm and monthly average maximum temperature range observed between 20.4 - 39.2 and minimum temperature range varied between 10.6 -27.223.
Roorkee is a part of Gangetic alluvial plains and lithologically, the alluvium is formed of unconsolidated to semi-consolidated deposits of sand, silt, clay and kankar. The ground water conditions in alluvial parts are considerably influenced by the varying lithology of the subsurface formations which has been found in various studies of parts of Gangetic basin.24-31
Methodology
9 representative groundwater samples from the hand pumps collected using standard methodology9 from the locations shown in table 1. The pH, EC and temperatures were recorded using hand held pH meter, EC meter and thermometer, respectively.
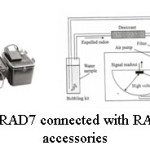
Radon concentrations in these samples were measured with RAD7 (Fig. 1), an electronic radon detector connected to a RAD-H2O accessory (Durridge Co., USA), within 12 hours of sample collection.9-10
Results and Discussion
Table 2 reveals that the varied values, due to different geological conditions,4 of 222Rn ranged between 0.55 ± 0.22 and 3.39 ± 0.28 Bq L-1 with an average value of 2.16 ± 0.37 Bq L-1, well within the EPA’s maximum contaminant level of 11.1 Bq L-1and these values were correlated with EC, pH and temperature. There was a weak positive correlation of radon with EC and a moderate negative correlation of radon was found with pH and temperature (Table 3) means that there is a tendency of high radon scores to go with low pH and temperature scores. In arid regions of Rajasthan where the temperature is high, Mittal et al (2016)33 reported radon concentration from 0.50 to 22 Bq L−1 with the mean value of 4.42 Bq L−1 in groundwater samples. However, EC values ranged between 240 – 550 µS/cm with an average value of 427 µS/cm; pH values ranged between 7.0-7.5 with an average value of 7.2 and temperature values ranged between 19.7 – 21.3oC with an average value of 20.4 oC (Table 1). Akawwi (2014)34 suggested radon concentration increases with temperature and similar results were also found by Garg et al.22 Some researchers have reported poor correlation of radon concentration with pH and TDS35 due to inert nature of radon.
Table 1: Samples detail
|
Sample ID |
Location |
Longitude (E) |
Latitude (N) |
|
SR-1 |
Lakhnauta |
29°43'54.6" |
77°48'10.3" |
|
SR-2 |
Lahboli |
29°44'51.5" |
77°49'15.1" |
|
SR-3 |
Thaska |
29°46'01.1" |
77°50'33.9" |
|
SR-4 |
Dhandera |
29°50'34.1" |
77°53'53.2" |
|
SR-5 |
Mangalore |
29°46'48.2" |
77°51'27" |
|
SR-6 |
Thithiki |
29°48'40.1" |
77°51'01.1" |
|
SR-7 |
Tanshipur |
29°49'49.3" |
77°51'46.2" |
|
SR-8 |
Makanpur |
29°51'48.5" |
77°48'05.2" |
|
SR-9 |
Iqbalpur |
29°52'29.8" |
77°49'47.4" |
 |
|
Table 2: EC, pH, temperature & concentration of radon in groundwater samples
|
Sample ID |
EC (µS/cm) |
pH |
Temp. (oC) |
Radon (BqL-1) |
|
|
SR-1 |
370 |
7.5 |
21.3 |
0.55+0.22 |
|
|
SR-2 |
410 |
7.4 |
20.7 |
1.47+0.32 |
|
|
SR-3 |
550 |
7.1 |
21.0 |
1.85+0.53 |
|
|
SR-4 |
500 |
7.2 |
20.8 |
2.60+0.56 |
|
|
SR-5 |
540 |
7.2 |
20.1 |
3.39+0.28 |
|
|
SR-6 |
240 |
7.0 |
19.8 |
2.95+0.18 |
|
|
SR-7 |
380 |
7.3 |
20.2 |
1.64+0.58 |
|
|
SR-8 |
440 |
7.2 |
19.7 |
2.30+0.53 |
|
|
SR-9 |
410 |
7.3 |
20.1 |
2.67+0.14 |
|
|
Average |
427 |
7.2 |
20.4 |
2.16+0.37 |
|
Table 3: Correlation of concentration of radon v/s EC, pH, temperature (Dancey and Reidy's, 2004)32
|
Measured parameters/ Correlation coefficient |
EC (µS/cm) |
pH |
Temperature (oC) |
|
R2 |
0.16 |
-0.71 |
-0.68 |
Conclusion
The values of natural radioactivity measured in groundwater in southern part of Roorkee area of Uttarakhand, India covered in the present survey is within the permissible limits prescribed by USEPA (1991)36 but a regular monitoring is required. No significant correlation of radon values were found with other parameters viz. EC, pH & temperature and it was found that pH & temperature are moderately negatively correlated and a weak positive correlation was found with EC. However, some of the factors, such as precipitation, geologic and hydrologic variables are important and must be investigated.
Acknowledgment
Authors thank Director, National Institute of Hydrology, Roorkee for support and encouragement.
References
- International Commission on Radiological Protection (ICRP), Protection against 222Rn at home and at work, (Oxford Pergamon Press.), ICRP publication no. 65, 1994.
- United Nations Scientific Committee on the Effects of Atomic Radiations (UNSCEAR), Sources and effects of ionizing radiations, volume 1 (United Nations, New York), 2000.
- International Commission on Radiological Protection (ICRP). ICRP Publication 65: Annals of the ICRP. Vol. 23, No. 2, Pergamon Press, Oxford, 1993.
- Badhan K, Mehra R, Sonkawade RG. Measurement of groundwater using RAD7 and assessment of average annual dose in the environs of NITJ, Punjab, India, Indian Journal of Pure and Applied Physics, 2010, 48: 508-511.
- Cross FT, Harley NH, Hoffman W. Health effects and risks from 222Rn in drinking water. Health Physics, 1985, 48: 686.CrossRef
- Hess CT, Michael J, Horton TR, Prichard HM, Coniglio WA. The occurrence of radioactivity in public drinking water supplies in the United States. Health Physics, 1985, 48: 553.
CrossRef - BEIR VI. Report of the Committee on the Biological effects of ionizing radiation, Health effects of exposure to ardon. Natl. Res. Council. Natl. Acad Press, Washington, DC, 1999.
- Kendal GM, Smith TJ. Doses to organs and tissues from radon and its decay products. Journal of Radiological Protection, 2002, 22: 389.
CrossRef - Krishan Gopal, Rao MS, Kumar CP, Semwal Prabhat. Radon Concentration in Groundwater of East Coast of West Bengal, India. Journal of Radioanalytical and Nuclear Chemistry. 2015, 303:2221-2225.
- Krishan Gopal, Rao MS, Kumar CP. Estimation of Radon concentration in groundwater of coastal area in Baleshwar district of Odisha, India. Indoor and Built Environment. DOI: 10.1177/1420326X14549979, 2014.
CrossRef - Sharma N, Sharma R, Virk HS. Environmental radioactivity: A case study of Punjab, India. Advances in Applied Science Research, 2011, 2(3): 186.
- Rani A, Mehra R, Duggal V. Radon monitoring in groundwater samples from some areas of Northern Rajasthan, India, using a RAD7 detector. Radiation Protection Dosimetry, 2013, 4:496-501.
CrossRef - Kumar A, Kumar A, Singh S. Analysis of radium and radon in the environmental samples and some physico-chemical properties of drinking water samples belonging to some areas of Rajasthan and Delhi, India. Advances in Applied Science Research, 2012, 3(5): 2900-2905.
- Subber ARH, Ali MA, Al-Asadi TM. The Determination of Radon Exhalation Rate from Water using Active and Passive Techniques. Advances in Applied Science Research, 2011, 2(6): 336-346.
- Abdallah SM, Habib SR, Nuwayhid RY, Chatila M, Katul G. Radon measurements in well and spring water in Lebanon. Radiation Measurements, 2007, 42: 298-303.
CrossRef - Cosma C, Moldovan M, Dicu T, Kovacs T. Radon in water from Transylvania (Romania). Radiation Measurements, 2008, 43: 1423-1428.
CrossRef - Krishan Gopal, Rao MS, Kumar CP, Kumar Sudhir, Rao MRA. A study on identification of submarine groundwater discharge in northern east coast of India”, Aquatic Procedia, 2015, 4:3-10.
CrossRef - Virk HS, Singh M, Ramola RC. Radon monitoring for uranium exploration, earthquake prediction and environmental health hazard in Himachal Pradesh, India: an appraisal. In: Proceedings of International Symposium Rare Gas Geochemistry & Applications in Earth and Environmental Sciences. Guru Nanak Dev University, Amristar, 1997, pp. 89-99.
- Cable JE, Burnett WC, Chanton JP, Weatherly GL. Estimating groundwater discharge into northeastern Gulf of Mexico using radon-222. Earth Planet Science Letters, 1996, 144: 591- 604.
CrossRef - Virk HS, Singh M. Uranium and radon anomalies in the river system of N-W Himalayas. Indian Journal of Environment Protection, 1999, 19(10): 750-752.
- Chaubey VM, Bartarya SK, Saini SK, Ramola RC. Radon measurements in groundwater of inter-montane Doonvalley, Outer Himalaya: effects of geohydrology and neotectonic activity. Environmental Geology, 2001, 40 (3), 257-266.
CrossRef - Garg PK, Krishan Gopal, Kumar Sudhir. Radon concentration in groundwater of Haridwar, Uttarakhand, India. International Journal of Earth Science and Engineering, 2015, 8(2): 1-4.
- Krishan Gopal, Rao MS, Kumar CP, Kumar Bhishm. Isotopic Observations from two stations of North India to investigate geographical effects on seasonal air moisture. Journal of Earth Science and Climate Change, 2014, 5, 2. http://dx.doi.org/10.4172/2157-7617.1000180
CrossRef - Chopra RPS, Krishan Gopal. Analysis of aquifer characteristics and groundwater quality in southwest Punjab, India. Journal of Earth Science and Engineering, 2014, 4(10): 597-604.
- Chopra RPS, Krishan Gopal. Assessment of groundwater quality in Punjab. Journal of Earth Science and Climate Change, 2014, 5(10): 243.
- Krishan Gopal, Chopra, RPS. Assessment of water logging in south western (SW) parts of Punjab, India-a case study from Muktsar district. NDC-WWC Journal, 2015, 4(1): 7-10.
- Krishan Gopal, Lapworth DJ, Rao MS, Kumar CP, Smilovic M, Semwal P. Natural (Baseline) Groundwater Quality In The Bist-Doab Catchment, Punjab, India: A Pilot Study Comparing Shallow and Deep Aquifers. International Journal of Earth Sciences and Engineering, 2014, 7 (01): 16-26.
- Krishan Gopal, Rao MS, Loyal RS, Lohani AK, Tuli NK, Takshi KS, Kumar CP, Semwal P, Kumar Sandeep. Groundwater level analyses of Punjab, India: A quantitative approach. Octa Journal of Environmental Research, 2014, 2(3): 221-226.
- Krishan Gopal, Rao MS, Kumar CP, Garg Pankaj, Semwal Prabhat. Assessment of salinity and groundwater quality with special emphasis to fluoride in a semi-arid region of India. Journal of Earth Science and Climate Change, 2014, 5(6): 149.
- Krishan Gopal, Rao MS, Lohani AK, Kumar CP, Takshi KS, Tuli NK, Loyal RS, Gill GS. Assessment of groundwater level in southwest Punjab, India. Hydraulics, Water resources, Coastal & Environmental Engineering-Hydro 2014 (Editors: H.L. Tiwari, S. Suresh, R.K. Jaiswal) Excellent Publishing House, New Delhi, 2014, 23: 248-254.
- Lapworth Dan, Krishan Gopal, Rao MS, MacDonald Alan. Intensive Groundwater Exploitation in the Punjab – an Evaluation of Resource and Quality Trends. . Technical Report. NERC Open Research Archive, BGS-UK, 2014.
- Dancy C, Reidy J. Statistics without maths for Psychology: using SPSS for windows, London, Prentice Hall, 2004.
- Mittal Sudhir, Rani Asha, Mehra Rohit, 2016. Estimation of radon concentration in soil and groundwater samples of Northern Rajasthan, India. Journal of Radiation Research and Applied Sciences. 9: 125-130.
CrossRef - Akawwi E. Radon-222 concentration along Eastern Jordan rift. Journal of Applied Sciences, 2014, 14(4): 309-316.
CrossRef - Karthik Kumar MB, Nagaiah N, Mathews Gladys, Ambika MR, 2017. Study on radon concentration in groundwater of Sira and Tiptur taluk of Tumkur district, Karnataka, India. 40: 13-17.
- USEPA, National Preliminary Drinking Water Regulations for Radionuclides, Washington, DC, US, Governmental printing office, EPA/570/9-91/700,1991.


