Seasonal Variation of Leaf Dust Accumulation and Biochemical Parameters of Selected Plant Species Alongside the National Highway-7 in Sirmaur, H.P, India
Jyotsana Pandit1 * , Anil Sood2 , Satish Kumar Bhardwaj3 and Anish Kumar Sharma4
http://dx.doi.org/10.12944/CWE.12.2.26
The present study was carried out to assess the dust interception efficiency and impact of dust deposition on biochemical parameters of plant species growing alongside National Highway (NH-7) at Sirmaur, H.P, India. Plants are universal sink of CO2. The plant species selected for the study were Ficus roxburghii, Mallotus philippensis, Shorea robusta, Woodfordia fruticosa. The observed trend of dust accumulation was in the order Ficus roxburghii (38.30 mg m-2) > Shorea robusta (26.94 mg m-2),> Mallotus philippensis (22.31 mg m-2) > Woodfordia fruticosa (16.70 mg m-2). The present study revealed, that the leaf dust accumulation decreased with increasing distance from the national highway. Leaf dust accumulation was influenced by the seasons of the year with the maximum (30.70) in pre-monsoon and the minimum(21.42) in post-monsoon season.
Copy the following to cite this article:
Pandit J, Sood A, Bhardwaj S. K, Sharma A. K. Seasonal Variation of Leaf Dust Accumulation and Biochemical Parameters of Selected Plant Species Alongside the National Highway-7 in Sirmaur, H.P, India. Curr World Environ 2017;12(2). DOI:http://dx.doi.org/10.12944/CWE.12.2.26
Copy the following to cite this URL:
Pandit J, Sood A, Bhardwaj S. K, Sharma A. K. Seasonal Variation of Leaf Dust Accumulation and Biochemical Parameters of Selected Plant Species Alongside the National Highway-7 in Sirmaur, H.P, India. Curr World Environ 2017;12(2). Available from: http://www.cwejournal.org?p=1012/
Download article (pdf) Citation Manager Publish History
Introduction
Atmospheric particulate matter represents a complex mixture of organic and inorganic substances of varying size and may enter an organism or plant in a number of ways. Roadside vegetation communities are greatly affected by the dust from highways and roads due to changes induced in biochemical parameters (ascorbic acid content, pH, Relative Water Content, total chlorophyll content).Particulate pollutants can cause many lethal effects on plants like stomatal clogging, reduced photosynthetic activity, leaf fall and death of tissues (Shrivastava and Joshi, 2002).1 Plants play very important role in improving the ambient air quality. Morphology and internal structure of leaves is altered by heavy load of dust pollutants (Sukumaran, 2012).2 Foliar surface of plants is the main receptor of dust as it is continuously exposed to the surrounding atmosphere (Rai and Panda, 2014).5 The ability of each plant species to absorb and adsorb pollutants by their foliar surface varies greatly and depends on several biochemical, physiological and morphological characteristics (Seyyednejad et al., 2011).4 The capacity of leaves as dust receptors depends upon their surface geometry, phyllotaxy, epidermal and cuticular features, leaf pubescence, and height and canopy of trees (Nowak, 19945; Singh, 20006; Singh et al., 20027). Smaller plants with short petioles and rough surface accumulate more dust than larger plants with long petioles and smoother leaf surface (Thakar and Mishra, 2010)8. Vegetation provides a natural means of cleaning the atmosphere with large leaf area for impingement, absorption and accumulation of air pollutants level in the environment (Das and Prasad, 2010).9 Reduction has been measured in photosynthetic pigments due to deposition of particulate matters on the upper surface of the leaves (Karmakar et al. 2016).11 It is well evident from the previous studies that the contents of chlorophyll, ascorbic acid, protein and carbohydrate are affected due to the air pollution (Hoque et al., 200711 ; Flowers et al., 200712). Various biochemical studies of foliar tissues has reported decrease in chlorophyll content and the increase in ascorbic acid content as a result of air pollution.
(Joshi et al., 199713; Gavali et al., 200214). Plants show visible changes depending on their sensitivity level which would include alteration in the biochemical processes or accumulation of certain metabolites (Agbaire and Esiefarienrhe, 2009).15 The climate condition, the physico chemical properties of air pollutants have impact on surrounding plants (Wagh et al., 2006).16 Roadside plant leaves are in direct contact with air pollutants, and may act as stressors for pollutants, hence need to be examined for their biomonitoring potential (Sharma et al., 2007)17. Biomonitoring of plants is an important tool to evaluate the impact of air pollution (Rai, 2011a18; Rai, 2011b19). Keeping in view the above parameters the present study was undertaken to assess the variation in leaf dust accumulation with respect to species and seasons and observe seasonal variation in biochemical parameters of plant species growing alongside the National Highway-7.
Material and Methods
Study area
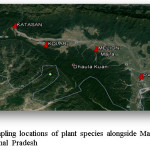
Sirmaur district lies among the outer Himalayan ranges between 77o 01’12” and 77o 49’40” East longitude and 30o 22’30” North latitude. The location of the study site is presented in Fig. 1. The 40 km stretch of Markanda to Paonta Sahib National Highway (NH-7) in Sirmaur District of Himachal Pradesh was selected as the study area in the present investigations. The study area is facing a severe problem of air pollution due to large vehicular density and expansion of highway as well as increased demographic pressure.
 |
|
Climate
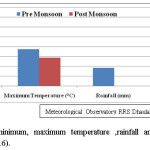
During the study period (2015-2016) in the selected stretch of National Highway (Markanda to Paonta Sahib) no rainfall was experienced during the months of October-November (post monsoon season). Whereas, a rainfall of 18.7 mm was recorded during April-May (pre monsoon season). Maximum temperature varied from 28.95 to 37.45 oC and minimum temperature varied from 8.8 to 18.5oC. Relative Humidity varied from 53.4 to 67.34% (Fig. 2).
 |
|
Sampling of Dust and Leaves
The study was conducted during two seasons i.e. post-monsoon (October- November, 2015) and pre-monsoon (April-May, 2016), respectively. The 40 km stretch of the National highway from Markanda to Paonta Sahib was divided into four equal parts of ten kilometres each (four study locations). In order to study the impact of vehicular emissions on the plants, plants were selected from 0-10 m and 10-20 m horizontal distances from both sides of the road. The commonly occurring plant species namely Ficus roxburghii, Mallotus philippensis, Woodfordia fruticosa and Shorea robusta were selected for the study. The morphological characteristics of the selected plant species are given in Table 1. Fully mature leaves of the selected plant species were taken for the present studies. The upper surface of the leaves was cleaned with fine brush and identification mark was put on them. These leaves were kept for 24 hours for dust accumulation and were collected in the pre weighed butter paper bags with the help of fine brush. After taking the data for dust accumulation, the leaves were cut from petiole, kept in ice box and brought to the laboratory for further analysis. The individual leaf (in m2) was measured with Leaf area meter (Model-LI-COR-3100). The samples were weighed using top pan electronic balance and the amount of dust was calculated using the equation W= (w2 - w1) / a, Where w is dust content (mg m-2), w1 is initial weight of butter paper bag,w2 is final weight of butter paper bag with dust and a is total area of the leaf (m2). In order to study the correlation of weather parameters of different seasons and its relationship with dust accumulation and pollution on the leaves of selected plant species the weather data was procured from (Fig.2).
Table 1: General description of selected plants species
|
Plant species |
Common name |
Family |
Habit |
Leaf shape |
Leaf Texture |
Pubescence |
|
Ficus roxburghii |
Trimmal |
Moraceae |
Tree |
Cordate- ovate |
Coriaceous |
Present |
|
Mallotus philippensis |
Kamala Dye Tree |
Euphorbiaceae |
Tree |
Ovate-lanceolate |
Smooth |
Absent |
|
Shorea robusta |
Sal |
Dipterocarpaceae |
Tree |
Ovate-oblong |
Coriaceous |
Present |
|
Woodfordia fruticosa |
Dhai |
Lythraceae |
Shrub |
Ovate |
Smooth |
Absent |
Biochemical analysis
Ascorbic acid content was estimated by using A.O.A.C (1980)20 method. Total chlorophyll content (Hiscox and Israeistam, 1979)21 and relative water content (Liu and Ding, 2008)22 was also determined. 5 g leaves was homogeneized using distilled water and pH of the filtrate was detected using digital pH meter.
Results and Discussion
Leaf dust accumulation
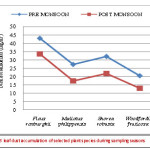
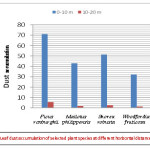
The seasonal variation in leaf dust accumulation of different plants under study is presented in Fig. 3. The maximum dust was accumulated in Ficus roxbughii (38.30 mg m-2) which was significantly different from all other values (Table 2). Whereas, minimum dust was noticed in Woodfordia fruticosa (16.70 mg m-2) which was at par with Mallotus philippensis (16.70). It was observed that all plants showed higher dust deposition in pre monsoon season due to construction or road making activities at the study locations (Joshi et al., 2014).23 Further this may be attributed to higher temperature conditions in the study area as compared to post monsoon months (Fig 2). Ficus roxburghii exhibited highest leaf dust accumulation followed by Shorea robusta , Mallotus phiippensis, Woodfordia fruticosa (Table 2).Highest dust accumulation on the leaves of Ficus roxburghii may be attributed to its broad and coriaceous leaf texture which might have accumulated more dust on leaves and prevented dust fall from leaf surface (Madan and Chauhan, 2015).24 Lowest amount of dust observed on Woodfordia fruticosa may be attributed to its smaller leaf size and smooth surface due to which dust settled on the leaf surface may slip down due to gravitational force or even by wind. These results are similar to those of Joshi and Bora (2011)25 who reported that dust deposition capacity of plants depends on their surface geometry and leaf external characteristics.The highest dust load of 49.35 mg m-2 was noticed on leaves of plant species growing at the distance of 0-10 m from the National Highway (Table 2, Fig 4) due to high dust intensity which results by the vehicles activity and capturing dust with a gentle wind (Younis et al., 2013 a).26 High dust deposition on leaf surface at road side with heavy vehicular traffic may be due to spray of unburnt oil residue of diesel or petrol on the leaf surface (Rahul and Jain, 2014).27 These results are also in conformity with the findings of Younis et al. (2013 b)28 who reported that dust accumulation is more in plants growing at roadsides due to high dust intensity which results by the vehicles activity and capturing dust with a gentle wind.
 |
|
 |
|
Table 2: Dust accumulation (mg m-2) of the selected plant species growing alongside the Markanda to Paonta Sahib National Highway (NH-7) during sampling seasons
|
Plant species |
Horizontal distance |
Season |
|||
|
0-10 m |
10-20 m |
Mean |
Pre monsoon |
Post monsoon |
|
|
Ficus roxburghii |
71.06 |
5.54 |
38.30 |
43.03 |
33.57 |
|
Mallotus philippensis |
42.90 |
1.71 |
22.31 |
27.26 |
17.35 |
|
Shorea robusta |
51.33 |
2.56 |
26.94 |
32.09 |
21.80 |
|
Woodfordia fruticosa |
32.11 |
1.28 |
16.70 |
20.44 |
12.95 |
|
Mean (distance) |
49.35 |
2.77 |
Mean (season) |
30.70 |
21.42 |
|
Pre monsoon |
58.33 |
3.08 |
30.70 |
||
|
Post monsoon |
40.37 |
2.46 |
21.42 |
||
Ascorbic acid content
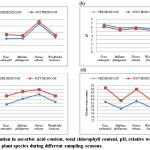
The present study reported higher ascorbic acid content during post monsoon season in all the plant species Fig. 5a. Pollution load dependent increase in ascorbic acid content of plant species may be due to more production of antioxidants (ascorbic acid) under stress conditions prevailing in the study area (road construction activities) during the post monsoon season.These results are similar to those of Bhattacharya et al., (2013)29 who reported that ascorbic acid was higher in winter as the pollution load increases in this season due to meteorological conditions. The results are also in line with the findings of Garg and Kapoor (1972)30 who reported that dust accumulation caused alkalinity in leaves by chemical dissolution of dust particles in cell sap which results in chlorophyll damaged and in order to accommodate these stresses leaves ascorbic acid content increased.
Total Chlorophyll content
The leaf chlorophyll content of the selected plant species varied from 1.17 mg g-1 (Ficus roxburghii) to 1.64 mg g-1 in Shorea robusta (Table 5a). The result exhibited lowest leaf chlorophyll content in all plants during pre monsoon season (Fig 5b) due to maximum dust accumulation. Dust particles carry many polycyclic hydrocarbon and metals with them which inhibits the production of enzymes required for chlorophyll synthesis and results in reduction of chlorophyll content (Prajapati and Tripathi, 2008).31
Leaf extract pH
In the present study maximum pH during during pre monsoon season was associated with the higher leaf dust accumulation during pre monsoon months. Dust accumulation caused alkalinity in leaves by dissolution of chemicals present in dust particles i.e., metals and polycyclic hydrocarbons in the cell sap thus increasing the pH (Katiyar and Dubey (2001).32
Relative water content
All the plants showed higher relative water content during post monsoon (Fig 5d) season due to high relative humidity (Fig 2) in the atmosphere during post monsoon season which might have increased relative water content due to less transpiration, whereas lowest was observed during pre monsoon season. The lower relative water content during pre monsoon season may be attributed to more dust accumulation during pre monsoon season (Table 2). Dust may absorb water through non cutinized plant surface such as leaves, stems and branches, contributing to decreased relative water content (Rai and Panda, 2014).3
 |
|
Acknowledgement
The authors acknowledge the Head, Department of Environmental Sciences, Dr. Y.S Parmar UHF, Nauni, Solan for providing necessary laboratory facilities.The authors are also thankful to the staff of the Department for providing necessary help in some of the analyses. We sincerely express our gratitude to Dean College of forestry for providing financial support to conduct the study.
References
- Shrivastava N and Joshi S. 2002. Effect of automobile air pollution on the growth of some plants at Kota. Geobios 29: 281–282.
- Sukumaran D. 2012. Effect of particulate pollution on various tissue systems of tropical plants. Central Pollution Control Board, Kolkata, India.
- Rai P K and Panda L L S. 2014. Leaf dust deposition and its impact on biochemical aspect of some roadside plants of Aizawl, Mizoram. International Research Journal of Environment Science 3(11): 14-19.
- Seyyednejad S M and Koochak H. 2011. A Study on Air Pollution effects on Eucalyptus camaldulensis. International Conference on Environmental, Biomedical and Biotechnology 16: 98-101.
- Nowak, D.J., 1994. Air pollution removal by Chicago’s urban forest. In: McPherson, E.G., Nowak, D.J., Rowntree, R.A. (Eds.), Chicago’s Urban Forest Ecosystem: Results of the Chicago Urban Forest Climate Project, USDA Forest Service General Technical Report NE-186, pp. 63–81.
- Singh, R.B., 2000. Indian J. Environ. Ecoplan. 3, 163–166.
- Singh, R.B., Das, U.C., Prasad, B.B., Jha, S.K., 2002. Poll. Res. 21:13–16.
- Thakar B K and Mishra P C. 2010. Dust collection potential and air pollution tolerance index of tree vegetation around Vedanta Aluminium limited, Jharsuguda. The Bioscan 3: 603-612.
- Das S and Prasad P. 2010. Seasonal variation in air pollution tolerance indices and selection of plant species for industrial areas of Rourkela. Indian Journal of Environmental Protection 30(12): 978-988.
- Karmakar D, Malik N and Padh P K. 2016. Effects of industrial air pollution on biochemical parameters of Shorea robusta and Acacia auriculiformis. Research Journal of Recent Sciences 5(4): 29-33.
- Hoque M A, Banu M N A and Oluma E. 2007. Exogenous proline and glycinebetaine increase NaCl induced Ascorbate-glythione cycle enzyme activities and praline improves salt tolerance more than glycinebetaine in tobacco bright yellow-2 suspension. Journal of plant physiology 164(11): 1457-1468.
CrossRef - Flowers M D, Fiscus E L and Burkey K O. 2007. Photosynthesis,chlorophyll flourescene and yield of snap bean (Phaseolus Vulgaris L) genotypes differing in sensitivity to Ozone. Environmental and Experimental Botany 61(2): 190-198.
CrossRef - Joshi O P, Wagela D K and Pawar K. 1997. Urban air pollution effects on two species of cassia. Pollution Research 16: 1-3.
- Gavali J.G., Saha D. and Krishnayya K. (2002). Difference in sulphur accumulation in eleven tropical tree species growing in polluted Environments. Indian journal of Environmental Health 44: 88-91.
- Agbaire P O and Esiefarienrhe E. 2009. Air pollution tolerance indices of some plants around Otorogun gas plant in Delta State, Nigeria. Journal of Applied Sciences and Environmental Management 13(1): 11-14.
- Wagh N D., et al. 2006. Biological monitoring of roadside plants exposed to vehicular pollution in Jalgaon city. Journal of Environmental biology 27(2): 419-421.
- Sharma A P, Rai P K and Tripathi B D. 2007. Magnetic biomonitoring of roadside tree leaves as a proxy of vehicular pollution. In: urban planning and environment: strategies and challenges (Lakshmi Vyas. eds). Mc Millan advanced research series. pp. 326-331
- Rai P K. 2011a. Dust deposition capacity of certain roadside plants in Aizawl, Mizoram: implications for environmental geomagnetic studies. In: Recent Advances in Civil Engineering (S. B. Dwivedi .ed). pp. 66-73
- Rai P K. 2011b. Biomonitoring of particulates through magnetic properties of road-side plant leaves. In: Advances in Environmental Chemistry (Tiwari D, ed). Excel India Publishers, New Delhi. pp. 34- 37
- A.O.A.C. 1980. Official methods of analysis of the analytical chemist, 13th ed. (W. Horwitz, ed.). Association of Analytical Chemists 83: 617-623.
- Hiscox J D, Israeistam G F. 1979. A method for the extraction of chlorophyll from leaf tissue without maceration. Canadian Journal of Botany 57: 1332-1334.
CrossRef - Liu Y J and Ding H. 2008. Variation in air pollution tolerance index of plants near a steel factory: implications for landscape plants species selection for industrial areas. WSEAS Transactions on Environment and Development 1(4): 24-32.
- Joshi N, Bist B, Mule P and Joshi A. 2014. Importance of common roadside plants as dust collectors in Tarapur Industrial area. International Research Journal of Science and Engineering 2 (2): 31-36
- Madan S and Chauhan S. 2015. Air pollution tolerance index and anticipated performance index of selected plant species in Haridwar City, India. Report and Opinion 7(6): 32-37.
- Joshi N and Bora M. 2011. Impact of air quality on physiological attributes of certain plants. Report and Opinion 3(2): 42-47.
- Younis U, Bokhari T Z, Shah M H R, Mahmood S and Malik S A. 2013a. Dust interception capacity and alteration of various biometric and biochemical attributes in cultivated population of Ficus carica L. Journal of Pharmacy and Biological Sciences 6(4): 35-42.
CrossRef - Rahul J and Jain M K. 2014. An investigation into the impact of particulate matter on vegetation along the national highway: a review. Research journal of environmental sciences 8(7): 356-372.
CrossRef - Younis U, Bokhari T Z, Shah M H R, Mahmood S and Malik S A. 2013b. Variations in leaf dust accumulation, foliage and pigment attributes in fruiting plant species exposed to particulate pollution from Multan. International Journal of Agricultural Science and Research 3(3): 1-12.
- Bhattacharya T, Kriplani L and Chakraborty S. 2013. Seasonal variation in air tolerance index of various plant species of Baroda City. Universal Journal of Environmental Research and Technology 3(2): 199-208.
- Garg O P and Kapoor V. 1972. Retardation on leaf senescence by ascorbic acid. Journal of Experimental Botany 23: 699-703.
CrossRef - Prajapati S K and Tripathi B D. 2008. Seasonal variation of leaf dust accumulation and pigment content in plant species exposed to urban particulates pollution. Journal of Environmental Quality 36: 865-870.
CrossRef - Katiyar V, and Dubey P S. 2001. Sulphur dioxide sensitivity on two stage of leaf development in a few tropical tree species. Indian Journal of Environmental Toxicology 11: 78-81.


