Comparative Study of Heat Indices in India Based on Observed and Model Simulated Data
Sushil Kumar Dash 1 * , Sagnik Dey 1 , Popat Salunke 1 , Mamta Dalal 1 , Vaishali Saraswat 1 , Sourangsu Chowdhury 1 and Rohit Kumar Chowdhury 1
http://dx.doi.org/10.12944/CWE.12.3.06
It has been reported that the occurrence of "Heat wave" conditions is increasing in different parts of the world. This increase in heat extremes is expected to lead to increasing levels of discomfort to the human beings. In addition, there are loss of working hours, adverse health impacts and deaths depending on the severity and duration of the heat extremes. It is well known that meteorologically it is not merely the rise in temperature which causes human discomfort. Temperature coupled with high humidity, low wind and impervious clothing form major causes of discomfort. Above all, the type of physical activities being undertaken in these adverse conditions is one of the important factors to decide the stress and strain encountered by a person. Studies on biometeorology have been carried out by several scientists for over a century and a number of heat indices have been developed which quantify the level of discomfort or heat stress in their working environments. Today, observed meteorological parameters as well as corresponding model outputs are freely available from several sources which can be used for estimating the values of heat indices at any location. Both dynamical and statistical downscaling methods are very useful in this regard. In this study, some of the commonly used heat indices have been calculated for the four major cities of Delhi, Mumbai, Chennai and Kolkata using daily observed parameters from the India Meteorological Department (IMD) for the period 1975 to 2005. Same indices are also calculated based on the simulated values from the Regional Climate Model (RegCM) of the Abdus Salam International Centre for Theoretical Physics (ICTP) over the same period. The RegCM simulated fields have been obtained from the COordinated Regional Downscaling EXperiments (CORDEX) over the South Asia domain. Comparison of characteristics of the four selected indices based on IMD observed data and RegCM simulations leads to the inference that there are several similarities between the two sets of data in terms of their annual cycles and inter-annual variations. This exercise conclusively shows the advantages of dynamical downscaling. Further, results of this study encourage for a comprehensive work in the future for the country wide mapping and projection of heat indices based on model simulations, development of suitable heat indices and classification of comfort classes for their use in warning system for human health related issues in India.
Copy the following to cite this article:
Dash S. K, Dey S, Salunke P, Dalal M, Saraswat V, Chowdhury S, Choudhary R. K. Comparative Study of Heat Indices in India Based on Observed and model Simulated Data. Curr World Environ 2017;12(3). DOI:http://dx.doi.org/10.12944/CWE.12.3.06
Copy the following to cite this URL:
Dash S. K, Dey S, Salunke P, Dalal M, Saraswat V, Chowdhury S, Choudhary R. K. Comparative Study of Heat Indices in India Based on Observed and model Simulated Data. Curr World Environ 2017;12(3). Available from: http://www.cwejournal.org?p=1062/
Download article (pdf)
Citation Manager
Publish History
Introduction
Extreme weather events (e.g. the frequency of occurrence of intense rainfall, warm and cold events) are on the rise along with the rise of global average temperature1. Temperature and rainfall extremes in India have been examined by several authors2,3,4. Such extreme weather events have adverse impacts5,6,7 on agriculture, human health, generation of power, water availability and several other aspects concerning the society. Environmental heat stress is one of the direct effects to human health which is caused due to local changes in the atmosphere and the "urban heat island" effect. Usually, human body maintains its core temperature8 at around 37ËšC while skin temperature is maintained at a little lower temperature of around 32ËšC. When there are changes in the surrounding weather condition leading to warmer temperature, our body tries to gain equilibrium with it. This happens through physical processes of radiation to the body, of convection via blood flow, of conduction through cooler objects and also through evaporation of sweat. We do not feel comfortable when our body is unable to maintain the required temperature. Higher outside temperatures alert the thermoregulatory mechanisms9 of our body and when this mechanism starts failing, one faces marked discomfort. Depending on the severity of the incident, there may be heat cramp, exhaustion and finally heat stroke. Similar situation is also experienced by a person doing very hard work even under normal temperatures. Even when the temperature is not so high, more humidity, impervious clothing and no wind may restrict evaporation of sweat10 and hence can create extreme discomfort.
The interaction of the human body with the surrounding air is an environmentally complex process and it varies from person to person depending on his activity, metabolic rate and the clothing. Hence, it is difficult to get deterministic values for heat stress without involving approximations. Heat indices9 can be categorized as direct, empirical and energy balance indices. Direct indices are estimated based on important meteorological parameters such as air temperature, wind velocity, humidity and heat radiation. Empirical indices use heart rate and rectal temperature. Energy balance indices, model human interactions11 with the environment and are more difficult to estimate. It may be noted that the study of heat strain indices is more involved with a lot of physiological interpretations.
Today, health warning systems are widely used in several countries. The heat wave in Europe 2003 triggered the development of health warning systems12 in cities which did not have any. A number of cities in France and Greece use indices with one or two meteorological parameters. In USA, the method of Spatial Synoptic Classification (SSC) is also prevalent where discomfort is attributed to a range of meteorological conditions. India is yet to develop its plan for heat related warnings at a national level. Being a vast country, India comes under four climatic13 groups which can be further subdivided into six climate zones. At any time of the year, the variation of climate across the length and breadth of the country is wide. Some cities face extreme temperature conditions and others are very humid without much wind. In addition to extreme meteorological conditions, the polluted air in the cities adds to human discomfort which is increasing day by day. Therefore, it is very important to map India with respect to different heat indices and examine whether it is viable to identify any particular heat index for its use in estimating human discomfort and subsequent early warnings.
 |
|
 |
|
 |
|
The inter-annual variations of heat indices over four cities in India have been examined14. These indices are mixed in nature so far as heat stress and strain are concerned. Based on the preliminary results obtained in their work, in this study we have re-examined the characteristics of some of the used heat stress indices such as Heat Index (HI), Humidex, Wet Bulb Globe Temperature (WBGT) and Universal Thermal Climate Index (UTCI) at the same four cities in India. Considering the importance of heat stress studies in India, the present study is focused on the heat stress indices alone. Earlier, the work place heat stress in Delhi, India had been estimated15.
Daily mean surface temperature, relative humidity and wind speeds from four selected cities in India such as Delhi, Mumbai, Chennai and Kolkata during the period 1975 to 2005 are utilised here to calculate the values of the four heat indices at the respective cities. These meteorological fields are obtained from IMD. Similarly, RegCM simulated daily fields are also utilised. Monthly mean values of the three climatic parameters and the four heat indices are calculated and analysed here with a view to compare the RegCM downscaled products with the corresponding observed values.
Section 2 briefly introduces the four important heat indices which are used in different countries along with their mathematical expressions. Section 3 gives salient features of RegCM4.3 and details of the numerical experiments conducted in this study. Important results such as the annual cycles of relevant meteorological parameters (such as surface temperature, relative humidity and wind) and the annual cycles and inter-annual variations of the four heat indices are discussed in Section 4. Important discussions are given at the end in Section5.
 |
|
 |
|
 |
|
Heat Indices
As mentioned earlier, in this study, we discuss the four widely used heat indices HI, Humidex, WBGT and UTCI for four selected metropolitan cities of India under full shade conditions (no heat/direct radiation from the sun). These indices are directly calculated by using the daily values of air temperature, relative humidity and wind strength obtained from observations recorded by IMD and also from simulations made by using RegCM. No attempt has been made to calculate more complicated heat indices which involve complex interaction between humans and the environment. The four indices are briefly stated below.
Heat Index (HI)
The Heat Index (HI) was first proposed by Rothfusz16. It uses the concept of how a person would feel when kept in a room (indoor) with ambient (outdoor) conditions, and the temperature is made to vary. It is often used in the USA to describe heat stress, and it does not include any links to work or sports activities. HI is calculated using regression expressions with various factors which influence human biometeorology like vapor pressure and effective radiation all expressed in one equation in terms of temperature and relative humidity. Absolute humidity with a dew point of 14°C is chosen as a reference for ambient conditions. The following formula is used to calculate HI:

Here Ta is air temperature in °C and RH is relative humidity rounded up to its integer value in %.
Humidex
Humidex is used in Canada for general public heat stress assessments. The current formula for determining the Humidex was developed by Masterson and Richardson17. It combines temperature and water vapour pressure into one parameter to reflect the perceived temperature. Humidex uses a dew point of 7°C as a base. The formula used to calculate the Humidex is,
H = Tα+ 0.5555 x (e- 10)
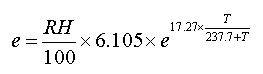
Here H is Humidex index, Ta is air temperature in °C and e is the water vapor pressure in milli bar (mb), which is calculated from the temperature and RH using the relation:
Wet Bulb Global Temperature (WBGT)
The most commonly method to assess the work place heat stress is WBGT. It is also used to advise sports organizations on the suitability of holding events or practice sessions during hot days. The WBGT was developed by Yaglou and Minard18 to control outbreak of heat illness in training camps of the US Army and Marine Corps. Originally, WBGT was an approximation of the corrected effective temperature. The US National Institute for Occupational Safety and Health (NIOSH) in 1972 accepted WBGT as the heat stress index for industrial use19. The international ISO standard 7243 was set based on WBGT20. It was recommended by the American Conference of Governmental and Industrial Hygienists for industrial use21. Being an acclaimed index accepted for a long time, WBGT has been used widely for accessing occupational health risks, physiological impacts on work capacity and discomfort at different levels of metabolic rate8. ACGIH recommends a threshold limit value (TLV) for exposure, alert and ceiling limits. These at given metabolic rates define what should be the proportion of working hours21 and rest time and they have been considered22 in the context of climate change. For heat radiation measurements (e.g. outdoors in the sun) WBGT introduced the globe temperature Tg which measures effect of radiation and wind speed on man. It uses an instrument consisting of a black globe fitted with an internal temperature sensor. The Tg sensor considers the human body to be like the black globe which absorbs all the radiation.
Over the time, WBGT has been calculated through a number of formulae. Various ways in which WBGT has been calculated using meteorological data have been compared in earlier study23. The formula of Liljegren24 is the most suited one for calculating outdoor WBGT in the sun. For this study, we have used a macro developed by Lemke for indoor or in-shade estimates, which is based on WBGT calculation of Bernard and Pourmoghani25. WBGT is expressed as,
WBGT = 0.7 X TNWB + 0.2 X Tg + 0.1 x Tα
Here, Ta is the air temperature in °C. Tg is assumed to be equal to Ta in the absence of solar radiation. The calculation of the natural wet bulb temperature (Tnwb) is very complicated as it depends on the mean radiant temperature, the view and emissivity factors of the bulb, saturated vapour pressure,wind speed over the bulb etc. It is calculated by iterations using macro developed by Lemke and Kjellstrom23. We have calculated WBGT under outdoor shaded conditions where the actual values of winds are used.
Universal Thermal Climate Index (UTCI)
UTCI was developed in a European program COoperation in Science and Technological Research (COST) Action 730 working group that aimed at producing guidance for the general public on heat stress and cold stress within the same index (http://www.utci.org). UTCI was developed following the concept of an equivalent temperature. It is based on energy balance equation. The notion is that the index number (expressed as °C) is how the air "feels" when someone is walking at 4 km/hour. The UTCI is calculated using electronic methods available on UTCI website (http://www.utci.org). The UTCI macro was converted into Visual Basic for Applications (VBA) from the FORTRAN source code supplied at the UTCI website: www.utci.org/utci_doku.php. The formula26 to convert the dew point and the relative humidity to vapour pressure has been used in this study. We note that the results represent heat stress for indoor condition or in full shade outdoor condition. The advantage of UTCI is that it is based on the latest knowledge available in the field of physical, bio-meteorological and physiological sciences integrated together. However, the actual formulae are quite elaborate with a large number of factors. UTCI- Fiala model has been validated in almost all terrains with extremes27 of temperature and humidity. Further, it was not validated at high humidity and high temperatures, the conditions which are usually experienced in India. Fixed values of clothing and work done are used in UTCI and these are not applicable to working people in India.
RegCM simulations
The Regional Climate Model version 4 (RegCM4) developed28 at the Abdus Salam International Centre for Theoretical Physics (ICTP) has been used in this study. In brief, RegCM4 is a hydrostatic model that runs on Arakawa B-grid and employs an explicit time splitting scheme. The model includes multiple physics options, and for the experiment presented here it uses sigma-p coordinates with 18 levels in the vertical. For the calculation of radiative transfer, it uses the NCAR CCM3 radiation package. Land surface processes are simulated via the Biosphere-Atmosphere Transfer Scheme (BATS)29, while boundary layer processes are parameterized using the non-local formulation30. For convection, the Emanuel scheme31 and Grell schemes32 are used over land and ocean respectively. Large-scale precipitation is represented by the sub-grid explicit moisture scheme SUBEX33. The surface elevation and land cover data are obtained from the United States Geological Survey Global Land Cover Characterization (GLCC).
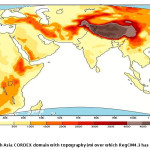
It may be noted here that COordinated Regional Downscaling EXperiments (CORDEX) (CORDEX) is an international program initiated by the World Climate Research Program (WCRP) for generating (https://www. cordex.org/domains) regional-scale climate projections which are supposed to be used for impact assessment and adaptation studies worldwide. An important component of CORDEX is the evaluation of multiple regional models and their use to provide dynamically downscaled climate products based on a number of General Circulation Models (GCMs) and emissions scenarios from the Coupled Model Intercomparison Project Phase 5 (CMIP5) archive. Multiple regional domains covering most of the land areas in the world have been identified for CORDEX programme. CORDEX - South Asia consisting of India is one such domain over which multiple regional climate models are integrated. In one of such coordinated experimental programme, RegCM has been integrated from 1st January 1970 till 31st December 2005 (termed as historical run) at 50 km horizontal resolution over the South Asia domain, which covers a broad South Asia region and adjacent ocean areas 10o E to 130o E and 22o S to 49o N (Figure1).
A CMIP5 GFDL-ESM2M simulation (from IPCC AR5) is used to produce the initial and lateral boundary conditions. The RegCM4 configuration and driving Global Circulation Model (GCM) were selected based on extensive set of preliminary experiments which provided a realistic representation of the South Asia climate in present day conditions34. The detailed analysis of the model performance in simulating mean climate and extremes over different CORDEX domains conducted for the CREMA Phase I experiment has been discussed in earlier publications34,35. The Indian summer monsoon circulation and associated rainfall have been successfully validated36 against the rainfall values observed and prepared by IMD at 0.5×0.5 grids (IMD0.5) and NCEP/NCAR reanalyses. The model simulated surface temperature, relative humidity and surface wind from 1975 to 2005 (31yrs) are used in this paper.
 |
|
 |
|
 |
|
Results
The interannual variations are represented in terms of box and whisker plots using percentiles, since these are the most suitable ways to indicate the distributions of the three climatic parameters and the resulting four heat indices at the four selected cities. Each box plot is a non-parametric statistical summary of 31 years of rainfall. Each plot shows the median (the line in the box), the lower and upper quartiles (the lower and upper edges of the box) and the spread represented by minimum and maximum values (the ends of the whiskers), excluding outliers and extremes. In the box plots, the bottom and top of each box indicate the 25th and 75th percentile (the lower and upper quartiles) respectively, and the band near the middle of a box is always the 50th percentile (the median). The height of each box in the figures is termed as the Inter-quartile Range (IQR). The lower and upper ends of the whiskers (fences) represent 5th and 95th percentile respectively. The 1st and 99th percentiles are denoted by cross marks at the lowest and the highest positions respectively.
Annual Cycles of Climatic Parameters
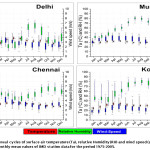
The annual cycles of the three most important climatic parameters which influence the heat stress at the four cities based on the IMD observed values and RegCM simulations are respectively depicted in Figures 2&3. The box plots of climatological values of monthly mean surface temperatures, relative humidity and wind strengths obtained from IMD station data sets are given in this Figure2. Similarly the box plots of climatological values of monthly mean surface temperatures, relative humidity and wind strengths obtained from RegCM simulations are shown in Figure3. While analysing these three weather parameters, one should keep in mind that temperature is not the only parameter to identify human discomfort at any place. So far as the adverse effects of heat stress and discomfort factors are concerned, one needs to analyse the occurrences of high humidity and low wind strength also. It may also be noted that Figures 2&3 shows the climatological values which are obtained after calculating mean values over space and time, whereas the actual daily maximum values are often higher than the monthly mean values.
As seen in Figure2, the distribution of observed temperatures at all the four cities in the 31 years of study lie within a very small range although intensity and month of occurrence of their maximum values vary from city to city. Mostly maximum temperatures are observed in the month of May. The maximum value of monthly temperature in Delhi can reach 400C or more whereas in other three coastal cities the respective value is lower in the range of 30-400C. In Delhi, the relative humidity is observed to have the highest value in August and the wind speed then is close to its lowest value in the month of October. In Mumbai, the maximum value of relative humidity is observed in July whereas the wind strength does not change much throughout the year. In Chennai, maximum relative humidity is observed in October and the wind speed then is close to its lowest value in October. In Kolkata, the maximum relative humidity occurs in August and the wind has an average value of 2.5m/s during that period. Comparison of relative humidity distributions in the four cities brings out the fact that so far as the range of distribution of their maximum values are concerned, Mumbai has the least range followed by Kolkata, Chennai and Delhi in that order. The ranges of maximum values of wind are more or less same at all the four cities lying between 1-2m/sec.
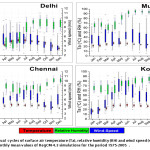
Figure3 shows the annual cycles of the three important weather parameters as simulated by RegCM in terms of box plots. It is well known that every climate model has its biases in surface temperature, relative humidity and wind speed against the actual observations. Basically these differences between the actual measured weather variables and their respective model simulated values arise due to several reasons such as errors in the initial values supplied to the model, approximations involved in solving the nonlinear partial difference equations by numerical techniques and the physical parameterisation schemes adopted. Different climate models are based on different physical parameterisation schemes and hence although the fundamental governing equations are the same in all the models, their outputs differ. Every model has its own biases. Hence at this stage of scientific understanding, in order to compare RegCM simulated fields with respective IMD observed variables, one should focus on the important characteristics of the annual cycles rather than the exact numbers.
Similar to Figure2, in Figure3 the distribution of observed temperatures at all the four cities in the 31 years of study lie within a very small range (small value of IQR) although intensity and month of occurrence of their maximum values vary from city to city. At all the four cities, maximum temperatures are observed either in the month of May or in June. The model simulated monthly mean surface temperatures in May and June are very close to each other. So far as the magnitudes of maximum temperatures are concerned, RegCM underestimates these values at Delhi and Chennai. In Delhi, the relative humidity is observed to have the highest value in September and the wind speed has average value of about 5.5m/s at the same time. In Mumbai, the maximum value of relative humidity is observed in July whereas the wind strength is high at about 6.5m/s then. In Chennai, maximum relative humidity is simulated in November and the wind speed is the lowest then. In Kolkata, the maximum relative humidity occurs in September and the wind has a medium value of about 7m/s during that period. Comparison of relative humidity distributions in the four cities brings out the fact that so far as the range of distribution of their maximum values are concerned, Mumbai has the least range followed by Kolkata, Chennai and Delhi in that order. To be more correct, Kolkata and Chennai have almost similar ranges. This distribution of relative humidity is similar to that in Figure2. However, during that period, the ranges of maximum values of wind are much higher than in Figure2 at all the four cities.
Thus the annual cycles of temperature and their spreads of maximum values as simulated by RegCM4.3 at the four cities are very close to those observed in the IMD data sets. In case of relative humidity, the simulated annual cycles are close to those observed from IMD data except at Kolkata. On the other hand, the annual cycles of winds and their maximum values simulated by the model at the four cities are different from those recorded by IMD. Since all these three weather parameters are important while estimating heat indices and human comforts, it will be interesting to compare the annual cycles of the heat indices based on IMD data and RegCM simulated fields.
Annual Cycles of Heat Indices
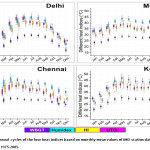
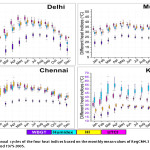
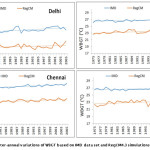
The annual cycles of four important heat indices calculated using IMD station data and RegCM simulations are shown in Figures 4&5 respectively. Figure4 is based on IMD observed surface temperature, relative humidity and wind speeds. The four cities display almost similar types of annual cycles although there are differences in maximum values and ranges. Detailed comparison reveals several similarities. The IQRs of all the four indices at the four selected cities are very small or small except for HI and Humidex at Chennai in the winter months and HI at Kolkata in May and June. Based on their spreads at all the four cities, WBGT seems to be the best index followed by UTCI, Humidex and HI in that order. Another interesting observation is that the annual cycles of three indices Humidex, HI and UTCI are closer to each other at all the four cities whereas that of WBGT is placed lower. The four heat indices peak in earliest in the month of April at Chennai, followed by in May at Mumbai and Kolkata and finally in June at Delhi.
Figure5 displays the annual cycles of the four heat indices calculated from the RegCM simulated values of surface temperature, relative humidity and wind speeds. Figures 4&5 at three cities Delhi, Mumbai and Chennai are close to each other in several respects. The IQRs of all the four indices at the four selected cities are very small or small except for HI at Chennai in the months of January to April and for Humidex at Kolkata almost all the year. As in case of IMD, based on their small spreads at all the four cities, WBGT seems to be the best index followed by UTCI. HI does not do well in Chennai and Humidex seems very bad in Kolkata. Another interesting observation is that annual cycle of HI is close to that of UTCI in three cities such as Delhi, Mumbai and Chennai, whereas it is close to that of WBGT at Kolkata. However, at Kolkata WBGT (and HI), UTCI and Humidex values fall in a wide range with difference of about 10 units. With minor variations, the four heat indices peak in April-May in the four cities of Mumbai, Chennai and Kolkata whereas in Delhi it happens later in June. This is almost similar to that obtained in case IMD data. The most important deviation from Figure3 is the characteristics at Kolkata. This could have happened due to the errors involved while downscaling GCM output by the RegCM. In general, the characteristics of annual cycles of the four heat indices at all the cities obtained from IMD observed data and RegCM simulations agree with each other to a large extent.
Monthly mean values of heat indices and their standard deviations are given in Table 1. It shows that all the heat indices attain their maximum values in the month of June in Delhi and earlier either in April or in May in other three Indian metropolis. These results confirm the same earlier results obtained from Figures 4&5. It is important to note that a direct comparison cannot be made between the absolute values of these indices as they are computed using different formulae. In Delhi, capital of India, UTCI and Humidex show larger range of variation compared to the other two indices. HI increases from a minimum of 25.0±0.4 in January to reach maximum value of 40.7±1.7 in June. Similarly, Humidex varies from 19.9±1.1 in January to 44.5±1.4 in June. WBGT in Delhi is minimum in January at 14.8±0.7 and it peaks in Jun at 28.5±0.7. UTCI increases from a minimum of 15.7±1.5 in January to reach a maximum value of 38.0±1.6 in June. Thus in deceasing order of their ranges in a year, one can place Humidex (24.6), UTCI (22.3), HI (15.7) and WBGT (13.7).
At Mumbai (Table1), HI values range between 29.9±0.9 in January to 38.9±1.2 in May. Here Humidex is minimum at 33.3±1.3 in January to 43.6±0.9 in May. Similarly, WBGT is minimum at 22.8±0.7 in January to 28.1±0.4 in May. UTCI varies from 27.2±1.3 in January to 32.6±0.8 in May. Hence the ranges of Humidex, UTCI, HI and WBGT at Mumbai are 10.3, 9.0, 5.4 and 5.3 respectively.
In case of Kolkata also all the heat indices have their minimum in January and Maximum in May. HI ranges between 29.3 and 42.9. Humidex lies between 27 and 46.5. WBGT is within the range of 19.5 and 29.5 whereas UTCI varies from 26.6 and 35.9. Thus the ranges of Humidex, HI, WBGT and UTCI at Kolkata are 19.5, 13.6, 9.3 and 10 respectively. Unlike at Delhi and Mumbai, here UTCI has the minimum range rather than WBGT.
Finally at Chennai also all the heat indices have their minimum in January and Maximum in May. Here HI ranges between 29.3 and 42.3. Humidex lies between 34.5 and 46.1. WBGT is within the range of 23.5 and 29.3 whereas UTCI varies from 26.6 and 36.4. Thus the ranges of Humidex, HI, WBGT and UTCI at Kolkata are 13.0, 11.6, 9.8 and 5.8 respectively. Like in Delhi and Mumbai and unlike in Kolkata, at Chennai WBGT has the minimum range amongst all the four indices. So far as the comparisons of the ranges are concerned, Delhi has the largest range of all the indices followed by Kolkata and Chennai. Mumbai has the least ranges of all the four heat indices.
Table2 gives the mean monthly rates of change in heat indices per decade. The statistically significant changes at 95% confidence level are shown in bold letters. It is found that all the four heat indices increase significantly in the month of August, although the rates of changes are different for different indices and cities. The highest decadal rate (1.15) of increase occurs in HI at Kolkata and the lowest (0.22) is in WBGT at Mumbai. Comparison shows that rates of increase are relatively less at all the four cities in case of WBGT. Decadal rates of increase more than 0.50 in cases of HI, Humidex and UTCI occurs in 3, 2 and 2 cities respectively. In case of WBGT the rates of increase are less than 0.34 in all the four cities. Amongst all the months, the maximum decadal rate of increase in HI occurs in August at Kolkata with a value of 1.15. The corresponding maximum value of Humidex is 0.69 at Chennai in the month of November. In case of WBGT the corresponding value is 0.39 at Mumbai in January. The maximum decadal increase rate in UTCI is 0.91 in the month of August at Mumbai. These numbers do not lead to any conclusive inference on the decadal rates of increase in heat indices at the four cities, except that August is the most vulnerable month so far as the rate of increase in heat indices is concerned at all the four cities.
Inter-annual Variations of Heat Indices
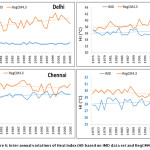
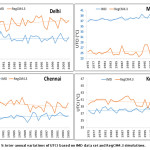
It is essential to examine how the four indices vary from one year to the other at the four selected cities. Figures 6 to 9 depict the inter-annual variations of HI, Humidex, WBGT and UTCI respectively. Here RegCM simulated heat indices are compared with those based on IMD observations. Figure 6 shows the inter-annual variations of HI in IMD data set and RegCM simulations. Model simulated HI values are overestimated in comparison to IMD based values at all the four cities. At Delhi, the overestimation is the largest. Actually, there is not any significant observed trend. The model simulated HI variations at Mumbai, Chennai and Kolkata are closer to those based on observed values as compared to those at Delhi. At Mumbai, there are similar increasing trends both in observation and model simulation. At Chennai and Kolkata, simulated HI variations indicate decreasing trends in contrast to observed increasing trends.
The interannual variations in Humidex (Fig.7) show overestimation of Humidex values in the model simulations as against those based on IMD observations. More or less, the characteristics of variations in Humidex at the four cities are similar to those of HI with some exceptions. At Mumbai, the RegCM results are very close to observations. At Kolkata also the values are very close except that the model based Humidex indices have much more fluctuations whereas IMD based curve has almost no variations.
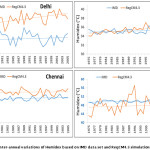
Figure8 shows the interannual variations of WBGT in IMD data set and RegCM simulations. Model simulated WBGT values are underestimated in comparison to IMD data based WBGT at all the four cities. The underestimation is maximum at Delhi and the least at Mumbai. There are more or less similar trends in increase in WBGT at all the four cities. Model simulated UTCI (Fig.9) values are overestimated like in case of HI and Humidex except at Mumbai. At Mumbai, the model values are very much underestimated as compared to those based on IMD observations. So far as the trends are concerned, UTCI exhibits similar characteristics as in HI and Humidex.
Discussion and Conclusions
Various studies have inferred that there is increase in the occurrence of heat extremes in India. Observations also confirm the findings of these studies. The loss in life arising due to the rise in temperature is enormous and is a matter of grave concern. Indirect effects of these extremes in terms of diseases and human health are also important facts to monitor and to take appropriate precautions. There are also indications of enhancement of heat wave conditions in the future and obvious consequent adverse effects on the society. Such problems are not unique to India. Several other countries also suffer from such global changes issues. However, in several developed countries, relevant scientific studies have been conducted with a view to making use of the important findings in terms of their implementation to warn the people and in the process to save precious lives. Development of appropriate heat indices based on physiological measurements, country level mapping of the indices and their use in adequate people friendly early warning system are key to the practical use of scientific investigation for the benefit of the society. In India, a number of industry specific heat indices, especially WBGT measurements have been made in some regions. Heat warning systems are also in place in couple of cities. Several scientific studies have also been conducted on the temperature extremes. However, no comprehensive study has been conducted so far to identify suitable heat index (indices) for the entire country with a view to use those in early warning system with the purpose of saving life.
The first step in the above mentioned process is the detailed examination of some of the existing important heat indices for different regions of India. In this study HI, Humidex, WBGT and UTCI are calculated since these are mostly used in other countries. Today, numerical models are the best tools in climate studies since their results can be conveniently used to project the future. While using a climate model, one should also keep in mind the uncertainties in its outputs. All climate models should be validated for the current climate before using their model outputs in future projections. Keeping that in mind, RegCM4.3 model at 50km horizontal resolution has been used in this study and also simulated surface temperature, relative humidity and wind are validated against corresponding IMD observed datasets. Thus dynamically downscaled fields at the four selected cities i.e.. Delhi, Mumbai, Chennai and Kolkata are used to compute four heat indices. Similarly IMD observed data are used to calculate same four heat indices. The period of study is from 1975 to 2005 which may be considered as the present climate. Keeping the model biases in mind, in this study emphasis has been given on the comparison of annual cycles and inter-annual variations rather than on the actual magnitudes of the fields.
From the results obtained here, it cannot be inferred which of the four most used indices are more favourable than the others to be used for Indian regions. Nevertheless, results indicate that WBGT, which is one of the popular heat index globally, shows similar characteristics in its annual cycles and inter-annual variations in all the four cities considered here. This heat index is best represented by RegCM. Hence, to start with WBGT can be used to map the whole of India in different months and years with a view to study its characteristics in detail. The climate projections from CMIP5 can be used to map not only WBGT but also other useful heat indices into the future after validation of the models. An ensemble of heat indices calculated using the model outputs which are reasonably good for Indian climate may be the first choice for comfort classifications for different regions of India.
Table 1: Monthly mean values of heat indices and their standard deviations at the four major metropolitan cities of India. The values in the first to last rows represent Delhi, Mumbai, Kolkata and Chennai, respectively.
|
HI |
Humidex |
WBGT |
UTCI |
|
|
Jan |
25.0±0.4 29.5±0.9 26.0±0.6 29.3±1.0 |
19.9±1.1 33.3±1.3 27.4±1.2 34.5±1.4 |
14.8±0.7 22.8±0.7 19.5±0.7 23.5±0.7 |
15.7±1.5 27.2±1.3 23.5±1.0 26.6±.1 |
|
Feb |
25.1±0.4 29.9±0.9 28.3±1.0 31.9±1.3 |
22.7±1.6 33.9±1.2 31.4±1.5 37.1±1.5 |
16.5±1.0 23.1±0.7 21.8±0.9 24.9±0.8 |
18.2±1.8 27.3±1.3 26.7±1.4 28.7±1.0 |
|
Mar |
25.2±2.1 33.1±1.4 33.9±1.7 35.7±1.2 |
30.0±5.8 37.9±1.5 38.1±.7 40.7±1.2 |
28.6±1.8 25.2±0.8 25.3±0.9 26.7±0.6 |
23.9±0.9 29.8±1.4 32.1±1.3 31.5±0.9 |
|
Apr |
34.0±1.6 36.5±1.2 40.1±3.2 40.4±1.6 |
36.6±1.7 41.5±1.1 44.2±2.3 44.7±1.2 |
24.3±1.0 27.1±0.5 28.4±1.1 28.6±0.6 |
33.7±1.9 31.4±0.9 35.1±2.0 34.1±0.9 |
|
May |
38.1±2.0 38.9±1.2 42.9±2.4 42.3±1.6 |
41.2±1.9 43.6±0.9 46.5±1.7 46.1±1.2 |
26.8±1.0 28.1±0.4 29.5±0.8 29.3±0.6 |
38.0±2.2 32.6±0.8 35.9±1.5 36.4±1.1 |
|
Jun |
40.7±1.7 37.8±1.4 41.0±2.1 40.0±1.3 |
44.5±1.4 43.2±0.9 45.5±1.3 44.2±1.2 |
28.5±0.7 28.0±0.4 29.0±0.6 28.4±0.6 |
38.0±1.6 31.6±1.0 34.4±1.4 35.8±0.8 |
|
Jul |
39.7±1.5 34.7±1.0 38.9±1.8 38.2±1.2 |
44.5±1.0 41.3±0.6 44.1±1.1 42.9±0.9 |
28.6±0.5 27.1±0.3 28.4±0.5 27.8±0.4 |
34.7±1.3 29.4±0.9 33.1±1.3 34.1±0.9 |
|
Aug |
38.4±1.4 33.6±1.3 38.3±1.9 37.7±0.8 |
43.6±1.1 40.5±0.8 43.8±1.2 42.5±0.7 |
28.2±0.5 26.7±0.4 28.2±0.5 27.6±0.3 |
33.6±1.3 29.0±1.2 32.8±1.4 33.5±0.7 |
|
Sep |
36.8±1.7 34.8±1.3 37.4±1.5 37.6±1.1 |
41.8±1.5 41.0±0.9 43.1±1.0 42.6±0.9 |
27.3±0.8 26.9±0.4 27.9±0.5 26.7±0.4 |
33.3±1.3 30.2±1.1 32.6±1.1 33.1±0.8 |
|
Oct |
31.8±1.1 36.9±1.4 34.8±1.4 34.7±1.1 |
35.5±1.5 41.8±1.2 40.4±1.2 40.6±0.8 |
24.0±0.9 27.3±0.6 26.6±0.6 26.7±0.4 |
33.3±1.3 30.2±1.1 31.9±.0 31.1±0.8 |
|
Nov |
27.0±0.6 33.5±1.5 29.8±1.3 30.9±1.2 |
28.2±1.2 38.0±1.9 34.3±1.8 37.3±1.3 |
19.8±0.7 25.3±1.0 23.5±1.0 25.0±0.7 |
24.8±1.1 31.4±0.9 28.5±1.4 27.9±1.2 |
|
Dec |
25.0±0.5 30.9±0.8 26.3±0.5 29.0±1.0 |
22.0±1.4 34.9±1.2 28.4±1.0 34.8±1.3 |
16.1±0.9 23.7±0.7 20.1±0.6 23.8±0.7 |
18.5±1.8 29.5±0.9 24.3±1.1 26.0±1.2 |
The most important issue today is the measurement of WBGT for different parts of India and classification of human comforts over those regions with the involvement of local people. It may be noted that today, WBGT measurements are not routinely made in India. Hence efforts are going on, in project mode (sponsored by the Department of Science and Technology, Government of India), to measure WBGT and simultaneously human comforts based on the threshold values of WBGT in five cities in India starting from this year. Such activities can be enhanced by expanding the coordinated measurements to several other cities in India. This step will generate ground level data for a number of years which will eventually form the base data for future studies in human health in India.
Table 2: Statistics of mean monthly rate of changes of heat indices (per decade) at the four major metropolitan cities of India. The values in the first to last rows represent Delhi, Mumbai, Kolkata and Chennai, respectively. Statistically significant (at 95% confidence level) values are in 'bold' font.
|
HI |
Humidex |
WBGT |
UTCI |
|
|
Jan |
0.07 0.45 -0.14 0.52 |
0.10 0.66 -0.19 0.67 |
0.11 0.39 -0.06 0.36 |
0.65 0.83 0.19 0.68 |
|
Feb |
-0.05 0.37 -0.03 0.54 |
0.25 0.46 0.18 0.60 |
0.18 0.27 0.16 0.31 |
0.77 0.77 0.44 0.50 |
|
Mar |
-0.38 0.28 -0.31 0.72 |
-0.31 0.32 -0.21 0.59 |
-0.14 0.18 -0.06 0.29 |
0.05 0.52 0.14 0.56 |
|
Apr |
-0.08 -0.12 -0.52 0.61 |
-0.16 -0.10 -0.37 0.46 |
-0.07 -0.04 -0.14 0.22 |
0.02 0.20 0.01 0.34 |
|
May |
0.62 0.23 0.36 0.61 |
0.58 0.19 0.29 0.52 |
0.30 0.10 0.16 0.25 |
0.51 0.39 0.50 0.19 |
|
Jun |
0.51 0.61 0.79 0.43 |
0.47 0.37 0.52 0.43 |
0.22 0.18 0.25 0.23 |
0.25 0.69 0.79 0.14 |
|
Jul |
0.82 0.39 1.06 0.25 |
0.57 0.26 0.65 0.23 |
0.27 0.12 0.31 0.12 |
0.57 0.69 1.05 0.23 |
|
Aug |
0.86 0.72 1.15 0.33 |
0.62 0.46 0.70 0.31 |
0.30 0.22 0.33 0.16 |
0.70 0.91 0.15 0.33 |
|
Sep |
0.72 0.48 0.39 0.53 |
0.67 0.32 0.26 0.46 |
0.33 0.16 0.13 0.23 |
0.57 0.73 0.71 0.42 |
|
Oct |
0.03 0.37 0.39 0.65 |
0.12 0.29 0.33 0.52 |
0.11 0.16 0.18 0.27 |
0.15 0.49 0.57 0.59 |
|
Nov |
0.07 0.51 0.34 0.60 |
0.41 0.66 0.48 0.69 |
0.30 0.37 0.32 0.36 |
0.57 0.55 0.73 0.74 |
|
Dec |
0.08 0.18 0.15 0.66 |
0.33 0.28 0.40 0.67 |
0.27 0.17 0.28 0.35 |
1.05 0.40 0.72 0.89 |
The classification of human comforts are based on threshold values of the heat indices. There is a need to suitably tune the existing heat indices for the Indian conditions where the important surface parameters such as temperature, relative humidity, wind and solar radiation have wide variations. For the future, appropriate thresholds can be set up for various climate regions in India, by making corrections in the existing comfort classifications and making those suitable for Indian climatic conditions. Since air pollution also affects the atmospheric parameters, this aspect may further be introduced in the heat index estimates. Studies can also be performed to find out mortality with respect to circulatory problems or respiratory problems when temperature heat discomforts increase.
Acknowledgements
We acknowledge the financial support from the Department of Science and Technology, Govt. of India with the research grant DST/CCP/(NET-2)/PR-36/2012(G) under the network program of climate change and human health, successfully completed at IIT Delhi (RP2726). Part of this work has also been carried out under the aegis of "DST Centre for Climate Modelling" at IIT Delhi. At the initial phase of this work, there were substantial discussions with Drs.Tord Kjelstrom and Bruno Lemke. The authors acknowledge their help.
References
- IPCC, Summary for Policymakers, in Climate Change: Impacts, Adaptation and Vulnerability. Contribution of Working Group II to the Fourth Assessment Report of the Intergovernmental Panel on Climate Change, Cambridge University Press, Cambridge, UK, p. 17(2007).
- Dash, S.K., Kulkarni, M. A., Mohanty, U. C. and Prasad, K. Changes in the characteristics of rain events in India, Geophys. Res., 114, D10109, DOI:10.1029/2008JD010572(2009).
- Dash, S.K. and Mamgain, A. Changes in the Frequency of Different Categories of Temperature Extremes in India, Appl. Meteor. Climatol., 50, 1842–1858. DOI: http://dx.doi.org/10.1175/2011JAMC2687.1 (2011).
CrossRef - Dash, S.K., Nair, A. A, Kulkarni, M. A. and Mohanty, U. C., Changes in the long and short spells of different rain intensities in India, Theoretical and Applied Climatology, DOI: 10.1007/s00704-011-0416-x(2011).
- Patz, J. A., Engelberg, D., Last, J., The effects of changing weather on public health. Annual review of public health. 21(1), 271-307(2000).
CrossRef - USGCRP, Global Climate Change Impacts in the United States. Karl, T.R., Melillo, J.M., Peterson, T.C., (eds.). United States Global Change Research Program. Cambridge University Press. New York, USA(2009).
- Mills, D. M. Climate change, extreme weather events, and us health impacts: what can we say? Journal of Occupational and Environmental Medicine. 51(1), 26-32(2009).
CrossRef - Hoppe, P. Heat balance modeling Experientia 49.Birkhfiuser Verlag.CH-4010 Basel/Switzerland (1993).
- Parsons, K., Human thermal environments: The effects of hot, moderate, and cold environments on human health, comfort and performance. 3rd edition. CRC Press(2014).
CroosRef - WHO, Regional Office for Europe, Heat health action plans, Guidance report, (2008) http://www.euro.who.int/__data/assets/pdf_file/0006/95919/E91347.pdf.
- Epstein, Y., Moran, D.S. Thermal comfort and heat stress indices, Industrial health, vol.44, pp 388-398(2006).
CrossRef - WHO, Improving Public Health Responses to Extreme Weather/Heat-waves-Euro HEAT, Meeting Report, Bonn, Germany, 22–23 March 2007. euro.who.int/__data/assets/pdf_file/0018/112473/E91350.pdf
- Oliver, J. E., Wilson, L. Climate classification in J. E. Oliver and R. W Fairbridge (eds). The Encyclopedia of Climatology, Van Nostrand Reinhold Company. New Work. pp. 221-236(1987).
- Sharma, P., Dash, S.K. and Singh, S. Heat stress in metropolitan cities in India, Journal of Vayu Mandal. pp94-102(2014).
- Dash, S.K. and Kjellstrom T. Workplace heat stress in the context of rising temperature in India, Current Science, Vol. 101, No. 4, 496-503(2011).
- Rothfusz, L. P. The heat index equation (or, more than you ever wanted to know about heat index). NWS Southern Region Technical Attachment.SR/SSD 90-23, Fort Worth, TX(1990).
- Masterson, J., Richardson, F. A. Humidex, A Method of Quantifying Human Discomfort Due to Excessive Heat and Humidity. Downs view, Ontario: Environment Canada. 45p(1979).
- Yaglou, C.P., Minard, D. Control of heat casualties at military training centers. Am Med Assoc Arch Ind Health.16:302–316(1957).
- Moran, D.S., Epstein, Y. Evaluation of the Environmental Stress Index (ESI) for hot/dry and hot/wet climates, Industrial Health. vol.44, pp 399-403(2006).
CrossRef - Parsons, K. Heat Stress Standard ISO 7243 and its Global Application, Industrial Health. vol44, pp368-379(2006).
CrossRef - ACGIH TLVs and BELs: threshold limit values for chemical substances and physical agents and biological exposure indices. ACGIH, Cincinnati, pp 168–176 (2004).
- Kjellstrom, T., Holmer, I., Lemke, B. Workplace heat stress and health – an increasing challenge for low and middle income countries during climate change. Global Health Action. http://www.globalhealthaction.net/index.php/gha/article/viewFile/2047/2539(2009).
- Lemke, B., Kjellstrom, T. Calculating workplace WBGT from Meteorological Data: A tool for climate Change Assessment, Industrial Health.vol. 60, pp 267-278(2012).
CrossRef - Liljegren, J., Carhart, R., Lawday, P., Tschopp, S., Sharp, R. Modeling Wet bulb Temperature using Standard Meteorological Measurements. Journal of Occupational and Environmental Hygiene5:645-655(2008).
CrossRef - Bernard,T.E., Pourmoghani, M. Prediction of Workplace Wet Bulb Global Temperature. Applied Occupational and Environmental Hygiene 14: 126-134 (1999).
CrossRef - Brice ,T., Hall, T., Wet -Bulb Calculator http://www.srh.noaa.gov/epz/?n=wxcalc(2009).
- Psikuta, A., Fiala, D., Laschweski, G., Jendritzky, G., Richards, M., Blazejczyk, K., Mekjavic, I., Rintamäki, H., Dear, R.d., Havenith, G. Validation of the Fiala multinode thermo physiological model for UTCI application, International Journal of Biometeorology. vol. 56, pp 443-460. DOI:10,1007/s00484-011-0450-5(2011).
- Giorgi, F., Coppola, E., Solmon, F., Mariotti, L., Sylla, M.B., Bi, X., Elguindi, N., Diro, G.T.,, Nair, V., Giuliani, G., Turuncoglu, U.U., Cozzini, S., Guttler, I., O'Brien, T.A., Tawfik, A.B., Shalaby, A., Zakey, A.S., Steiner, A.L., RegCM4: model description and preliminary tests over multiple CORDEX domains. Climate Research. Vol. 52: 7–29, 2012. DOI: 10.3354/cr01018(2012).
- Dickinson, R.E., Henderson-Sellers, A., Kennedy, P.J. Biosphere-atmosphere transfer scheme (bats) version 1e as coupled to the NCAR community climate model, Tech. rep., National Center for Atmospheric Research(1993).
- Holtslag, A.A.M., De Bruijn, E.I.F., Pan, H.L. A high-resolution air mass transformation model for short-range weather forecasting. Mon Weather Rev 118:1561–1575(1990).
CrossRef - Emanuel KA, Zivkovic-Rothman M (1999) Development and evaluation of a convection scheme for use in climate models, J Atmos Sci 56:1766–1782(1999).
CrossRef - Grell GA, Prognostic evaluation of assumptions used by cumulus parameterizations. Mon Weather Rev 121: 754–787(1993).
CrossRef - Pal, J., Small, E., and Eltahir, E., 2000, “Simulation of regional-scale water and energy budgets: Representation of subgrid cloud and precipitation processes within RegCM”, J. Geophys. Res., 105, D24: 29579-29594(2000).
CrossRef - Giorgi, F., Coppola, E., Raffaele, F., Diro, G.T., Fuentes-Franco, R., Giuliani, G., Mamgain, A., Llopart M.P., Mariotti L., Torma C. Change in extremes and hydroclimatic regimes in the CREMA ensemble projections. Climatic Change, 125, 39-51 DOI: 10.1007/s10584-014-1117-0 (2014).
CrossRef - Coppola, E., Giorgi, F., Raffaele, F., Fuentes-Franco, R., Giuliani, G., LLopart-Pereira, M., Mamgain, A., Mariotti, L., Diro, G.T., Torma, C. Present and future climatologies in the Phase I CREMA experiment. Climatic Change, 125, 23-38, DOI: 10.1007/s10584-014-1137-9 (2014).
CrossRef - Dash, S. K., Mishra, S. K., Pattnayak, K. C., Mamgain, A., Mariotti, L., Coppola, E., Giorgi, F. and Giuliani, G. Projected Seasonal Mean Summer Monsoon over India and Adjoining Regions for the 21st Century, Theoretical and Applied Climatology, Vol 122, Issue 3–4, pp.581–593 DOI :10.1007/s00704-014-1310-0(2015).


