Life Cycle Assessment of Secondary Mangrove Forest in Bintuni Bay, West Papua, Indonesia
Rocky Marius Q. de Ramos1
*
 , Michael Lochinvar 3
and Evelyn B Taboada 1,4
, Michael Lochinvar 3
and Evelyn B Taboada 1,4
http://dx.doi.org/10.12944/CWE.12.3.13
The life cycle assessment is conducted in order to assess the impact of mangrove woodchip production in Bintuni bay, West Papua Indonesia on the environment. Study includes the analysis of non-renewable energy use (MJ), global warming potential or carbon footprint (kg CO2), acidification potential (kg SO2) and ozone creation potential (kg O3) of mangrove logging, processing and shipment. Mangrove woodchip production consumes 960 MJ of non-renewable energy and gives out 59.59 kg CO2, .383 kg SO2 and 30.39 kg O3, which is the lowest in comparison with other wood products. Mangrove processing incur less fuel because it is delivered in bulk to the processing area via barges in comparison to other wood products The current shipping of mangrove woodchips to customers has the greatest environmental impact because of the use of bunker fuel. The processing of mangrove woodchips used diesel exclusively for fuel in its power sources. Forest residues from logging can be a source of renewable fuel and may also be another source of new products.
Copy the following to cite this article:
de Ramos R. M. Q, Abundo M. L. S, Taboada E. B. Life Cycle Assessment of Secondary Mangrove Forest in Bintuni Bay, West Papua, Indonesia. Curr World Environ 2017;12(3). DOI:http://dx.doi.org/10.12944/CWE.12.3.13
Copy the following to cite this URL:
de Ramos R. M. Q, Abundo M. L. S, Taboada E. B. Life Cycle Assessment of Secondary Mangrove Forest in Bintuni Bay, West Papua, Indonesia. Curr World Environ 2017;12(3). Available from: http://www.cwejournal.org/?p=18227
Download article (pdf) Citation Manager Publish History
Introduction
Mangrove forests are among the world’s most productive ecosystem. They enrich coastal waters, yield commercial forest products, protect coastlines, and support coastal fisheries. It thrives on tropical climate and on coastal waters in Asia, Africa and South America. They thrive on the harshest environments, usually waters with high salinity, extreme tides, strong winds, high temperatures, muddy and anaerobic soils.1 As of year 2011, it is estimated that the remaining mangrove forest worldwide stands at 13 million hectares, 42% of which is in Asia. Indonesia has the largest area of mangrove forest in the world, with a total of 3.1 million hectares of mangrove forest, 22.6% of the world’s total mangrove forest followed by Australia and Brazil which has 1 million hectares of mangroves in each country.2 Mangroves diverse role to the environment ranges from coastal protection, lessening the effect of climate change and local source income from timber production.3
Decrease in the area of mangroves due to deforestation and conversion to prawn production is alarming. Methods on how to preserve the current mangrove areas and reforestation are being done by different governments around the world. One example is by doing sustainable harvests for mangrove forest, a silvicultural practice where a schedule of regeneration of the forest for harvest is made. The purpose of this method is to decrease the impact of logging. Sustainable harvesting of mangroves may have minimal impact on the forest in the perspective of regeneration, but harvesting and manufacturing inputs like fuel and its effect to the environment cannot be ignored.
The prime objective of this study is to determine and characterize the environmental impact of harvesting mangroves for wood chip production from Bintuni, West Papua, Indonesia. The cradle to gate plus transport life cycle analysis is employed from harvesting and processing to shipping the wood product to the market. The next objective is to assess the environmental impacts while producing and transporting mangrove products and compare it to other wood harvesting activities and find ways to decrease the effect by introduction of new methods and reduction of non-renewable inputs used. The categories employed for comparison are non-renewable energy (NRE) used, carbon footprint, acidification, and ozone creation. Finally, the study explores opportunities for the proper management of this impact considering the sustainability framework which accounts for society, ecology, and economy. Sustainable forest management is a framework adapted in this study. It looks at the perspective of the environment, the society and economic impact the forest brings to the local community. The concept of sustainable forest management guides the company to create sound decision in how to sustainably harvest the forest and leave as little impact to the environment with its operation.
Mangrove Forests in Various Locations
Most mangroves thrive in 300 N and 300 S latitude but can still be found in the coastal areas of Japan, Southern Australia, South Africa and New Zealand.4 The most concentrated mangrove population are found in South East Asia and Australia, of which is composed of islands that is surrounded by coastal areas. Over the last century, mangrove areas declined worldwide because of deforestation and conversion.
South East Asia
Mangroves have been systematically exploited in Indonesia since 1800, especially for the development of brackish water shrimp aquaculture and for timber harvesting. By the end of the 1960s, Indonesia is estimated to have lost more than 200,000 hectares of its mangroves. The rate of mangrove loss started to dramatically increase in the 1970 when exploitation shifted to new areas, encouraged by government policies to boost timber production, followed by policies to expand ponds in 1980s and large scale ponds development triggered by increased shrimp price during Asian financial crisis in 1997. This results the loss of nearly 800,000 ha of mangroves in only 30 years, mostly in the form of low productivity or abandoned ponds. In recent years, timber harvesting activities in Indonesia’s mangroves appear to have become more sustainable.5,6 The decline of Philippine mangroves from half a million hectares in 1918 to 120,000 ha in 1994 may be traced to local exploitation for wood and conversion to agriculture, salt beds, industry and settlements. But brackish water pond culture, whose history is intertwined with that of mangroves, remains the major cause of loss.7
South Asia
Mangrove forests in of Bangladesh, India, Pakistan, and Sri Lanka revealed that the areal extent of mangrove forests in South Asia is approximately 1,187,476 ha representing 7% of the global total. Results showed that, 92,135 ha of mangroves were deforested and 80,461 ha were reforested from 2000 to 2012 with a net loss of 11,673 ha. Major causes of deforestation in South Asia include conversion to other land use (conversion to agriculture, shrimp farms, development, and human settlement), over-harvesting (grazing, browsing and lopping, and fishing), pollution, decline in freshwater availability, flooding, reduction of silt deposition, coastal erosion, and disturbances from tropical cyclones and tsunamis.4
South America
Brazilian mangroves, despite the existence of severe protection legislation are being deforested. Conversions to aquaculture, industrial and urban development among others, have destroyed more than 50,000 ha (about 4% of the total mangrove area in the country) over the past three decades. Restoration efforts have somewhat minimized losses, but has recuperated only a 5% of the total degraded area. Around 70% of Brazilian mangroves are today inside preserved areas.8
Mangrove Wood Harvesting in Bintuni, West Papua, Indonesia
Bintuni Bay is located in the south of the Birds Head Peninsula of West Papua, Indonesia, and is composed of a series of mangrove stands divided up by rivers of various sizes. Globally mangroves have been noted to exhibit huge variation in forest structure and species composition due the array of environmental factors that impact their survival.9 Mangrove deforestation poses a threat over 300,000ha mangrove ecosystem in the Bintuni bay area of Indonesia.10 Mangrove forests conversion into shrimp farms may be the biggest reason for deforestation. It is not sustainable and hence not allows mangroves to grow back on its own. Sustainable mangrove wood harvesting would not involve any conversion and would therefore allow the growth of new mangroves for reforestation.
Bintuni Bay hosts a wide variety of mangrove species that produce diversely structured forests. Predominant species in this forest include Rhizophora Apiculata, Bruguiera Parviflora and Ceriops Tagal. These mangrove species are actively undergoing a forest management focused upon woodchip production as well as sustainable forest management. Currently, the area is approaching its first 25-year rotation cycle, meaning that within the concession there are stands at various stages of regeneration from harvest ranging from 1 to 25 years.11 The mangrove forest concession awarded to company is approximately hectares in size; approximately 86% is approved for mangrove wood extraction while the remaining is used for buffer and protection zones. Primary forest surveys report that the dominant species are Rhizophora spp. (69%), most commonly Rhizophora Apiculata and Rhizophora Mucronata. Other common mangrove species present in the concession include Bruguiera spp. (20%) most commonly Bruguiera Gymnorrhiza, Bruguiera Parviflora and Ceriops Tagal (10%).12
Scope of the Study
The study using the cradle to gate plus transport approach in life cycle assessment. The study would be focusing on harvesting of mangroves to finished woodchips and transportation to customer. Fuel consumption included in the study is from raw material extraction to transporting of mangrove woodchips to customers only. The area of study is in Bintuni Bay, West Papua, Indonesia. The area of harvest from 2014-2016 was set by the company, based on their manufacturing schedule. The type of logs harvested includes Rhizophora Spp., Bruguiera Spp. and Ceriops Tagal, with the majority of the Rhizophora Apiculata. The power required by the production of woodchips comes exclusively from generator sets, fuelled with diesel. A portion (????) of the power is also provided to the small local community. Thus, the fuel used for production includes the power required for household use.
Methodology
The data needed for the life cycle assessment were collected both from the field and production area on the inclusive dates of January 2014 to May 2016. Manufacturing inputs involved were taken from operation (logging using chain saw), transportation (log boats to carry logs from forest to production plant), production (conversion of logs to wood chips) and shipping (transporting woodchips from production plant to customers). Non-production activities that involve the use of fuel (speed boats for transportation of workers, supply and water) were also included.
Data Collection
Woodchip production converted in volume (m3) was used for determining the amount of woodchip produced in the manufacturing facility. The types of fuel used in the harvesting of mangroves (logging), transportation of wood to manufacturing facility, processing into woodchips and transportation to customers are gasoline, diesel and bunker fuel. The amount of fuel used in production were converted into kilogram (kg). Bunker fuel used in the ship that carry the mangrove woodchip were computed according to the frequency of their shipment in the last 3 years. Customer distances were also taken into consideration and the length of time the ship will travel from the manufacturing plant to the location of the delivery. Transportation from the customer back to manufacturing area was also included in the computation. The energy content of diesel, gasoline and gas were estimated based on carbon emissions of fuel database.13 Specific gravity for diesel and gasoline were estimated based on specific gravity of liquids database.14 Bunker fuel energy content were based on the geography of transport systems.15
Impact Assessment
The environmental impact was estimated using the indicators which are based on cumulative non-renewable energy carbon footprint, acidification and ozone creation. These indicators were used because they are the basis for all other minor assessment (soil erosion, human and freshwater toxicity, etc.). Data for comparison with other wood products are available for benchmarking. Listed in Table 1 are all the impact categories and their respective description and unit used. Energy use is based on the potential energy that can be generated by using a unit of fuel in terms of metric joules (MJ). Global warming potential is measured by amount of CO2 or its equivalent. Acidification is the amount of SO2 or its equivalent emitted by burning fossil fuel. Nitrous oxides is the amount of NOx created by using fossil fuels. The categories were based on TRACI 2.1 2014 database shown in Table 1.
Table 1: Life Cycle Impact Assessment Categories Using TRACI Indicators
|
Category Indicator |
Impact Category |
Description |
Unit |
References |
|
Energy Use |
Non-Renewable Energy Use |
A measure of the total amount of primary energy extracted from the earth. PE is expressed in energydemand from non-renewable resources (e.g. petroleum, natural gas, uranium, etc.) Efficiencies in energy conversion (e.g. power, heat, steam, etc.) are taken into account. |
MJ |
[14] [16] [17] |
|
Climate Change |
Global Warming Potential (GWP) Carbon Footprint |
A measure of greenhouse gas missions, such as CO2 and methane. These emissions are causing an increase in the absorption of radiation emitted by the earth,magnifying the natural greenhouse effect. |
kg CO2 and Equiv. |
[18] [16] [13] [19] [20] [21] |
|
Acidification |
Acidification Potential (TRACI) |
A measure of emissions that cause acidifying effects to the environment. The acidification potential is assigned by relating the existing S-, N-, and halogen atoms to the molecular weight. |
kg SO2 and Equiv. |
[16] [20] [19] |
|
Ozone Creation in Troposphere |
Photo chemical Ozone Creation Potential (POCP) Smog Air (TRACI) |
A measure of emissions of recursors that contribute to low level smog, produced by the reaction of nitrogen oxides and VOC’s under the influence of UV light. |
kg O3 Equiv
kg NOx equiv |
[16] [20] [19] |
Comparison with environmental impacts in other wood products was also used in the study for comparison with mangrove production and transport. There are differences between the harvesting, processing and delivery of hardwood in comparison to mangrove woodchip, but the unit used for the impact assessment were all converted into m3. All hardwood used in comparison of producing 1 m3 of mangrove woodchip, its environmental impact and amount of fuel used were compared with producing 1 m3 of rough-sawn, kiln-dried U.S. white oak lumber 2.54 cm thick.22
Results
Table 2 summarizes all the inputs needed for mangrove harvesting during the period of January 2014 to May 2016. Diesel is used for the generator sets for the processing of woodchips and fuel for boats used in hauling logs, supplying water and transporting people. Gasoline is used primarily for logging and felling of trees.
Table 2: Mangrove Harvesting Yield and Fuel Used
|
2014 |
2015 |
Jan-May 2016 |
|
|
Woodchips Produced (m3) |
93,178 |
69,609 |
31,909 |
|
Diesel (kg) |
312,691 |
301,145 |
120,289 |
|
Gasoline (kg) |
66,252 |
59,696 |
29,204 |
Non-Renewable Energy Usage
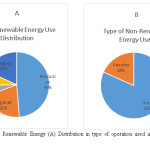
Figure 1 shows the ratio of non-renewable energy (NRE) used in harvesting and production of mangrove woodchips. NRE usage can be attributed largely to Diesel (82%), which is used for processing of woodchips and for logistics operations. Gasoline contributes to 18% of NRE use which is used exclusively on logging operations. About 49% of the NRE used is from the processing of woodchips while 33% is used on transport (log boat, speed boat and water supply boat). Result shows that49% of the NRE use is forprocessing woodchips, 21% forhauling logs, 18% for logging, 7% for water supply boat and 5% for speedboats in the two years (Jan 2014 to May 2016).
 |
|
Carbon Footprint
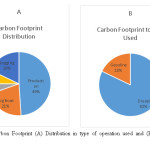
Figure 2 will show the ratio for carbon footprint used in harvesting and production of mangrove woodchips. Diesel (82%) accounts for the largest contribution of carbon emission. Gasoline (18%) comes in second. About 49% of the carbon emissions used is from the processing of woodchips while 33% is used on transport. From January 2014 to May 2016, 49% of the carbon footprint is from processing woodchips, 21% from hauling logs, 18% from logging, 7% from water supply boat and 5% from speedboats.
 |
|
Cradle to Gate Life Cycle Assessment Result
Table 3: Cradle to Gate Environmental Impact of 1m3 of Woodchip
|
Impact Category |
Total |
|
Non-Renewable Energy (MJ) |
196.03 |
|
Carbon Footprint (kg CO2) |
14.69 |
|
Acidification (kg SO2) |
0.001 |
|
Ozone Creation-Smog Air(kg O3) |
3.39 |
|
*MJ/Liter of Diesel [23] |
41 |
Table 3 shows that the total NRE used in processing 1 cubic meter of woodchips is 196.03 MJ. In comparison, potential NRE used by a liter of diesel fuel is 41 MJ or around 5 liters of diesel is used to produce 1 cubic meter of woodchips, the total carbon footprint produced is 14.69 kg CO2, the total acidification produced is 0.001 kg SO2 and total ozone creation-smog air produced is 3.39 O3.
Table 4: Cradle to Gate Environmental Impact of 1 m3 of Woodchip
|
Operation or Process Step |
NRE (MJ) |
Carbon Footprint(kg CO2) |
Acidification(kg SO2) |
Ozone Creation-Smog Air (kg O3) |
|
Production |
95.50 |
7.19 |
0.00079 |
1.67 |
|
Log Boat |
40.13 |
3.02 |
0.00033 |
0.70 |
|
Speed Boat |
10.63 |
0.80 |
0.00008 |
0.19 |
|
Water Supply Boat |
13.89 |
1.04 |
0.00011 |
0.24 |
|
Logging |
35.86 |
2.62 |
0.00011 |
0.59 |
Table 4 shows that more than half (95.5 MJ) of the NRE used is on the generators for production of woodchips and local energy source of the community. The log boat for transporting the timber from harvest area to processing and logging operation comes second and third in terms of NRE use with 40.13 MJ and 35.86 MJ for every 1 cubic meter of woodchips produced respectively While more than half (7.19 kg CO2) carbon footprint produced comes from the generators for production of woodchips and local energy source of the community. The log boat for transporting the timber from harvest area to processing and logging operation comes second and third in terms of carbon footprint with 3.02 kg CO2 and 2.62 kg CO2 produced respectively. More than half (0.00079 kg SO2) of the acidification produced comes from the diesel used in generators for production of woodchips and local energy source of the community. The log boat for transporting the timber from harvest area to processing and comes second in terms of acidification with 0.00033 kg SO2 produced. More than half (1.67 kg O3) of the ozone creation-smog air produced comes from the diesel used in generators for production of woodchips and local energy source of the community. The log boat for transporting the timber from harvest area to processing and logging operation comes second and third in terms of ozone creation-smog air with 0.70 kg O3 and 0.59 kg O3 for every 1 cubic meter of woodchips produced respectively.
Cradle to Gate Plus Transport Life Cycle Assessment Result
Mangrove woodchips are delivered to customers in bulk using medium type shipping vessels. Amount of bunker fuel used by ships is computed by amount used/day multiplied to the number of days travelled by the vessel. Customer distance from the manufacturing facility is taken from customer delivery for the last 3 years, its frequency and days of travel. Consumption of bunker fuel was based on distance and average speed of most cargo vessels of same kind and average consumption of fuel.24
Table 5: Cradle to Gate Plus Transport Environmental Impact of 1m3 of Woodchip
|
Operation or Process Step |
NRE (MJ) |
GWP-CarbonFootprint (kg CO2) |
Acidification(kg SO2) |
Ozone Creation –Smog Air (kg O3) |
|
Production (Diesel) |
95.50 |
7.19 |
0.00078 |
1.67 |
|
Logboat (Diesel) |
40.13 |
3.02 |
0.00033 |
0.70 |
|
Speedboat (Diesel) |
10.63 |
0.80 |
0.00008 |
0.19 |
|
Water Supply Boat (Diesel) |
13.89 |
1.04 |
0.00011 |
0.25 |
|
Logging (Gasoline) |
35.86 |
2.62 |
0.00011 |
0.59 |
|
Shipping (Bunker) |
764.18 |
44.90 |
0.38213 |
27.00 |
|
Total |
960.22 |
59.59 |
0.38357 |
30.39938 |
Table 5 shows the use of non-renewable energy in transporting woodchips is the largest contributor to the negative impact on the environment, considering the distance from production to supplier and the frequency of delivery.
Discussion
This data would be compared to other wood products LCA in order to gauge the efficiency of the company in terms of environmental protection.
![Figure 3: Comparison of Non-Renewable Energy Use (MJ) of Different Wood Products. Sources of data for other wood products from American Hardwood Export Council [22]](http://www.cwejournal.org/wp-content/uploads/2017/11/Vol12_No3_Lif_Roc_Fig3-150x150.jpg) |
|
Figure 3, shows that comparison to other wood products, mangrove woodchips has the lowest NRE use. The use of less NRE on the harvesting and processing may attribute to low fuel consumption. Logs are delivered in bulk to the processing area via barges and incur less fuel in comparison to harvested logs that are delivered by trucks.
![Figure 4: Comparison of Global Warming Potential (kg CO2) of Different Wood Products. Sources of data for other wood products from American Hardwood Export Council [22]](http://www.cwejournal.org/wp-content/uploads/2017/11/Vol12_No3_Lif_Roc_Fig4-150x150.jpg) |
|
Figure 4, reflects that mangrove woodchips has the lowest global warming potential - carbon footprint. The less use of fuel may attribute to the low contribution of CO2 to the air. Unlike other wood products, mangrove woodchips are transported without drying, while other wood products are kiln dried before being delivered to customers.
![Figure 5: Comparison of Acidification Potential (kg SO2) of Different Wood Products. Sources of data for other wood products from American Hardwood Export Council [22]](http://www.cwejournal.org/wp-content/uploads/2017/11/Vol12_No3_Lif_Roc_Fig5-150x150.jpg) |
|
Figure 5, shows that mangrove woodchips has the lowest acidification emission. The less use of fuel may attribute to the low contribution of SO2 to the air. The use of euro 3 gasoline and diesel also helped in the low sulphur level of operation and production of mangrove woodchips.
![Figure 6: Comparison of Ozone Creation (kg O3) of Different Wood Products. Sources of data for other wood products from American Hardwood Export Council [22]](http://www.cwejournal.org/wp-content/uploads/2017/11/Vol12_No3_Lif_Roc_Fig6-150x150.jpg) |
|
Figure 6, reflects that mangrove woodchips produce the lowest amount of smog air emission among all wood products. The Shipping of mangrove chips to the customers consumes a lot of bunker fuel and releases a lot of nitrogen oxides to the air. NOx were converted to O3 equivalents using Traci index.
Opportunities to Decrease Impact to Environment Identified in the Life Cycle Analysis
Life cycle analysis result can enable companies to make decisions that would decrease the impact of mangrove harvesting to the environment. Existing result in the cradle to gate plus transport life cycle assessment shows encouraging result because out of most wood products, it has the lowest environmental impact on all 4 above mentioned categories. However, there are still some improvements that can be done to enhance the production and transportation even more. Here are some of the opportunities found to be able to decrease the impact caused by farming and processing operations.
Decrease in amount of bunker fuel used for shipping
Increase efficiency of shipping by decreasing the number of delivery to customer and increasing the size of shipment, can be done by proper scheduling of shipping to decrease the frequency of shipping. Market demand would determine the increase and decrease of shipment, but increasing the volume would lessen the number of shipments/year and would result to a decrease the use of bunker fuel. In the future, they can use ships having high carrying capacity (20,000 m3) of woodchips. Increase in its volume/shipment for the next cargo in using the high capacity ships, the difference is equal to .57 in 7 months or 1 shipment saved per year, equivalent to 25% decrease in NRE used, carbon footprint, acidification potential and ozone creation because of the decrease in use of bunker fuel.
Decrease in amount of diesel used for generators
Increase efficiency of diesel generators through proper scheduling, maintenance and replacement of generators can be done to decrease the fuel used for generators. Since the company has multiple generators for different time of use, proper scheduling of when to use the large generators for large load and the small generators for smaller load may be studied further. Procurement of newer and much more efficient generators is needed to decrease the consumption even more.
Make use of other sources for energy and venture into more renewable energy
A lot of biodegradable biomass (bark, leaves, branches) are left in the forest after harvesting the mangrove trees. The use existing mangrove bark for biomass as fuel may be studied to decrease the dependence on diesel and gasoline in harvesting to production of mangrove wood chips. Mangrove barks that are left in the area can reach between 1840 kg to 4490 kg per hectare.25 Normally the company may harvest between 800-1000 hectares of mangroves per year. It would generate a minimum of 1,470 tons of bark alone as a biomass fuel. Harvested barks therefore has the potential of producing 5,000 MWh of electricity.27 Currently, debarking of wood is done on the forest site. The use of barks for biomass, debarking may be done in the production plant. This will result in a more efficient harvesting of wood and lesser manpower needed on the forest. Non-renewable energy source may also be studied for a cleaner source of energy. Since all mangroves grow in coastal areas, energy from tides and current of water may be installed to decrease dependence on non-renewable energy sources.
Conclusion
The cradle to gate plus transport life cycle assessment gives us an idea of how mangroves are harvested, processed and shipped to its customers. The objective would be to quantify the impact that can contribute to global warming, the use of non-renewable energy in relation to renewable energy, the acidification potential it can contribute to the air and the ozone creation potential in contributes to the atmosphere. Benchmarking with other wood processors will give the market more knowledge of the product they buy, thus producers should make more effort in taking care of the environment, making consumption and production sustainable.
As with mangrove processing and shipping the product to clients has the highest NRE, carbon footprint, acidification potential and ozone creation. Consumption of bunker fuel in the shipping is the major cause of the problem. In the processing the mangrove to woodchips, the production are has the highest environmental impact because of diesel use in generators. By decreasing the frequency of shipment can maximize the volume being transported, the company will not just be able to save on cost, but also decrease the use of bunker fuel. Proper scheduling of generators to accommodate the electrical load may decrease the consumption of diesel. Maintenance and replacement of generators may also be done to decrease the consumption of fuel. Employing other means of renewable energy like wave may also be ventured in the future to decrease reliance on non-renewable source. Accumulation of forest residues from logging may be a source of renewable energy and other value added products.
Acknowledgments
I would like to thank the management of the concession in Bintuni Bay, West Papua, Indonesia for the data provided for study and the accommodation while the study is being conducted in the area. I would also like to thank Nanyang Technical University, Singapore for letting us use its facility and allowing us to do our research in the University. I would also like to thank Department of Science and Technology Engineering Research and Development for Technology, Philippines for giving us the opportunity to do our research.
References
- K. Kathiresan and B. Bingham, "Biology of Mangroves and Mangrove Ecosystems," Advances in Marine Biology Vol 40, pp. 81-251, 2001.
- C. Giri, E. Ochieng, L. Tieszen, Z. Zhu, A. Singh, T. Loveland and N. Duke, "Status and distribution of mangrove forests of the world using earth observation satellite data," Global Ecology and Biogeography, pp. 154-159, 2011.
- D. M. Alongi, "Mangrove forests: Resilience, protection from tsunamis and responses to global climate change," Estuarine, Coastal and Shelf Science 76, pp. 1-13, 2008.
- C. Giri, J. Long, S. Abbas, R. Murali, F. M. Qamer, B. Pengra and D. Thau, "Distribution and dynamics of mangrove forests of South Asia," Journal of Environmental Management 148, pp. 101-111, 2015.
- M. Ilman, P. Dargushch, P. Dart and Onrizal, "A historical analysis of the drivers of loss and degradation of Indonesia's Mangrove," Land Use Policy 54, pp. 448-459, 2016.
- J. Paw and T. Chua, "Managing Coastal Resources in Cilacap, Indonesia, and Lingayen Gulf, Philippines--an ASEAN Initiative," Marine Pollution Bulletin. VoL 23, pp. 779-783, 1991.
- J. Primavera, "Development and conservation of Philippine mangroves: institutional issues," Ecological Economics 35, p. 91–106, 2000.
- A. C. Ferreira and L. D. Lacerda, "Degradation and conservation of Brazilian mangroves, status and perspectives," Ocean & Coastal Management 125, pp. 38-46, 2016.
- R. Pribadi, "The Ecology of Mangrove Vegetation in Bintuni Bay, Irian Jaya, Indonesia (Unpublished Doctoral Thesis)," Department of Biological and Molecular Sciences, University of Stirling, Scotland, 1998.
- H. J. Ruitenbeck, "Modelling economy-ecology linkages in mangroves: Economic evidence for promoting conservation in Bintuni Bay, Indonesia," Ecological Economics 10, pp. 233-247, 1994.
- M. Sillanpaa and J. Vantellingen, "Forest Survey Report: Assessing Secondary Mangrove Forest Regeneration in PT BUMWI concessions. Bintuni Bay, West Papua, Indonesia," Green Forest Product & Tech. Pte. Ltd., Research Dept., 2015.
- Wahyudi, Machmud and Sudjarmaji, "Seed Trees Method: system of sylviculture for harvesting and managing mangrove forest in Indonesia," International Journal Sustainable Future for Human Security Vol 1, 2013.
- Engineering toolbox, "Carbon Emissions of Fuel," Retrieved from Engineeringtoolbox.com 8/1/2016, 2015.
- Engineering toolbox, "Specific Gravity of Liquids," retrieved from engineeringtoolbox.com 8/1/2016, 2015.
- J.-P. Rodrigue, "The Geography of Transport Systems," retrieved from http://www.people.hofstra.edu, 2015.
- J. B. Guinee, M. Goree, R. Heijungs, G. Huppes, R. Klejin, A. de Koning and H. Udo de Haes, Handbook on Life Cycle Assessment: Operational Guide to ISO Standards, Kluwer Academic Publishers, 2002.
- R. Frischknecht and N. Jungbluth, "Implementation of Life Cycle Impact Assessment Methods," Ecoinvent report No. 3, pp. 1-139, 2007.
- G. Sinden, Specification for the assessment of the life cycle greenhouse gas emissions of goods and services, British Standards Institution, 2008.
- J. Colls, Air Pollution: Second Edition, Spon Press Taylor & Francis Group, 2002.
- J. Bare, "TRACI 2.1 Database the tool for the reduction and assessment of chemical and other environmental impacts," Retrieved from https://www.epa.gov/chemical-research/tool-reduction-and-assessment-chemicals-and-other-environmental-impacts-traci, 2014.
- J. Vidal, "Shipping boom fuels rising tide of global CO2 emissions," theguardian.com, 2008.
- P. I. AG, "Life Cycle Assessment of Rough-sawn Kiln-dried Hardwood Lumber," American Hardwood Export Council, 2012.
- N. Parker, "A Beginner’s Guide to Energy and Power," Renewable Energies Transfer System Project, 2011.
- N. Bialystocki and D. Konovessis, "On the estimation of ship’s fuel consumption and speed curve: A Statistical Approach," Journal of Engineering and Science, pp. 157-166, 2016.
- L. D. de Lacerda, Mangrove Ecosystems: Function and Management, Springer-Verlag, 2002, p. 53.
- S. Sathe, R. Lavate and L. Bhosale, "Mangrove as source of energy for Rural development with special reference to Ratnagiri and Sindhudarg district (MS) India," Bioscience Discovery 4, pp. 198-201, 2013.
- N. Krajnc, Wood Fuels Handbook, FAO, 2015.


