Multivariate Water Quality Assessment of Renowned Pilgrim Spot, Gujarat, India: A Statistical Approach
Sheju Thomas1
, Hiren B Soni2
*
 and Ashok Kumar Saxena1
1
Gujarat Ecology Commission (GEC), Government of Gujarat,
Block No. 18, 1st Floor, Udhyog Bhavan, Sector 11,
Gandhinagar,
382 011
Gujarat,
India
2
PG Department of Environmental Science and Technology (EST),
Institute of Science and Technology for Advanced Studies and Research (ISTAR),
Vallabh Vidyanagar,
388 120
Gujarat,
India
http://dx.doi.org/10.12944/CWE.12.3.10
Copy the following to cite this article:
Thomas S, Soni H. B, Saxena A. K. Multivariate Water Quality Assessment of Renowned Pilgrim Spot, Gujarat, India: A Statistical Approach. Curr World Environ 2017;12(3). DOI:http://dx.doi.org/10.12944/CWE.12.3.10
Copy the following to cite this URL:
Thomas S, Soni H. B, Saxena A. K. Multivariate Water Quality Assessment of Renowned Pilgrim Spot, Gujarat, India: A Statistical Approach. Curr World Environ 2017;12(3). Available from: http://www.cwejournal.org/?p=1061
Download article (pdf) Citation Manager Publish History
Introduction
So far liminological studies have been mainly aimed to focus on deterioration of the water quality due to pollution only on the part of human consideration. Now-a-days, pilgrimage ponds visited by number of pilgrims are an addition to many folds to this devastation, which has now become a cause of global concern.1 The productivity of the pond mainly depends on various abiotic and biotic components usually fluctuated by seasonal and varying degree of pollution.2 Hydro-chemistry of water plays a paramount role in determining the distribution and pattern, and quantitative abundance of an aquatic ecosystem.3 Water quality assessment approach allows the physical, chemical, and biological characterization of the water to be considered in light of their probable impact on advantageous uses of the water by humans. For the past many years, investigators have studied the hydro-biological profile of many lentic ecosystems with the intent to assess the water quality.4,5,6,7 Recently,8 reported the hydro-quality profile of pilgrimage wetland of Central Gujarat. In past, biotic components viz. occurrence of plankton of Gomti Palustrine Habitat (GPH) were investigated9,10, but mere focus was paid on status of surface water quality for the aforesaid study area. Present study deals with the multivariate approach to speculate the degree of fluctuations of significant hydro-chemical parameters of surface water at Gomti Palustrine Habitat (GPH), Central Gujarat, India, owing to non-point anthropogenic interventions, consequentially imparting pessimistic impact on aquatic body, which perhaps will help in plummeting human pressures distressing on the selected renowned pilgrimage freshwater spot aided with some conservation and management strategies.
Materials and Methods
Study Area
Gomti Palustrine Habitat (GPH)
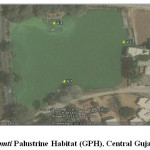
Gomti Palustrine Habitat (GPH), Central Gujarat, India, is located between 22.590 N and 72.870 E; with an average humidity 52%; winter temperature 19 0C and 33 0C during summer; mean elevation 37 meters above MSL, 8733 human population with 72% literacy rate. The wetland covers an area of approximately 173 acres. From the spirituality point of view, this pilgrim spot is the most worshiped holy place of Lord Swaminarayana (the incarnation of Lord Krishna), solemnised with ancient galore and varying rituals, hence fetching the source of sacredness for the pilgrims from all over the State and the Country. (Fig. 1).
 |
|
Sampling Sites
Sampling Site V1
This Site is situated at the southern end of GPH adjacent to village (Vadtal). The mean water depth of this Site is around 6.096 m during monsoon; however, water level recedes during summer. The water at this Site is comparatively unpolluted than the other two study Sites. The dominant macrophytes at this Site are Hydrilla verticillata (L.f.) Royle, Azolla pinnata R. Br., and Ipomoea aquatica Forsk. Fishing by the local anglers has been a regular activity therein. Sometimes, cattle wading and bathing is also noticed here
Sampling Site V2
This Site is situated westwards to the wetland which is highly polluted with organic matter owing to its proximity to agricultural plots in addition to influent of raw sewage from nearby households. Amount of organic wastes frequently is dumped at this Site due to unchecked input of detergents and household wastes, generated from washing, bathing and cattle wading activities by the locales. Moreover, garlands, clothes, coconuts, etc. are also discarded in the form of temple wastes into this Site. The villagers use the water of this Site, mainly for washing clothes and utensils, and thus detergent wastes reaches to high amounts
Sampling Site V3
This Site is situated towards the northern side of the wetland. The floral aquatic plant species dominating the Site are Eichhornia crassipes (Mart.) Solms., Lemna minor L., Ipomoea aquatica Forsk., with uncommon occurrence of Ceratophyllum demersum L., Najas minor All. and Marsilea quadrifolia L. Dumping of plastic bottles and menace tourism wastes by local bus passengers are observed therein due to Site proximity near local bus stop and road transport network
Surface Water Sampling
The present study was undertaken for one year (December, 2012 to November, 2013) with monthly sampling , covering three successive seasons (winter, summer, monsoon). Three permanent sampling stations (V1, V2, V3) were selected to cover the cross-sectional and diagonal regime of wetland. Collection of surface water samples were done using pre-cleaned polyethylene bottles (two litres), filtered using 0.45 micron filters, and stored in ice boxes at -4 0C for further laboratory analysis. Standard protocol was adopted for surface water analysis.11,12,13,14
Physico-chemical parameters including sulphate (SO42-), phosphate (PO42-), nitrate (NO3-), total dissolved solids (TDS), total suspended solids (TSS), total solids (TS), total hardness (TH), calcium hardness (Ca), and magnesium hardness (Mg), were analysed, along with in-situ measurement of temperature (0C) and pH probe (LUTRON PH-201). Besides, dissolved oxygen (DO) was fixed on-site, and subsequently analysed using Alkali–Azide modification by Winkler’s method.15 sulphate and phosphate were estimated by turbidimetric, and Stannus Chloride method, respectively. Nitrate concentration was determined by Brucine-Sulphate method prescribed by NPDES (National Pollutant Discharge Elimination System) and SDWA (Safe Drinking Water Act). Flame Photometric method was performed to estimate sodium and potassium concentrations, while alkalinity, chloride and salinity were quantified titrimetrically.
Statistical analysis is one of the best techniques for stipulating linear relationship between different variables (parameters).16 In order to quantitatively analyse and confirm the relationships amongst the variables, its scientific reliability was validated using Correlation Coefficient (r), Ion Signatures (IS), Index of Base Exchange (IBE), Sodium Absorption Ratio (SAR), Principal Component Analysis (PCA), and One Way ANOVA (Analysis of Variance), using PAST Software, Version 3.03, SPSS version 22.0, STATISTICA 9 and Aq.QA Software [Version 1.1.1 (1.1.5.1)].
Results and Discussion
Surface Water Quality
Analysis of hydro-chemical constituents of GPH at sampling points is shown in Table 1. Results indicated that pH increased from 7.50 to 7.53. TDS ranged between 163.61 to 175.28 ppm. According to17, surface water quality is of fresh type (TDS < 1000 ppm). DO ranged between 4.92-5.39 ppm, referring to a bit hypoxic condition of water body. TH fluctuated from 168.28 to 178.02 ppm, symbolizes the moderatel hard water quality (TH > 300 ppm;18 Cations and anions quantifications depicts that Ca2+ ranged between 153.95 to 163.27 ppm, Mg2+ (14.33 to 14.59 ppm), Na+ (64.18 to 64.29 ppm;), K+ (7.52 to 8.57 ppm), HCO3- (214.21 to 221.88 ppm), Cl- (105.61 to 111.34 ppm), SO42- (19.12 to 24.27 ppm), PO4- (0.844 to 1.644 ppm), and NO3- (0.307 to 0.370 ppm). The concentration gradient of surface water of aquatic body is characterized as Ca2+ > Na+ > Mg2+ > K+:HCO3- > Cl- > SO42- > PO4- > NO3-. The outcomes of Aq.QA Software [Version 1.1.1 (1.1.5.1)] delineate the pilgrim wetland as a dominant water type (Na-HCO3- type). Na-HCO3- composition may be due to weathering of carbonaceous sandstones (consistent with geological signatures) or may be due to interaction with schist, quartzite, and granite rocks. Exchangeable Sodium Ratio (ESR) is 1.416 meq/l, and Sodium Absorption Ratio (SAR) is 1.367 meq/l. The surface water quality of entire study area falls under C1-S1 low salinity-low sodicity zone19, and low SAR (Sodium Absorption Ratio = Na+ / {[Ca2+ + Mg2+] / 2} * 0.5) zone. SAR is found to be lower indicating leaching and dissolution of salts during precipitation.20 As the surface water quality is exhibited by low salinity and low sodicity zone, the water is of good water type, and can be used for irrigation purpose with little menace of exchangeable sodium.19 The impact of geological and anthropogenic activities on the hydro-chemistry of surface water can further be extrapolated with the help of scatter diagrams, ionic signatures.21
Table 1: Physico-chemical constituents of surface water at sampling points
|
Parameters |
V1 |
V2 |
V3 |
Mean |
S.D. |
|
Temperature (ºC) |
25.67 |
26.90 |
26.58 |
26.38 |
±0.641 |
|
pH |
7.50 |
7.53 |
7.52 |
7.52 |
±0.014 |
|
DO |
5.39 |
4.92 |
5.11 |
5.14 |
±0.234 |
|
TS |
293.46 |
308.01 |
299.82 |
300.43 |
±7.292 |
|
TSS |
129.85 |
132.72 |
130.67 |
131.08 |
±1.481 |
|
TDS |
163.61 |
175.28 |
169.15 |
169.35 |
±5.838 |
|
Free CO2 |
9.02 |
8.43 |
8.80 |
8.75 |
±0.299 |
|
TA |
214.21 |
221.88 |
219.56 |
218.55 |
±3.932 |
|
Bicarbonates |
214.21 |
221.88 |
219.56 |
218.55 |
±3.932 |
|
TH |
168.28 |
178.02 |
173.96 |
173.42 |
±4.895 |
|
Ca |
153.95 |
163.27 |
159.37 |
158.86 |
±4.685 |
|
Mg |
14.33 |
14.75 |
14.59 |
14.56 |
±0.211 |
|
Chloride |
105.61 |
111.34 |
109.24 |
108.73 |
±2.901 |
|
Salinity (ppt) |
0.1908 |
0.2012 |
0.1974 |
0.1964 |
±0.005 |
|
Sulphate |
19.12 |
24.27 |
19.69 |
21.03 |
±2.821 |
|
Phosphate |
0.844 |
1.644 |
1.220 |
1.236 |
±0.400 |
|
Nitrate |
0.397 |
0.307 |
0.370 |
0.358 |
±0.046 |
|
Sodium |
64.18 |
64.29 |
64.24 |
64.24 |
±0.053 |
|
Potassium |
7.52 |
8.57 |
8.20 |
8.10 |
±0.532 |
*All the values are expressed in ppm, except pH
Ionic Trends
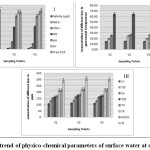
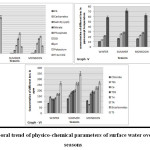
Overall scenario of the ionic trends of water quality is well-depicted (Fig. 2). All the water quality parameters were reported to be significantly higher at Site 2, followed by Site 3 and least at Site 1. Except for few parameters (Free CO2, NO32- and DO), reverse trend was noticed. The lesser content of DO at Sites 2 and 3 can be attributed by the fact that higher concentration of nutrients at these sites adversely affects the solubility of oxygen in water22. Content of DO was observed to be high in the colder season, which can be ascribed to low atmospheric and water temperature, indirectly increasing the solubility of oxygen in water. These findings are in agreement with the investigation of.23,24 Similarly, free CO2 concentration was found to be higher in the winter season, which might be due to low temperature and high rate of decomposition.25 Similar trend was well-corroborated with the findings of.26
Higher concentration of Free CO2 at Site 1 was due to excessive content of organic loading in surface waters of a particular site. The term “solids” refers to the total amount of organic and inorganic materials in water27, of which Total Suspended Solids (TSS) refers to an indicator parameter referring to the amount of organic pollution.28 Concentration of solids was observed higher in warmer months due to the evaporative loss of water and subsequent increase in solute concentration in surface water.29 Gradual depletion during the hotter months is due to the sedimentation of salt particles with low content of suspended organic matter.30 Total alkalinity in surface water is mainly due to salts of carbonates, bicarbonates and hydroxides.31 Increase in carbonates and bicarbonates leads to increase in the concentration of alkalinity.32 Temporary hardness was noted to be elevated during the warmer months due to an increase in temperature, which eventually leads to high rate of evaporation of surface water, and decomposition and solubility of calcium and magnesium ions, thus concentrating the salts.33 Temporal concentration of chloride recorded to be higher in summer season due to higher pollution level, owing to low water depth leading to an increase in concentration of organic matter.34,35 These finding were well- corroborated with the findings of.29,28
In case of nutrient concentration, sulphate reported to be maximum in the summer season, which might be due to higher evaporation rate as per.33 Spatial heterogeneity indicated average concentration of sulphate to be higher at Site 2 compared to other sites due to an increase in bathing and washing practices by local inhabitants as well as pilgrims. This finding was also supported by.36 Phosphate is one of the limiting and basic nutrients of the static waters.37 Presence of phosphate in water indicates pollution through domestic sewage, agricultural run-off and certain biological processes.38 In the present study, the content of phosphate was estimated to be higher in dry seasons with the decline in the water level. Decomposing of organic matter, human indulgence, and loading of domestic sewage through point and non-point sources make the hydric water to be more phosphate rich.39 Results points towards increasing concentration of phosphate ion at Site 2 compared to other sites, and during dry seasons its concentration increased with gradual decrease during the colder months. Nitrate in the present study was found to be eventually increasing during the colder months due to higher rate of biotic components viz. aquatic macrophytes and plankton community as earlier reported8 (Fig. 3.) (Table 1).
 |
|
 |
|
 |
|
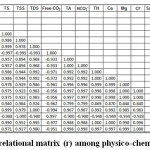
Temperature influences all the variables in the lentic ecosystem directly or indirectly. Here, temperature is positively correlated with all the variables except DO, free CO2 and NO32-. The inverse relationship between DO and temperature is well documented in the literature of.40,41 A significant positive correlation was computed between DO, free CO2 and NO32-, indicating all three parameters are interrelated with one another, influenced by their presence therein. Negative correlation between free CO2 and nitrate with all other hydro-chemical parameters is in agreement with the investigation of.42 Solid contents of the surface water were positively correlated with all other parameters except DO, free CO2 and NO32-. The obtained results from the correlation matrix are parallel with the findings of.43 Calcium and magnesium neutralizes the excess amount of acids present in the water body. This is justified by the high positive correlation in case of TH, and Ca-Mg hardness with alkalinity.44 The chloride content of water was positively correlated with almost all parameters except DO, free CO2 and NO32-. These findings matched the study of.25 Nutrients were significantly positively correlated with the all other variables except DO, Free CO2, which is in agreement with the findings of45 (Table 2).
Ionic Signatures
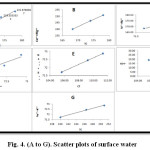
The hydro-chemical data for two of the sampling sites with respect to Ca+ and Mg+ ions (alkaline earth elements) / HCO3- lies on the equiline for 66% of the sampling points, suggesting that both alkalinity and alkalis concentration are balancing each other in congruent manner, while for 33% the ionic profile is lying above the equiline depicting excess of alkalinity is balancing alkalis (Fig A). The plotting of the ionic data of alkaline earth element to TC (Total Cations) shows that the chemical data for all the study sites lies exactly on the equiline emphasizing on the finding that increase in concentration of alkaline earth elements corresponds to simultaneous increase in the concentration of Total Cations (TC) (Fig B). This indicates a linear relationship between alkalis and cations indicating these ions to be leached from the minerals from the aquifiers. The relative abundance of chloride ion to SO42- is due to the enrichment of water. These ionic signatures from the chemical data refer more strongly to the dominance of Ca-HCO3 ions in the hydric regime (Fig. 4. A to G). The ionic signature of Na+:Ca2+ for all study sites is less than a unit indicating the concentration of the alkali earth elements is more than the akalis concentration.
Index of Base Exchange (IBE) was further stipulated to study the compositional changes of surface water.46 The negative value of IBE i.e. IBE I (Cl--Na++K+: Cl) and IBE II (Cl--Na++K+: HCO3-) support the enrichment of Na+ in water profile owing to prolific clay horizons. The excess amount of Na+ ions over K+ ions is due to the greater resistance of K+ ions to weathering and its absorption to clay minerals.21 The hydrological regime is dominated by Ca and HCO3-, an indication that the composition is controlled by mineral components leached from the rocks of the drainage basins.47
 |
|
Table 3: One Way Analysis of Variance (ANOVA) for different sampling points
|
Sampling Point |
F |
P-value |
F crit |
|
V1 |
0.463 |
0.925 |
1.831 |
|
V2 |
0.557 |
0.862 |
1.831 |
|
V3 |
0.516 |
0.892 |
1.831 |
One Way Analysis Of Variance (ANOVA)
One way Analysis of Variance (ANOVA) among all the studied variables (physico-chemical parameters) of water at all three sampling points indicates that all three study sites differed significantly in context of their nutrient concentration of freshwater wetland. Moreover, ANOVA interpretation for the dataset indicates that nutrient content was maximum at Site 2 (F = 0.557, p = 0.862), moderate at Site 3 (F = 0.516, p = 0.892), and the least at Site 1 (F = 0.463, p = 0.925) (Table 3).
Principal Component Analysis (PCA)
 |
|
 |
|
Table 4: Principal component matrix of physico-chemical data
|
Principal Components |
|||
|
Parameters |
I |
II |
III |
|
Temperature |
0.634 |
0.190 |
0.733 |
|
pH |
0.558 |
0.152 |
0.797 |
|
DO |
-0.850 |
0.408 |
-0.273 |
|
TS |
0.329 |
-0.662 |
0.656 |
|
TSS |
-0.101 |
-0.974 |
-0.144 |
|
TDS |
0.455 |
0.129 |
0.855 |
|
Free CO2 |
-0.833 |
-0.081 |
-0.161 |
|
TA |
0.799 |
-0.191 |
0.542 |
|
HCO3- |
0.799 |
-0.191 |
0.542 |
|
TH |
0.374 |
0.017 |
0.917 |
|
Ca |
0.333 |
-0.004 |
0.931 |
|
Mg |
0.784 |
0.257 |
0.551 |
|
Cl |
0.780 |
0.062 |
0.486 |
|
Sa |
0.780 |
0.062 |
0.486 |
|
SO42- |
0.791 |
0.025 |
0.555 |
|
PO42- |
0.367 |
0.025 |
0.924 |
|
NO32- |
-0.935 |
0.003 |
-0.217 |
|
Na |
0.184 |
-0.258 |
0.854 |
|
K |
0.657 |
-0.158 |
0.697 |
|
%age of variance explained by component |
74.444 |
9.841 |
9.077 |
|
Cumulative %age of variance |
74.444 |
84.286 |
93.363 |
Table 5: Component wise loadings of dataset
|
Component Wise Loadings |
||||||
|
Chemical Variables |
First Component |
Second Component |
Third Component |
|||
|
Positive |
Negative |
Positive |
Negative |
Positive |
Negative |
|
|
Temperature |
- |
- |
Low |
- |
Moderate |
- |
|
pH |
Moderate |
- |
Low |
- |
High |
- |
|
DO |
- |
High |
Low |
- |
- |
Low |
|
TS |
Low |
- |
- |
Moderate |
Moderate |
- |
|
TSS |
- |
Low |
- |
High |
- |
Low |
|
TDS |
Low |
- |
Low |
- |
High |
- |
|
Free CO2 |
- |
High |
- |
Low |
- |
Low |
|
TA |
High |
- |
- |
Low |
Moderate |
- |
|
HCO3- |
High |
- |
- |
Low |
Moderate |
- |
|
TH |
Low |
- |
Low |
- |
High |
- |
|
Ca |
Low |
- |
- |
Low |
High |
- |
|
Mg |
High |
- |
Low |
- |
Moderate |
- |
|
Cl |
High |
- |
Low |
- |
Moderate |
- |
|
Sa |
High |
- |
Low |
- |
Moderate |
- |
|
SO42- |
High |
- |
Low |
- |
Moderate |
- |
|
PO42- |
Low |
- |
Low |
- |
High |
- |
|
NO32- |
- |
High |
Low |
- |
- |
Low |
|
Na |
- |
- |
- |
Low |
High |
- |
|
K |
Moderate |
- |
- |
Low |
Moderate |
- |
* >0.75: High loading, 0.5-0.75: Moderate loading, <0.5: Low loading [21]
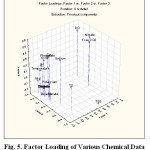
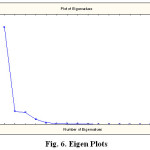
The Principal Component Analysis (PCA) for the surface water of GPH is shown in Tables 4 and 5. It includes the loadings of component matrix, Eigen-values for each component, percent, and cumulative percent of variance for each component. It depicts that the first three principal components together accounts for 93.35% of total variance in the dataset, of which first component is 74.44%, second component is 9.841% and third component is 9.077% of total variance. The concentration of TH, HCO32-, Mg, Cl, Salinity and K+ shows high positive loadings (0.780-0.799), whereas the concentration of TS, TDS, TH, Ca and PO42- have low positive loadings (0.184-0.455) and moderate positive loading pH (0.558) for the first component.
In the second component, temperature, pH, DO, TDS, TH, Mg, Cl, salinity, SO42, PO42- and NO32-showed low positive loadings (0.003-0.408). For the third component, pH, TDS, TH, Ca, PO42- and Na+ depicts high positive loadings (0.797-0.924), moderate loadings (0.486-0.656) was observed between temperature, TS, TA, HCO32-, Mg, Cl, Salinity, SO42- and K+. The high positive loading between TH, HCO32-, Mg, Cl, Salinity and K+ suggest that first component is related with various hydro-chemical processes. In this case, high positive loading between K+ and Cl- ions results in more weathering in the sampling area. The positive loading of K+ and Mg+ ions for the first component indicates weathering of Feldspar and Ferro-magnesium minerals along with anthropogenic sources [48][49]. The concentration of TH and HCO32- suggests that most of the hardness in the water is an ephemeral source. Moderate loading of TDS and NO32- in the surface water samples is the indication of man-made pollution due to domestic waste [50][51][52] (Fig. 5 and Fig. 6.; Table 4 and Table 5).
Conclusion
Water of GPH lentic ecosystem is dominated with Na-HCO3- ions. The scatter plots, ionic signatures and statistical analyses (Correlation Matrix, ANOVA, PCA) strongly indicates that the first component is mostly driven by high rate of weathering of Feldspar and Ferro-magnesium minerals, precarious anthropogenic sources (domestic wastes and rustic sewage) and immense ion exchange. Surface water of GPH can be categorized as hardness from temporary sources. Low SAR indicates that the water can be used for irrigation purpose too for revival of adjacent agricultural ecosystems for upliftment of livelihood patterns of indigenous inhabitants. The present study suggests that assemblage of significant physic-chemical variables determine and evaluate the status of water quality, which is an indication of inclined degree of pollution resultant from unrestrained sources of physical, chemical and biological pollutants sourced through anthropogenic sectors. Analysing the surface water quality is an obligatory propaganda for sustainable development and economy growth through managerial planning by implementing sectoral remedial measures to mitigate the adverse effects of poor water quality on human health as well as biotic community prevailed therein. Thus, a strong light should be thrown along with some strict and mandatory actions to conserve, manage and protect such natural assets to prolong the sacredness of a particular site. Management should also prohibit the access and use of such areas of regional importance by traditional communities. Conservation agencies, Government departments and local working groups (NGOs) should receive the support from local inhabitants to work in unison manners to challenge the threats affecting the cultural resources of such sacred natural wetlands.
Acknowledgements
The authors are thankful to Dr. C.L. Patel, Chairman, CVM, Gujarat, India, for providing necessary infrastructure, Dr. Nirmal Kumar, J.I., Director, ISTAR, for logistic facilities throughout the tenure of the research work, University Grants Commission (UGC), New Delhi, India, for providing financial support, and Gujarat Ecology Commission (GEC), Government of Gujarat (GoG) for its constant support at administrative level.
References
- Mahananda, M.R., Mohanty, B.P. and Behera, N.R. 2010. Physico-chemical analysis of surface and ground water of Bargarh District, Orissa, India. J. Res. Rev. Appl. Sci. 2 (3): 284-295.
- Cairns, K. Dickson. 1971. A simple method for biological assessment of the effect of waste discharges on the aquatic bottom dwelling organisms. Journal of Water Pollution Control Federation. pp. 775.
- Singh, S.K.A., Dakua, D. and Biswas, S.P. 2009. Physico-chemical parameters and fish enumeration of MaijanBeel (Wetland) of Upper Assam. Geobios. 36: 184-188.
- Singh, D.N. 2000. Seasonal variation of zooplanktons in a tropical lake. Geobios. 27: 100.
- Shastri, Y. and Pendse, D.S. 2001. Hydrobiological study of Dehikhuta reservoir. Journal of Environmental Biology. 22: 67-70.
- Islam, A.N., Choudry, A.N. and Zaman, M. 2001. Hydrobiological study of Dehikhuta reservoir. Journal of Environmental Biology. 22: 67-70.
- Sayeswara, H.A., Patil, R.H.S. and Mahesh, G.A. 2010. Studies on physico-chemical parameters of Purle pond water of Shivamogga, Karnataka (India). International Journal of Chemical Sciences. 8 (1): 582-588.
- Soni, H.B. and Thomas, S. 2013a. Preliminary assessment of surface water quality of tropical pilgrimage wetland of Central Gujarat, India. International Journal of Environment. 2 (1): 202-223.
CrossRef - Soni, H.B. and Thomas, S. 2013b. Occurrence of zooplanktons at sacred palustrine habitat, Central Gujarat, India, with conservation and management strategies. International Journal of Environment. 3 (1): 111-121.
- Soni, H.B. and Thomas, S. 2013c. Preliminary observations on phytoplankton at sacred palustrine habitat, Central Gujarat, India. International Journal of Environment. 2 (1): 115-126.
CrossRef - Trivedi, R.K. and Goel, P.K. 1986. Chemical and Biological Methods for Water Pollution Studies. Environmental Publication, Karad, Maharashtra. 248 p.
- Maiti, S.K. 2003. Handbook of Methods in Environmental Studies. Vol. I. Water and Wastewater Analysis. ABD Publication, Jaipur (India). 307 pp.
- Gupta, P.K. 2004. Methods in Environmental Analysis: Water, Soil and Air. Agrobios Publishers, Jodhpur, Rajasthan. 443
- 2012. Standard Methods for the Examination of Water and Wastewater. 22nd Ed. American Public Health Association (APHA), American Water Works Association (AWWA) & Water Environment Federation (WEF), Washington D.C., U.S.A.
- Strickland, S.C. and Parsons, T.R. 1977. A Practical Handbook of Seawater Analysis. Bulletin of Fisheries Board of Canada, Ottawa. 328 p.
- Iyer, C.S., Sindhu, M., Kulkarni, S.G., Tambe, S.S., Kulkarni, B.D. 2003. Statistical analysis of the physico-chemical data on the coastal waters of Cochin. Journal of Environmental Monitoring. 5: 324–327.
CrossRef - Fetter, C.W. 1990. Applied Hydrogeology. CBS Publishers & Distributors, New Delhi, India. 592 p.
- Twort, A.C., Hoather, R.C. and Law, F.M. 1974. Water Supply. Edward Arnold Publishing Ltd., London: 245 p.
- USSL (United State Salinity Laboratory). 1955. Diagnosis and improvement of saline and alkali soils. U.S. Department of Agriculture Soils, US Department of Agriculture and Handbook No. 60. Washington D.C.
- Tabue Youmbi Jean Ghislain, Feumba Roger, Wethe Joseph, Ekodeck Georges Emmanuel, De Marsily Ghislain. 2012. Evaluation of groundwater suitability for domestic and irrigational purposes: A case study from Mingoa river basin, Yaounde, Cameroon. Journal of Water Resource and Protection. 4: 285-293.
CrossRef - Vikram, B., Dhruv, S.S. and Singh, A.K. 2010. Water quality of the Chhoti Gandak River using principal component analysis, Ganga Plain, India. Journal of Earth System Science. 119 (1): 117–127.
CrossRef - Bhuiyan, J.R. and Gupta, S. 2007. A comparative hydrobiological study of a few ponds of Barak valley, Assam and their role as sustainable water resources. Journal of Environmental Biology. 28: 799-802.
- Karne, A.V. and Kulkarni, P.D. 2009. Studies on physico-chemical characteristics of freshwater bodies in Khatav tehsil, Maharashtra. Journal of Nature Environment and Pollution Technology. 8: 247-251.
- Patra, A., Santra, K.B. and Manna, C.K. 2010. Limnological studies related to physico-chemical characteristics of water of Santragachi and Joypur Jheel, W.B., India. Our Nature. 8: 185- 203.
- Garg, R.K., Rao, R.J. and Saksena, D.N. 2009. Water quality and conservation management of Ramsagar reservoir, Datia, Madhya Pradesh. Journal of Environmental Biology. 30: 909-916.
- Kalita, B., Bhuyan, K.C., Kusre, D. and Dutta, D. 2006. Physico-chemical quality of Beel water in Morigaon district Assam. Journal of Ecobiology. 18: 17-21.
- Jayakumar, P., Jothivel, N., Thimmappa, A. and Paul, V.I. 2009. Physicochemical characterization of a lentic water body from Tamil Nadu with special reference to its pollution status. The Ecoscan. 3: 59-64.
- Mishra, A.K, Arya, M. and Mathur, R. 2010. Limnological study of Jadhav Sagar Lake, Shivpuri town, Madhya Pradesh, India. Nature Environment and Pollution Technology. 9: 819-822.
- Verma, M. and Prakash, B. 2009. Physico chemical characteristics of Khanpuralake, Ajmer, Rajasthan. Indian Journal of Environmental Sciences. 13:75-77.
- Singh, K.K., Sharma, B.M. and Usha, K.H. 2010. Ecology of Kharungpatlake, Thoubal, Manipur, India: Part-I Water quality status. The Ecoscan. 4: 241-245.
- Sakhre, V.B. and Joshi, P.K. 2002. Ecology of Palas-Nilegaon reservoir in Osmanabad district, Maharashtra. Journal of Aquatic Biology. 18: 17-22.
- Radhakrishnan, R., Dharmaraj, K. and Ranjitha, K.B.D. 2007. A comparative study on the physicochemical and bacterial analysis of drinking borewell and sewage water in three different places of Sivaski. Journal of Environmental Biology. 28: 105-108.
- Garg, S.S. 2003. Water quality of wells and borewells of 10 selected locations of Chitrakoot region. Indian Journal of Environmental Protection. 23: 966-974.
- Raghavendra and Hosmani, S.P. 2002. Hydrobiological study of Mandakally lake, a polluted waterbody at Mysore. Journal of Nature Environment and Pollution Technology. 1: 291-293.
- Sukhija, L. 2007. Seasonal variation in zooplankton population in relation to physico-chemical characteristics of water in Kayad Lake near Ajmer, Rajasthan. Journal of Nature Environment and Pollution Technology. 6: 299-302.
- Shelat, Y., Oza, B.F. and Pandit, B.R. 2005. Physico-chemical and bacteriological studies of surface water in Bhavnagar region. International Journal of Bioscience Reporter. 3: 266-269.
- Umavathi, S. and Logankumar. 2010. Physicochemical and nutrient analysis of Siganullur pond, Tamil Nadu (India). Pollution Research. 29: 223-229.
- Rajmohan, N., Elango, L., Ramchandran, S., and Natrajan, M. 2000. Major ion correlation in groundwater of Kancheepuram region, South India. Indian Journal of Environmental Health. 20: 188-193.
- Chandra, R., Nishadh, K.A. and Azeez, M.P.A. 2010. Monitoring water quality of Coimbatore wetlands, Tamil Nadu, India. Environmental Monitoring Assessment. 169: 671-676.
CrossRef - Patil, D. and Dongare, M. 2006. Seasonal variation in DO and BOD of some lentic water bodies of Kohlapur city (Maharashtra). Geobios. 33: 70-72.
- Laskar, H.S. and Gupta, S. 2009. Phytoplankton diversity and dynamics of Chatla floodplain lake, Barak Valley, Assam, North East India-A seasonal study. Journal of Environmental Biology. 30: 1007-1012.
- Patil, P.V., Kulkarni, M.Y., Kulkarni, A.N. and Walankikar, A.V. 2010. A note on some physicochemical characteristic of Vajarwadi reservoir, Beed. The Ecoscan. 4: 81-82.
- Soni, H.B. 2007. Environmental studies of two significant wetlands of Gujarat with particular reference to eutrophication and avifauna. Ph.D. Thesis, Sardar Patel University, Vallabh Vidyanagar, Gujarat. 343 p.
- Das, A.K. 2002. Phytoplankton primary production in some selected reservoirs of Andhra Pradesh. Geobios. 29: 52-57.
- Nirmal Kumar, J.I, Das, M. and Kumar, R.N. 2008. Temporal and spatial variations in hydrochemical properties of a sewage-fed wetland, Khodiyar, Gujarat, India. The Ecoscan. 2: 195- 201.
- Sastri, J.C.V. 1994. Ground water chemical quality in river basins, hydrogeochmical modelling. Lecture notes: Refresher course, School of Earth Science, Bharathidasan University, Tiruchirpalli, Tamil Nadu, India.
- Gibbs, R. J. 1970. Mechanisms controlling world water chemistry. Science. 170: 1088-l090.
- Zhang, J., Huang, W.W, Letolle, R. and Jusserand, C. 1995. Major element chemistry of the Huanghe (Yellow River), China – Weathering processes and chemical fluxes. Journal of Hydrology. 168: 173–203.
CrossRef - Satyanarayana, M. and Periakali, P. 2003. Geochemistry of ground water in ultrabasic peninsular gneissic rocks, Salem district, Tamil Nadu. Journal of Geological Society of 62: 63–73.
- Fischer, R.S. and Mullican, W.F. 1997. Hydrochemical evolution of sodium-sulfate and sodium-chloride ground water beneath the northern Chihuahuan Desert, Trans-Pecos, Texas, USA. Hydrogeology Journal. 5: 4–16.
CrossRef - Wang, Y. and LuoTma, Z. 2001. Geostatistical and geochemical analysis of surface water leakage into ground water on a regional scale: A case study in the Liulin karst system, northwestern China. Journal of Hydrology. 246: 223–234.
CrossRef - Soni, H. and Thomas, S. 2017. Wetland Monitoring: Trophodynamics, Metals and Modeling. Lambert Academic Publishing (LAP), Germany. 473 pp. (ISBN: 978-3-659-93726-2)


