Seasonal Variations in Biochemical Parameters of Plants and their Air Pollution Tolerance in Industrial Area of Himachal Pradesh
Kashish Walia
 and S.K Bhardwaj
*
and S.K Bhardwaj
*
http://dx.doi.org/10.12944/CWE.12.3.21
Copy the following to cite this article:
Walia K, Bhardwaj S. K. Seasonal Variations in Biochemical Parameters of Plants and their Air Pollution Tolerance in Industrial Area of Himachal Pradesh. Curr World Environ 2017;12(3). DOI:http://dx.doi.org/10.12944/CWE.12.3.21
Copy the following to cite this URL:
Walia K, Bhardwaj S. K. Seasonal Variations in Biochemical Parameters of Plants and their Air Pollution Tolerance in Industrial Area of Himachal Pradesh. Curr World Environ 2017;12(3). Available from: http://www.cwejournal.org/?p=1060
Download article (pdf) Citation Manager Publish History
Introduction
Air pollution is an inevitable harmful by product of rapid industrialization and urbanization and is responsible for variety of deleterious effects on both human and plant communities. Air quality has now become a major environmental concern since the beginning of industrialisation, resulting in a greater release of gaseous and particulate pollutants into the atmosphere1. In Asian countries including India the increasing urban population growth, industrial activities and automotive traffic have caused serious deteoriation of air quality and is considered the most dangerous, as its control is more complex than any other type of environmental problems and its amelioration is not feasible by physical and chemical methods2,3. However, plantation with suitable species have been considered as one of the best suitable abatement technique for its control. In plants the effects of poor air quality are often apparent on the leaves which are usually the most abundant and obvious primary receptors of large number of pollutants and provide an enormous area for impingement, absorption and accumulation of pollutants, thereby decreasing the pollutant level in the environment4.
Plants vary in their sensitivity and tolerance to various kinds of toxins and hence their characterization helps in using them as a bio-indicator for monitoring atmospheric pollution5. Consequently bio monitoring of plants is now being considered as an important tool to evaluate the impact of air pollution6. In order to adapt to deteriorating air quality viz. stresses plants undergo many physiological and biochemical changes before any visible change in their morphology. The ability of each plant species to absorb and adsorb pollutants on their foliar surface varies greatly and depends on several biochemical,physiological and morphological characteristics7. Based on these biochemical parameters such as ascorbic acid, chlorophyll, leaf extract pH and relative water content APTI is calculated to determine the tolerance and sensitivity of plants to air pollution and is effective in evaluating the effects and the ways to combat these effects8,9. Since industrialization and urbanization has now become the way of life in the economy and Himachal Pradesh is no exception. Therefore, present study was conducted to screen out the tolerant plants in the industrial region by evaluating their APTI so that suitable plants may be screened for taking up plantations in such regions to breath quality air.
Material and Methods
The study was conducted in major industrial area of Himachal Pradesh located at Baddi in the foothills of Shiwalik range. The industrial town lies on the border of Punjab and Harayana states. It is situated in south-western side of Solan district and is about 45 km west of Solan. A detailed survey was conducted in the industrial area of Baddi to study the distribution of industries and vegetation in the region. Keeping in view the distribution of industries in the region five distances from (0-100 m), (100-200 m), (200-400 m), (400-800m), ( > 800m) from the central location of the industrial cluster were selected. To compare the effect at different distances the site falling at > 800m was considered as control. At each distance the commonly occurring tree species namely Azadirachta indica, Dalbergia sissoo and Leucaene leucocephala were selected. In total there were 45 treatment combinations which were replicated four times i.e. at each distance four replications were taken in all the directions of industrial hub. Under each replication four trees were considered. The observations were recorded during three seasons summer (March-April), monsoon (July-August) and Winter (November-December) months respectively.
Sample collection and sample analysis
In order to maintain the uniformity mature plants growing at iso-ecological conditions were selected for the study. To assess the APTI fully matured leaves of selected species were collected in the morning hours. The collected leaf samples were transported to laboratory for further analysis in ice box and were analyzed using following standard procedures for various physiological and biochemical parameters namely ascorbic acid10, total chlorophyll content11, leaf extract pH12 and relative water content13
Ascorbic acid
To estimate leaf ascorbic acid content of selected plant species 10g of the sample was taken. The sample was homogenized in metaphosphoric acid (3%) and filtered. The volume of the filtrate was made to 100ml by metaphosphoric acid (3%). The aliquot measuring 10ml was taken and titrated against standardized dye to an end point of pink colour as per the standard procedure outlined by Association of Official Agricultural Chemists10.The ascorbic acid content was expressed in milligrams per grams (mg g-1.)

Total chlorophyll
For the estimation of total chlorophyll content of the leaves, 10mg of the leaf sample was homogenized with 7ml dimethyl sulphoxide and was kept in oven at a temperature of 60-65ºC for 30-35mins. The samples were filtered and volume was made to 25ml by dimethyl sulphoxide. The absorbance was measured at 663nm and 645nm in spectrophotometer and chlorophyll was estimated using the following equation given by Hiscox and Istaelstam11

Where;
V is volume of extract made
a is length of light path in cell (usually 1cm)
W is weight of sample
A645 is absorbance at 645nm
A663 is absorbance at 663nm
Leaf extract pH
Leaf extract pH of the sample was analyzed by the method suggested by Barrs and Weatherly12. Fresh leaf sample (10g) was homogenized using deionised water (50ml) and the supernatant obtained after centrifugation was collected for the determination of pH using a digital pH meter.
Relative water content
Relative water content of the samples was estimated using the method proposed by Singh13 and was computed by using following equation
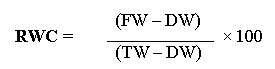
Where;
RWC is relative water content (%)
FW is fresh weight of leaf sample
DW is dry weight of leaf sample
TW is turgid weight of leaf sample
Air pollution tolerance index (APTI)
The Air pollution tolerance index based on leaf biochemical parameters was computed by using the following formulae given by Singh and Rao14.
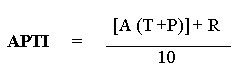
Where;
A is ascorbic acid (mg g-1) of leaf sample
T is total chlorophyll (mg g-1) of leaf sample
P is leaf extract pH of leaf sample
R is relative water content (%) of leaf sample
Statistical analysis
The results were analyzed using RBD factorial by OP stat software and the treatment means were compared by means of LSD.
Results and Discussion
After performing and analyzing all the bio-chemical parameters of plant leaves and resultant APTI, following results has been concluded and the average values of the data has been presented in tabular form.
Ascorbic acid content
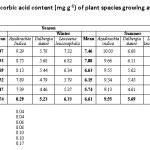
The plant species growing around industrial hub of Baddi found to exhibit significant variation in the leaf ascorbic acid content (Table 1).Significantly, highest ascorbic acid content of 8.42 mg g-1 was recorded in A.indica followed by L. leucocephala (6.58 mg g-1) whereas, lowest of 5.08 mg g-1 was noticed in D. sissoo. The ascorbic acid of this range in A. indica has also been reported by Trapathi et al.15. The higher ascorbic acid content in the leaves of A.indica as compared to other species may be probably due to its higher adaptive capacity to tolerate air pollution and other stresses. The increase in leaf ascorbic acid may also be due to improvement in the defense mechanism of the trees which has also been reported to vary with plants16. The results are in conformity with Cocklin17 and Aguiar-Silva et al.18 who advocated that higher ascorbic acid content of the plant is a sign of its tolerance against pollution. The concentration of leaf ascorbic acid content during different seasons varied from 5.74 - 7.73 mg g-1. Significantly, maximum ascorbic acid content of 7.73 mg g-1 was noticed in summers followed by winters (6.61 mg g-1) and rainy (5.74 mg g-1) season respectively. The higher production of ascorbic acid in the leaves of selected tree species might be due to relatively more stress conditions during summers followed by winters and rainy season. The, season wise variation in the ascorbic acid content is in agreement with the findings of Jyothi and Jaya19. The leaf ascorbic acid content of tree species growing at different distances ranged from 5.98 – 7.43 mg g -1 which decreased with the increase in distances from the central hub of the industrial area. Significantly, highest ascorbic acid content of 7.43 mg g-1 was noticed in trees growing at 0-100 m and the distance wise order of ascorbic acid content in trees was 0-100 > 100-200 > 200-400 > 400-800 > 800 m (control). The higher pollution near the industries in the Baddi area (0-100 m) might have hastened the ascorbic acid content of the leaves of the selected trees as a p art of the defence mechanism of the species against the stress caused due to pollution load. The results are in line with the findings of Bhattacharya et al.20 who have also recorded higher values of ascorbic acid in plant leaves at polluted sites. Pollution load dependent increase in ascorbic acid content of all the tree species may also be due to the increased rate of production of reactive oxygen species (ROS) during photo-oxidation of SO2 to SO3 where sulfites are generated from SO2 as noticed by Aghajanzadeh et al.21. The interaction between species x season and distance was also found to be statistically significantly, highest content of 10.05 mg g-1 was recorded in A. indica growing at a distance of 0-100 m during summer season which was followed by 9.66 and 9.55 mg g-1 content at the same distance and during same season whereas, minimum content of 3.89 mg g-1 was recorded in D. sissoo at the control site during rainy season.
Chlorophyll Content
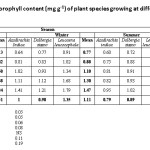
The leaf chlorophyll content of selected plant species growing around industrial hub of Himachal Pradesh exhibited significant variation. The highest leaf chlorophyll content of 1.59 mg g1 was recorded in L. leucocephala followed by D. sissoo (1.51 mg g-1) whereas, minimum (1.36 mg g-1) was noticed in A. indica. (Table 2).The results are in line with findings of Katiyar and Dubey22 and Ninave et al.23 Similarly, seasons of the year also exerted significant influence on leaf chlorophyll content of the trees growing in the industrial area. The highest chlorophyll content of 2.51 mg g-1 was recorded during rainy season followed by 1.11 mg g -1 content in winter and minimum (0.84 mg g -1) in summer season. Similar results were obtained by Jyothi and Jaya19 who also reported high chlorophyll content in plants during rainy followed by winter and summer seasons. The chlorophyll content was higher in rainy season which may be due to the washout of dust particles from the leaf surface, low level of pollution in the atmosphere and sufficient moisture in the soil. Low chlorophyll content in winter season may be due to the high pollution level, temperature stress, low sunlight intensity and short photoperiod. The trees growing at different locations from the industrial hub were found to differ significantly in their leaf chlorophyll content. The leaf chlorophyll content of trees growing at different distances from the industrial hub ranged from 1.20 -1.76 mg g -1 the leaf chlorophyll was found to increase with the increasing distance and the order was 0-100 < 100-200 < 200-400 < 400-800 < 800 m (control). The results are in line with Mir et al.24 and Tripathi and Gautam25 who also observed in their studies that high level of automobile pollution reduce chlorophyll pigmentation in leaves of plants near roadside. The present results are also in line with the observations of Wang and Lu26 and Karmakar et al.27.The three way interaction between species x season and distance had a statistically significant variation in leaf chlorophyll content the highest leaf chlorophyll content of 3.14 mg g-1 was recorded during rainy season in D. sissoo growing away from the industrial area, i.e., > 800m (control), whereas, minimum (0.60 mg g-1) was noticed during summer months in A. indica growing nearer to industry, i.e., at distance of 0-100 m. In all the species the leaf chlorophyll content tended to increase with the increase in distance from the industrial hub and from the stress period of summer and winter months to rainy season.
 |
|
 |
|
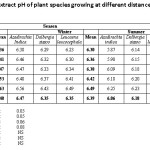
Leaf Exract pH
The significant variations in the leaf extract pH under study is presented in Table 3. The significantly highest leaf extract pH was found in A. indica (6.36) which was statistically at par with D. sissoo (6.32) and minimum (6.25) was recorded in L. leucocephala. The results are in line with Horaginamani et al.28 who reported same range of leaf extract pH in D. sissoo. Significantly, highest leaf extract pH of 6.48 irrespective of the species was noticed in rainy season whereas, lowest (6.06) was in summer season and the order was rainy > winter > summer. The higher pH of 6.48 in rainy season may be due to washing effect of rains to the acidic pollutants. Jyothi and Jaya19 also reported the maximum pH during monsoon season with gradual reduction through winter and minimum in summer. The leaf pH of selected tree species growing at different distances from the industrial hub ranged from 6.20 - 6.43. The trees growing at non polluted site (control) i.e., at a distance of more than 800 m exhibited significantly highest leaf pH (6.43) which was therefore, statistically at par with (6.32) and minimum leaf pH (6.20) was recorded at a distance of 0-100 m which was however statistically at par with the trees growing at 100-200 m distance from industrial hub.The pH increased with the increasing distance and the order was 0-100 < 100-200 < 200-400 < 400-800, which may be due to more pollution load near the industries which might have induced more acidity in the leaves of the trees. The results are in line with the finding of Singare and Talpade29 and Subramani and Devaanandan30 who reported that pH followed an exponential decrease with increase in the traffic pollution and drifted towards acidic range. The interaction between species x season and distance with respect to leaf extract pH was found statistically non significant.
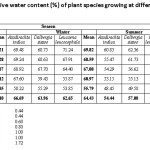
Leaf Relative Water Content
The relative water content of the selected tree species growing in and around the industrial area of Baddi varied significantly (Table 4). In species relative water content ranged from 65.69-67.63 %. The highest relative water of 67.63% was recorded in D. sissoo followed by A. indica (66.66 per cent) whereas, lowest of 65.69% was found in L. leucocephala. These results are similar to those of Nwadinigwe31 who reported that relative water content is due to the difference among plant species. The maximum relative water content of D. sissoo may be attributed to its tolerant nature towards pollution. These results are in conformity with findings of Gholami et al.32 who reported that transpiration rates are frequently high under polluted conditions therefore, maintenance of relative water content by the plant may determine its relative tolerance to pollution. Likewise, seasons also exerted a significant influence on leaf relative water content of the selected trees. The maximum relative water content of 80.10 per cent was recorded during rainy season followed by winter (64.43 per cent) and minimum of 55.45 per cent was recorded in summer season. The trend was in line with the results reported by Jyothi and Jaya19 who also observed highest relative water content in monsoon season followed by winter and rainy season. Significant variations were found in the relative water content of the leaves of trees growing at different distances in the industrial area. The leaf relative water content of plant species growing at different distances was found to decrease with the increase in distances from the central hub of the industrial area and was in the order of 0-100 > 100-200 > 200-400 > 400-800 > control. The higher relative water content near the industrial hub (0-100 m) may be ascribed to higher pollution load which might have resulted in increased water content in the leaves to maintain protoplasmic permeability under stress conditions. This is in agreement with the findings of Jyothi and Jaya19 who reported that the plants which have ability to adapt by enhancing leaf relative water content under polluted conditions. Similar results have also been reported by Tanee et al.33 who pointed out that plants at polluted site absorbed more water, which could be a physiological mechanism of the plants to withstand the effect of pollution in its environment. The study concluded that during rainy season D. sissoo growing at 0-100 m distance contained relative water content to the tune of 86.05 per cent which was significantly higher as compared to other treatment combinations. The interaction between species x season and distance showed minimum relative water content of 48.45 per cent in A. indica during summer season at non polluted site (control) which was however, found to be statistically at par with D. sissoo and A. indica growing at control site and at 400-800 m distance during summer season.
 |
|
 |
|
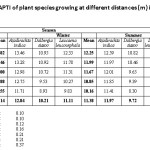
Air Pollution Tolerance Index (APTI)
Among the trees growing in and around industrial area A. indica irrespective of seasons and distances registered the highest APTI value of 13.08 followed by L. leucocephal (11.61) and D .sissoo (10.68). The highest APTI of A. indica (13.08) indicated its higher tolerance level to air pollution (Table 5). Singh and Rao14 reported that trees which have higher index value are tolerant to air pollution and can be used as sink to control pollution, while trees with low index value show less tolerance and can be used to indicate levels of air pollution.
Similar results are also reported by Gholami et al.32 and Lohe et al.34 that APTI is a species dependent plant attribute which expresses the inherent ability of plants to encounter stress arising from pollution. The variation in tolerance to the trees of a region to air pollutant has also been reported by Karthiyayini et al35, Agbaire and Esiefarienrhe36, Begum and Harikrishna37. The Seasonal variations of the APTI of selected plants were also found to be significant. The maximum APTI value of 13.14 was recorded during rainy season followed by winter (11.38) and summer (10.86) season. The trees species growing at various distances from the industrial hub of Baddi also exhibited significant variations in their APTI values. The tree growing at 0-100 m distance found to have maximum APTI value of 12.58. Whereas, those growing at a control site (> 800 m) registered minimum value of 10.91.The results are in line with the findings of Randhi and Reddy38 who revealed that tree species in the polluted environment improve their capacity to survive and become tolerant to air pollution. Relatively less APTI value of plants growing away from industrial hub and at control site may be ascribed to less level of industrial pollution.The interaction between species x season and distance was found to be statistically significant, out of the three selected species A. indica growing within 0-100 m distance registered highest APTI value of 14.98 during rainy season. On the other hand minimum APTI value of 8.30 was noticed in case of D.sissoo growing at the control site (> 800 m) during summer season.
 |
|
Conclusion
The plants growing near the industrial region developed tolerance to air pollution by adjusting their biochemical parameters as compared to those growing at farther distances. Relatively A.indica emerged as tolerant species among the selected species and therefore should be recommended for developing green belt in the industrial region of Himachal Pradesh.
Acknowledgment
The authors acknowledge the Department of Environmental Sciences, Dr. Y.S Parmar UHF, Nauni, Solan for providing necessary facilities and sincere gratitude is expressed to Dean College of forestry for providing financial support to conduct the study.
References
- Bhatnakar A D, Rao P S, Gaghate D G and Nema P. Inventory of SO2 and toxic emissions from industrial sources in Greater Mumbai, India. Atmospheric Environment. 39: 3851-3864 (2005)
CrossRef - Anonymous. Annual report. World Bank (2009)
- Kulkarni S D and Ingawale A. Biomonitoring of air pollution in by correlating the pollution tolerance of some commonly grown trees in Waluj Industrial area near Aurangabad, India. International Journal of Research in Environmental Science and Technology 4(4): 102-106 (2014)
- Escobedo F J, Wagner J E and Nowak D J. Analyzing the cost effectiveness of Santiago, Chile’s policy of using urban forest to improve air quality. Journal of Environmental Management 86: 148-157 (2008)
CrossRef - Rao D N. Sulphur dioxide pollution versus plant injury with special reference to fumigation and precipitation, in Proceedings of the Symposium on Air Pollution Control. Indian Association for Air Pollution Control, New Delhi. India. 1:91-96 (1983)
- Bakiyaraj R and Ayyappan D. Air pollution tolerance index of some terrestrial plants around an industrial area. International Journal of Modern Research and Reviews 2(1): 1-7 (2014)
- Seyyednejad S M, Majdian K, Koochak H and Niknejad M. Air pollution tolerance indices of some plants around industrial zone in south of Iran. Asian Journal of Biological Sciences 4: 300-305 (2011)
CrossRef - Chauhan A and Joshi P C. Effect of ambient air pollutants on wheat and mustard crops growing in the vicinity of urban and industrial areas. NewYork Science journal 3(2): 52-58 (2010)
- Ogunkunle C O, Suleiman L B, Oyedeji S, Awotoye O O and Fatoba P O. Assessing the air pollution tolerance index and anticipated performance index of some tree species for biomonitoring environmental health. Agroforestry Systems 89: 447-454 (2015)
CrossRef - A.O.A.C. Official methods of analysis of the analytical chemist, 13th ed. (W. Horwitz, ed.). Association of Analytical Chemists 83: 617-623 (1980)
- Hiscox J D, Israelstam G F. A method for the extraction of chlorophyll from leaf tissue without maceration. Canadian Journal of Botany 57: 1332-1334 (1979)
CrossRef - Barrs H D and Weatherly P E. A re-examination of the relative turbidity technique for estimating water deficit in leaves. Australian Journal of Biological Sciences.15: 413-42 (1962)
CrossRef - Singh A. Practical Plant Physiology. Kalyari Publishers. New Delhi (1977)
- Singh S K and Rao D N. Evaluation of the plants for their tolerance to air pollution. Proceeding in: Symposium on Air Pollution control held at IIT, Delhi. pp. 218-224 (1983)
- Tripathi A, Mahima, Tiwari P B and Singh D. Assessment of air pollution tolerance index of some trees in Moradabad city, India. Journal of Environmental Biology 30(4): 545-550 (2009)
- Cheng F Y, Burkey K O, Robinson J M and Booker F L. Leaf extracellular Ascorbic in relation to O3 tolerance of two soybean cultivars. Environmental Pollution. 150: 355-362 (2007)
CrossRef - Conklin P L. Recent advances in the role and biosynthesis of ascorbic acid in plants. Plant, Cell & Environment. 24: 383-394 (2001)
CrossRef - Aguiar-Silva C, Brandao S E, Domingos M and Bulbovas P. Antioxidant responses of Atlantic Forest native tree species as indicators of increasing tolerance to oxidative stress when they are exposed to air pollutants and seasonal tropical climate. Ecological Indicators. 63: 154-164 (2016)
- Jyothi J S and Jaya D S. Evaluation of air pollution tolerance index of selected plant species along roadsides in Thiruvanthapuram, Kerala. Journal of Environment Biology 31: 379-386 (2010)
- Bhattacharya T, Fadadu B, Chakraborty S and Bhattacharya P. Heavy metal concentrations in street and leaf deposited dust in Anand City, India. Research Journal of Chemical Sciences 1(5): 61-66 (2012)
- Aghajanzadeh T, Hawkesford M J and De Kok L J. Atmospheric H2S and SO2 as sulfur sources for Brassica juncea and Brassica rapa: regulation of sulfur uptake and assimilation. Environmental and Experimental Botany. 124: 1-10 (2016)
- Katiyar V and Dubey P S. Sulphur dioxide sensitivity on two stage of leaf Development in a few tropical tree species. Indian Journal of Environment and Toxicology 11: 78-81 (2001)
- Ninave S Y, Chaudhari P R, Gajghate D G, Tarar J L and A D Foliar. Biochemical features of plants as indicators of air pollution. Bulletin of Environmental Contamination and Toxicology 67(1): 133-140 (2001)
- Mir Q A, Yazdani T, Kumar A, Narain K and Yunus M. Vehicular pollution and pigment content of certain avenue trees. Pollution Research 27: 59- 63 (2008)
- Tripathi A K and Guatam M. Biochemical parameters of plants as indicators of air pollution. Journal of Environmental Biology 28: 127-132 (2007)
- Wang X K. and W Z Lu. Seasonal variation of air pollution index: Hong Kong case study. Chemosphere 63: 1261-1272 (2006)
- Karmakar D, Malik N and Padh P K. Effects of industrial air pollution on biochemical parameters of Shorea robusta and Acacia auriculiformis. Research Journal of Recent Sciences 5(4): 29-33 (2016)
- Horaginamani Sirajuddin M, Ravichandran M and Kamdod Abdul Samad M. Air pollution tolerance of selected plant species considered for urban green belt development in Trichy. World Journal of Environmental Biosciences 1(1): 51-54 (2012)
- Singare P U and Talpade M S. Physiological responses of some plant species as a bio-indicator of roadside automobile pollution stress using the air pollution tolerance index approach. International Journal of Plant Research 3(2): 9-16 (2013)
- Subramani S and Devaanandan S. Application of air pollution tolerance index in assessing the air quality. International Journal of Pharmacy and Pharmaceutical Sciences 7(7): 216-221 (2015)
- Nwadinigwe A O. Air pollution tolerance indices of some plants around Ama industrial complex in Enugu State, Nigeria. African Journal of Biotechnology 13(11): 1231-1236 (2014)
- Gholami A, Mojiri A and Amini H.. Investigation of the air pollution tolerance index using some plant species in Avhaz region. Journal of Animal and Plant Sciences 26(2): 475-480 (2016)
- Tanee F B G , Albert E and Amadi B R. Biochemical properties and Air pollution tolerance indices of plants in Port Harcourt city, Nigeria British Journal of Applied Science and Technology 4(34): 4835-4845 (2014)
CrossRef - Lohe R N, Tyagi B, Singh V, Tyagi P K, Khanna D R and Bhutiani R. A comparative study for pollution tolerance index of some terrestrial plant species. Global Journal of Environmental Science and Management 1(4): 315-324 (2015)
- Karthiyayini R, Ponnammal N R, and Joseph R. Air pollution tolerance index of certain plants of Coimbatore - Ooty highways, near Industrial Training Institute area, Coimbatore, Tamil Nadu. Pollution Research 24(2): 363-365 (2005)
- Agbaire P O. Air pollution tolerance indices (APTI) of some plants around Erhoike-Kokori oil exploration site of Delta State, Nigeria. International Journal of Physical Sciences 4(6): 366-368 (2009)
- Begum A and Harikrishna S. Evaluation of some tree Species to absorb air pollutants in three industrial locations of South Bengaluru, India. European Journal of Chemistry 7(1): 151-156 (2010)
CrossRef - Randhi U D and Reddy M A. Evaluation of tolerant plant species in urban Environment: A case study from Hyderabad, India. Universal Journal of Environmental Research and Technology. 2(4): 300-304 (2012)


