Aquifer Characterization A Scientific Imperative in Analysis of Water Level Trend – A Case Study from Northern Punjab, India
Gopal Krishan 1
*
 , M.S. Rao 1
, R.P. Singh 1
, R.P.S. Chopra 2
and K.S. Takshi 1
, M.S. Rao 1
, R.P. Singh 1
, R.P.S. Chopra 2
and K.S. Takshi 1
http://dx.doi.org/10.12944/CWE.13.1.09
Groundwater balance helps assessment of groundwater sustainability at the current rate of its use. The estimate is specific to the area and time reference of its estimation. Dynamic groundwater head which relates to the change in storage is an important parameter in the resource estimation. In case, the observation boreholes tap aquifers different from the getting abstracted, the estimated results may deviate drastically from its true value. Multiple aquifer system exists in the northern part of district Amritsar, Punjab, India for which the water level trends of representative well hydrographs in the region for the period January 2006 to December 2013, show moderate sustainability. Taking the case of Amritsar district of Punjab, it has been shown in the present study that if the aquifer details are not considered appropriately, the moderately sustainable groundwater system can get assessed as over-exploited aquifers. In the study, groundwater quality for irrigation needs is also been examined.
Copy the following to cite this article:
Krishan G, Rao M. S, Singh R. P, Chopra R. P. S, Takshi K. S. Aquifer Characterization A Scientific Imperative in Analysis of Water Level Trend – A Case Study from Northern Punjab, India. Curr World Environ 2018;13(1). DOI:http://dx.doi.org/10.12944/CWE.13.1.09
Copy the following to cite this URL:
Krishan G, Rao M. S, Singh R. P, Chopra R. P. S, Takshi K. S. Aquifer Characterization A Scientific Imperative in Analysis of Water Level Trend – A Case Study from Northern Punjab, India. Curr World Environ 2018;13(1). Available from: http://www.cwejournal.org/?p=1051
Download article (pdf) Citation Manager Publish History
Introduction
Indo-Gangetic alluvial plains encompass thick piles of sediments characterized by regionally extensive and highly productive multi-aquifer system. Extensive groundwater withdrawal over a depth up to few hundred meters constituting the top 2-3 aquifers, mainly for irrigation means, is taking place all across this multi-aquifer system. The groundwater authority of Government of India is constantly monitoring the situation of dynamic state of these aquifers and periodically releasing the groundwater estimation reports in which depending upon draft with respect to the recharge and the resultant declining groundwater levels of these aquifers, these aquifers are marked as safe, semi-critical, critical and over-exploited aquifers.1-3 The objective for groundwater balancing and marking these aquifers is to maintain the dynamic groundwater resource at safe and sustainable condition and to implement appropriate management or regulatory measures if they become critical or over exploited.
Groundwater resources estimation helps in planning, development, management and allocation of the available water resources. Groundwater is a dynamic resource and it should be appropriately addressed with the period for which it has been estimated. In the groundwater resource estimation, groundwater balancing specific to the aquifer or group of aquifers should be considered as these aquifers can have varied groundwater productivity and hydro-geological diversity. Central Groundwater Board (CGWB), Government of India conducts regularly the Groundwater Survey and estimates groundwater resource of the country. According to a report by CGWB4 in the year 2011, 245 billion cubic meter (BCM) of groundwater got abstracted of which 91% got used for irrigation and the remaining 9% got withdrawn for domestic and industrial purposes. The progressive increase in the use of groundwater in agriculture is causing depletion of this precious resource and is manifested in the decline of water levels in different parts of India and more strikingly in the state Punjab, India.In Punjab, most of the studies on declining trends of groundwater levels and its quality were conducted in north-east and south-east parts of Punjab5-30 but no such study except that by CGWB4 got conducted in the northwest parts of Punjab. The groundwater report published by CGWB31 for the District Amritsar which is located in the north-west part of Punjab draws a special attention on the groundwater categorization of this District. According to this report, entire Amritsar district falls in the category of ‘over-exploited’. This makes categorically clear that the total annual groundwater draft in the district exceeded the annual replenished groundwater for the year (2009) of assessment and that there is a significant decline in long term water levels in the region. It envisages that dynamic part of the groundwater resource is completely exhausted and additional extraction is taking place from deeper part of the aquifer that contains older groundwater reserve. In the present study, the finding of CGWB that the district groundwater is over-exploited has been verified by taking groundwater level data of Punjab Water Resource & Environment Directorate (PWRED) for a period of 8 years (January, 2006 to December, 2013). The PWRED owns its own wells which are separate from CGWB wells. A striking difference is observed when these two data sets are analyzed and compared. The incoherency between the two data sets is interpreted as being due to observations arising from different hydrogeological conditions owing to multiple aquifer system of the region.
Study Area
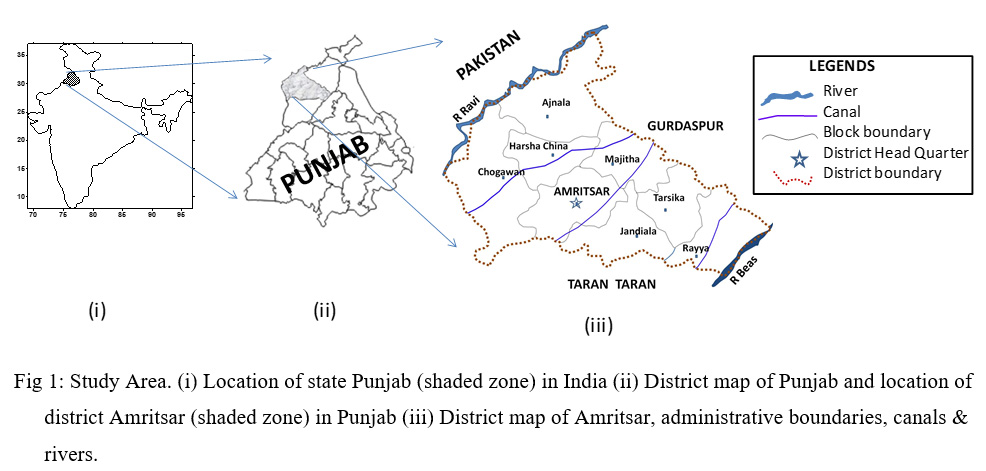
The study area is an interfluve region of the rivers Ravi & Beas and is a part of the district Amritsar. The area is fairly plain and has a general gentle slope towards south-west. The district covers an area of 2677km2 and lies between the latitudes of 31028’49”N & 32003’26”N and longitudes of 74029’06”E & 75024’24”E. The district is bordered by the river Ravi in the west which also forms the international boundary between India and Pakistan. On its south-east, the district is bordered by the river Beas (Fig.1). The canal network forming from the Upper Bari Doab canal, its branches (Lahore, Kasur and Sobraon) and other minors of these branches is providing irrigation support to 90% of the district area. Agriculture is the main occupation and hence agrarian economy prevails. As per the reports,32-34 the cropping intensity, in the area, is 194% which is significantly higher than the national average of 136%. Farmers grow water intensive crops like paddy and sugarcane along with maize and wheat. They practice flow irrigation which usually has low water use efficiency. The climate of the region is semi-moist and moist type characterized by hot summers and cold winter. The mean maximum temperature (for the month of June) and the mean minimum temperature (for the month of December) for the past century (period 1900-2000) are 39.80C and 4.30C respectively. The district receives 680 mm of rainfall annually of which, 75% comes from SW monsoon and 25% mainly from western climate disturbances which occurs during the non-monsoon months. The rainfall in the district increases along southwest to northeast direction.5 Administratively, the district is divided into eight blocks namely; Ajanala, Majitha, Tarsika, Rayya, Harsha Chinna, Chogawan, Verka and Jandiala Guru. Out of these eight blocks, the four blocks Ajanala, Majitha, Tarsika and Rayya were considered in the present study.
Hydrogeology
The area comes under the Indo-Gangetic basin. The basin typology is detailed by Bonsor et al.35 Geologically, the study area is represented by the alluvium of Quaternary age of thickness exceeding 450m below ground level.5 The alluvium is comprised of fine to coarse grained sand, silt, clay and clay with kankar (calcareous nodules). Thin clay beds occur alternately with thick sand beds. The clay beds pinch out at short distances against the sand beds. Gravel associated with sand occurs along the flood plains. Abandoned flood plains marked by oxbow lakes or swamps are present parallel to the river in a belt of 10-15 km wide and are at few feet higher elevation than the active flood plains. The exploratory wells drilled down to depth of 450m at several locations in the district have shown 5-6 granular zones separated by clay beds. Thick and high yielding aquifers exist at depths 30m and 120m below ground surface.36 The thick alluvial formations with alternate permeable and impermeable beds form multiple aquifer system. Aquifers below the depth of 60m below ground level (bgl) are in semi-confined to confined conditions. The storativity and transmissivity of the aquifers explored out from depth 302m to 450 m bgl are 0.00264 and 1790 m2/day, respectively.5 Major fraction of the abstracted groundwater is getting used for irrigation using a few tens of thousands of tubewells and accounts for 97.10 % of the total (Table 1). The groundwater withdrawal for irrigation needs for the year 2006 was 2157.24 m3.
Table 1: Details of water resources in Amritsar (Source: Agriculture Census 2011)37
|
Handpump |
Tubewell/ borehole |
Spring |
River/ canal |
Tank/ Pond/ Lake |
Other sources |
|
125548 (48.12%) |
127669 (48.94%) |
99 (0.04%) |
255 (0.10%) |
176 (0.07%) |
7144 (2.74%) |
The depth and discharge of the tubewells at Ajanala, Majitha, Tarsika and Rayya blocks range from 30m to 105 meters below ground level (m bgl) and from 10m3/hr to 20m3/hr, respectively. The depth and discharge of the tubewells in Majitha block range from 80 to 210 m bgl and from 20 to 40m3/hr, respectively (CGWB, 2007)5.
Material and Methods
Piezometers and lithologs
Four representative piezometers, each having a depth of 60m, were constructed in the northern part of Amritsar district by Punjab Water Resources and Environment Directorate (PWRED), Chandigarh. These piezometers are located at block head quarters Ajanala (G.E.S., Dhariwal-B), Majitha (Civil Veterinary Hospital), Tarsika (Veterinary Hospital, Bhoewal) and Rayya (Veterinary Hospital, Rayya) (Fig. 1). Lithologs were prepared from the borehole details which were converted into piezometers (Figs. 2a-d). To prepare lithologs, drill cuttings were collected during the drilling of piezometers at regular interval of one meter or during change in the lithology. The samples were properly washed, dried and examined physically. Since the major aquifer properties and sedimentology is same as per (Bonsor et al, 2017),35 so the 4 number of lithologs are sufficient to represent the whole area.
Depth to Water Level
Monthly monitoring of water level of these piezometers were carried out over a period of 8 years from January 2006 to December 2013 and analyzed for their temporal variation. The plots of Depth to Water level (DTW) versus time graph, commonly known as hydrograph, were analyzed for the observed piezometers for the period January 2006 to December 2013 is shown in the figures 3 & 4. The dynamic groundwater resource is a function of change in groundwater head with time. CGWB, New Delhi has assessed the groundwater resources as on March, 2008 by taking block as a unit.
|
|
Figure 1: Study Area. (i) Location of state Punjab (shaded zone) in India (ii) District map of Punjab and location of district Amritsar (shaded zone) in Punjab (iii) District map of Amritsar, administrative boundaries, canals & rivers. |
Water quality
For chemical analysis, one time groundwater samples were collected after developing the piezometer till the water became silt free. Water samples were collected in the pre-washed polyethylene bottles. At the time of sampling, bottles were thoroughly rinsed two to three times with groundwater to be sampled. The sampling bottles were carefully filled just to overflowing and ensuring no air bubble is trapped inside the sample bottles. The samples collected were analyzed for their EC, pH, calcium, magnesium, sodium, potassium, carbonate, bicarbonate, chloride and sulphate. The ionic concentrations were determined using volumetric methods except for sodium and potassium which were determined with the help of Flame Photometer in the laboratory of PWRED, Chandigarh. The observed ionic concentrations in the water samples in the units of mg/l and milli equivalent per liter are detailed in the Table 2.The potability of groundwater for drinking purpose has been assessed using the BIS guidelines (IS: 10500:2012).38 Groundwater is classified using Piper Trilinear Diagram (Piper, 1944)39 and is shown in Fig. 5. The suitability of groundwater for irrigation purpose has been studied on the basis of percent soluble sodium and sodium adsorption ratio (SAR).
Results and Discussion
The litholog of the bore holes located at Ajanala, Majitha, Tarsika and Rayya are shown in Figs. 2a-d, respectively. The lithologs reveals that the coarse sand dominates the subsurface formation. Virtually, up to the depth of 60m there is only one aquifer wherein groundwater occurs under phreatic conditions. The average coarse sand content in these lithologs shows highest coarse sand content in the central zone of the district (95% at Majitha) and it decreases on either sides on moving towards the rivers Ravi and Beas (86% at Ajnala and 87% at Tariska). Also, the clay content and number of clay layers increases from north to south and towards the rivers especially towards the river Beas. The increase in clay lenses is expected to attenuate horizontal & vertical flow of groundwater. For example, at Majitha there is only one clay layer in the 60 m of stratum and the average clay content is 5% whereas, at Rayya which is located close to the river Beas, the number of clay layers are 4 and the average clay content is 30%.
|
|
Figure 2: Lithologs (a) Ajanala (b) Majitha (c) Tarsika (d) Rayya |
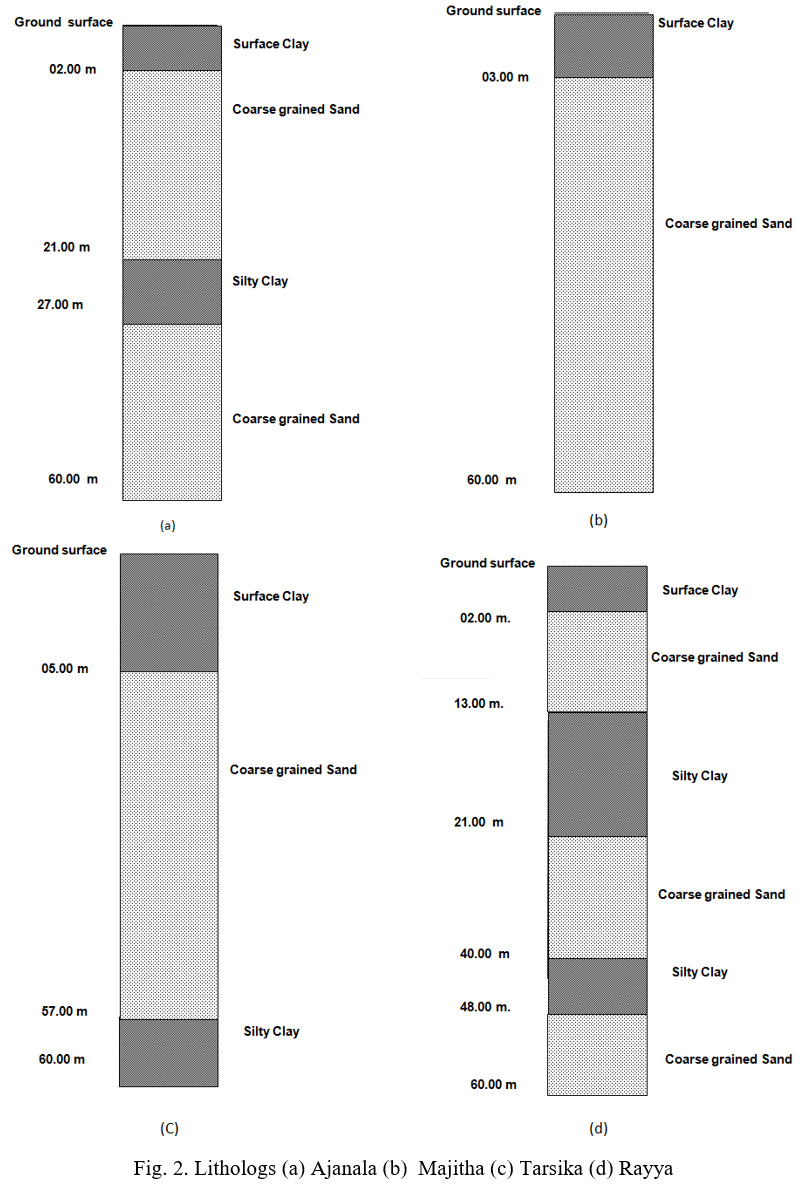
The clay lenses at Rayya are also expected to reduce window width for interaction between river water and groundwater (fig 2-d). The surface clay layer also inhibits vertical flow of river flood water to get recharged. The central region of the study area is more homogeneous whereas, increase of clay lances on either sides of the central zone is reducing this homogeneity and affecting the flow. The central zone aquifer is a single thick aquifer (fig 2-b) occupied by canal network on the surface.
|
|
Figure 3: Yearly (a) and Month wise (b) Groundwater level (meters below ground level- mbgl) in Amritsar, Punjab |
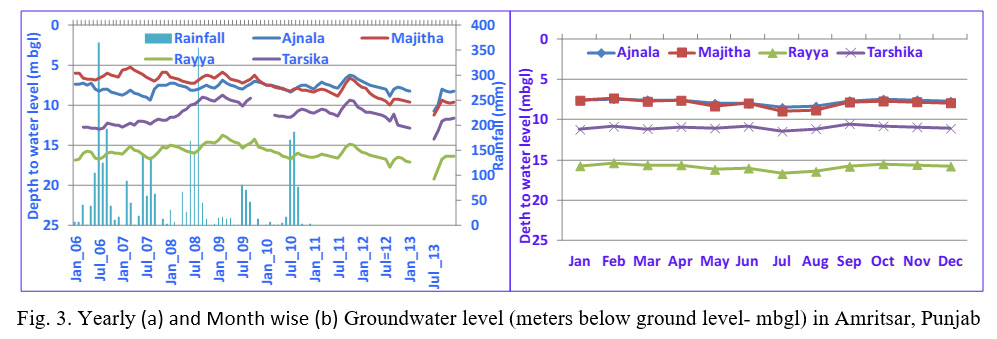
Seasonal variation in groundwater levels and its comparison with the rainfall pattern at Ajanala, Majitha, Tarsika and Rayya for the period 2006-2013 is shown in the Figs. 3 & 4. Seasonal variation of groundwater levels from January 2006 to December 2013 in general, shows declining trend of groundwater between the periods June to August which rapidly gets recouped by the end of September due to recharge from the monsoon rains. The declining period coincides with the Kahrif period indicating maximum water abstraction during this period for the Kharif crops.The trend of DTW and rainfall when inter-compared (fig 3), shows a positive correlation with a phase lag of 2-3 months at both the locations Majitha and Tarsika. The DTW is shallow near Ravi river and deepens on moving towards Beas river. At the observed wells, DTW increase in the order Ajnala (7m) < Majitha (8m) < Tarsika (12m) < Rayya (17m). The average DTW which is 17m at Rayya is intermediate between 1st aquifer (depth 2-13 m) and 2nd aquifer (depth 21-40 m). This indicates that the shallow aquifer is dried up and the high hydrostatic pressure of 2nd aquifer has resulted into rise of DTW by 4m above the top level (21 m) of the 2nd aquifer. Poor recharge from the surface sources (flood water or rain water) due to presence of 2m thick clayey surface layer and the continuous groundwater abstraction has left the 1st aquifer at Rayya (depth 2-13 m) dry and non-productive. The high hydraulic groundwater pressure in the 2nd aquifer in this block (depth 21-40 m) is arising from the horizontal inflow from highland areas of northern region which is getting blocked by the presence of clay lenses at Rayya. This is also evident from groundwater contours and topographic slope of this region. The surface clay layer and the topographic slope are causing surface run-off to pass getting discharged into the river Beas without getting infiltration and adding to groundwater at Rayya. This is also evidenced from the fact that the river Beas is gaining at this zone. Due to poor recharge conditions; groundwater is less sustainable in this block. During the period April 2007 to Jan 2009, DTW at sites Tarsika and Rayya reduced by 6m and 2m, respectively. But, no significant change in DTW during this period is seen at Ajnala and Majitha. Groundwater levels in the Ajanala block are shallow, declining at much slower rate than at Rayya and are less affected to change in rainfall pattern. This is probably due to interaction between river Ravi and groundwater of nearby area of this block. The interaction is better in the western part compared to that at eastern part due to thicker aquifer and less clayey content of this region. Therefore, groundwater is observed declining at higher rate near Rayya than at Ajnala. In-fact, eastern blocks were frequently getting flooded before the construction of Ranjit Sagar Dam on the river Ravi. Recharge of flood water and recharge from the perennial river Ravi and its canal were the sources of water to groundwater of this region supporting for any depletion. As a result, groundwater remained constant or less depleted in the western blocks Ajanala and Majitha. In recent years, with the development of embankment on the Ravi river or shift in river course,40 the recharge component through flooding events got reduced which is probably resulting in appearance of minor depletion in DTW at Majitha since 2009. These features suggest that the river Ravi and rainfall occurring at northern highlands are the recharge sources of the region and that the recharged groundwater is flowing in NE-SW direction. During the period Jan 2010 to July 2013, drop in DTW by 4 to 5 meters is seen in most of the sites. An interesting observation seen in all the sites is reversal of this falling groundwater trend in July 2013. This event coincides with the major cloud burst event that took place at Kedarnath on 16th June, 2013. This event caused major floods in north India. It is probably that groundwater in major part of north India including that in the present study region got recouped during this period which appeared as recouped peak in the falling groundwater trend.
|
|
Figure 4: Pre & post monsoon variations in Groundwater level (meters below ground level - mbgl) in Amritsar, Punjab (2006-13) |
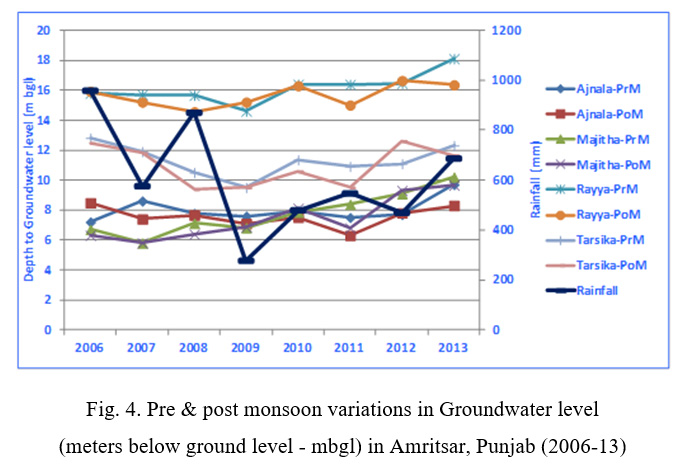
As given in the Table 1, there are over 97% of the handpumps/tubewells in the study area (Agriculture Census 2011).37 These wells are tapping aquifer at different depths up to 450 m. On the basis of its observation well data, CGWB (CGWB, 2011)3 marked the entire district in Over Exploited Zone (OEZ), meaning, groundwater draft exceeding the recharge in all the blocks of this district. Under the present context, it is important to critically examine this categorization of OEZ. Although marked as OEZ, major part of the study area falls in the DTW zone 5m to 10m (Pre-monsoon, 2007). The southern part of Ajanala block and northern parts of Tarsika and Rayya block fall in the DTW zone 10m to 20m. CGWB estimated that groundwater draft at Ajanala is 86% higher than the annual recharge and at Rayya the draft is 61% higher than the annual recharge. Meaning, groundwater at Ajanala is depleting 25% faster than that at Rayya. On the contrary, aquifers of Ajanala are more productive (higher transmissivity and storativity) and the water table is shallow & more stable compared to that at Rayya. It is thought provoking even though the aquifers are productive and the groundwater levels did not show decadal scale decline the CGWB has categorized all the blocks as over-exploited. The factual position is that the draft at these places is grossly getting replenished from the monsoon rains, river Ravi and its canal network.
CGWB is estimating the groundwater resource using Ground Water Estimation Methodology, 1997 (GEC 1997)41 which is based on the equation of continuity. It’s a very well researched methodology and has been evolved on the basis of well understood and accepted principles of groundwater hydraulics. At the same time the monitored water levels cannot be erroneous. These are two different exercises aim at knowing the status of ground regime and groundwater resource potential about the same area with its own authenticity.The GEC41 is a well founded way to estimate the groundwater resource for a given time reference. The recharge available from all sources and the draft for all uses are its two main input and output, respectively. The mathematically obtained results will be very close to the field situations if the inputs in the continuity equations are correct. Besides the input to the equation the most important aspect is the aquifer characterization. If the aquifer for which resources are being estimated and the inputs; draft or recharge or the aquifer parameters is not in conformity then the results would be far from the real field situation and bound to be erroneous beyond measures. In case, if the aquifers are characterized and aquifer wise piezometers are installed then the results would be axiomatically correct. But such an ideal arrangement, of well distributed aquifer wise piezometers, is seldom available. Practically, water level data gets collected from privately owned groundwater structures for which it is not known to which aquifer these data pertain. Moreover, on the day of observation if pumping is taking place from a nearby well then its effect of draw down may appear as low DTW in the observation well. In the study area multi-aquifer system exist up to the explored depth of 450m. Phreatic groundwater conditions exist up to a depth of 60m, beyond which, the groundwater conditions are semi-confined and confined. The depth of the tubewells in the Majitha block ranges from 80m to 210 m bgl whereas, the depth of tubewells in Ajnala, Tarsika and Rayya blocks ranges from 35 to 105 m bgl).5 It is evident that some of these tubewells intersect unconfined aquifers and some to confined aquifers. Owing to different hydrostatic pressures, groundwater at different depths can have different flow velocities and groundwater age. Accordingly, for the same amount of groundwater withdrawal the change in DTW in different aquifers can be different even if the wells are located at same place. This concept of groundwater age is not considered in the GEC, 1997.41 The aquifer parameters and governing differential equations of unconfined aquifers are different from that for confined aquifers. The GEC41 has the provision of estimating the groundwater resources of regionally expanded unconfined aquifers and not for the confined aquifers. It is quite possible that the mixed inputs have been used in the groundwater resources estimation. Otherwise, such an expostulation of monitored levels is scientifically inexplicable. The findings of both of the exercises will match if the input data and the aquifer are the same. Therefore, it becomes imperative to characterize the aquifers before the resources are estimated.
GEC41 although rigorously makes assessment of stage of groundwater development based on long term field based data however it still requires accounting of 3 important parameters to consider. (i) Since groundwater in deeper aquifer is not of recent origin but old, its formation corresponds to recharge from rain (at the recharge area and not at the point of withdrawal) averaged over the period equal to the age of groundwater at its withdrawal location. In GEC,41 the recharge from rainfall is accounted from annual rainfall data for the year of recharge estimation (no consideration of integration over groundwater age and calculating the average from it) and for the rainfall at the location of withdrawal/observation point (and not at the location of its recharge area). It may also be noted that as the groundwater depletes the wells are sunk to deeper depths and this changes the state of deeper groundwater to more dynamic state and lowering of its age.42 These conditions further complicate the groundwater estimation procedures. (ii) In case of groundwater getting recharged from nearby stream (say, river Ravi or its canal network in the present study), the lowering of groundwater level may accelerate recharge from these streams resulting in pseudo appearance of constant groundwater level. Many a times, like in the present case, the stage of the river/canal is maintained by the control at the river-head works. In such cases, excessive pumping induces accelerated inflow to sub-surface without any appreciable fall in surface water source levels and as well the DTW remains constant without showing much depletion. The GEC41 uses a seepage constant (depending upon type of soil & whether the canal is lines or unlined) multiplied by the wetted area but does not consider the withdrawal induced accelerated seepage. The quantity of induced inflow appears as over-exploitation component in the results. (iii) In the absence of detail soil cover data, GEC,41 assumes 22% as rainfall infiltration factor for the alluvial plains of Indo-Gangetic region. However, it is seen in the present study that surface soil cover varies in the region both in the clay content and the thickness of the layer. Due to the factors mentioned from (i) to (iii) the GEC41 may give erroneous values at micro-scale details but may provide a good estimate when sub-basin or basin scale area is considered.
The values of the observed parameters pH, EC, Na+, K+, Ca++, Mg++, Cl-, HCO3-, SO4- - and the estimated residual sodium carbonate (RSC), soluble sodium percentage (Na%) and sodium absorption ratio (SAR) in the groundwater at Ajanala, Majitha, Tarsika and Rayya is summarized in the Table 2. A comparison of the constituents of groundwater with the standards given in the guidelines of the Bureau of Indian Standards (IS:10500, 2012)38 shows that all the constituents are within permissible limits for drinking purpose.
In the groundwater quality, sodium plays an important role in moisture accessibility to crops as excess of it causes an increase in the soil hardness and reduction in its permeability. High concentration of sodium causes soil mineral particles to disperse and less water to infiltrate.43 The soluble sodium percentage (Na%) is calculated using the equation:
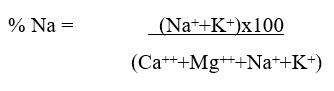
Where, Na+, Ca++, and Mg++ represent concentrations expressed in milli-equivalents per liter for each constituent. The Na % in groundwater indicates that 2 samples fall in excellent and 2 samples fall in good category. Thus, the groundwater in these blocks is suitable for irrigation.
Adsorption of sodium on clay by its exchange with Mg++ and Ca++ ions takes place when sodium is high. This results in poor permeability and drainage of soil, leading to restricted air and water circulation in it and thus makes it hard.44-46 Sodium Adsorption Ratio (SAR) is used to measure the alkali/sodium hazard to crops. The excessive SAR inhibits the supply of water needed for the crops. The excess sodium or limited calcium and magnesium are evaluated by SAR.47 The SAR is calculated as: The SAR values for the samples are within the permissible range indicating suitability of groundwater for irrigation needs.
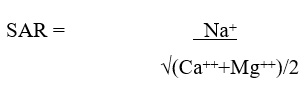
Table 2: Results of Chemical Analysis
|
Block |
Depth (m) |
pH |
EC (µS/cm) |
TDS (mg/l) |
Ionic concentration [(mg/L) /(meq/L)] |
RSC (meq/L) |
Na (%) |
SAR |
|||||||
|
Cations |
Anions |
||||||||||||||
|
Ca++ |
Mg++ |
Na+ |
K+ |
CO--3 |
HCO-3 |
Cl- |
SO--4 |
||||||||
|
Ajanala |
56.5 |
7.66 |
575 |
370 |
57.7 (2.88) |
15.56 (1.28) |
34.7 (1.51) |
5.48 (0.14) |
Nil |
280.66 (4.60) |
7.09 (0.20) |
45.15 (0.94) |
0.44 |
28.40 |
1.04 |
|
Majitha |
57.0 |
7.08 |
345 |
220 |
14.4 (0.72) |
18.96 (1.56) |
23.9 (1.04) |
5.08 (0.13) |
Nil |
158.63 (2.60) |
14.18 (0.40) |
18.25 (0.38) |
0.32 |
33.91 |
0.98 |
|
Tarsika |
54.0 |
7.87 |
410 |
260 |
40.9 (2.04) |
15.56 (1.28) |
15.2 (0.66) |
4.30 (0.11) |
Nil |
195.24 (3.20) |
21.27 (0.60) |
12.01 (0.25) |
-0.12 |
18.83 |
0.51 |
|
Rayya |
56.5 |
7.98 |
420 |
270 |
51.3 (2.56) |
15.07 (1.24) |
7.13 (0.31) |
5.87 (0.15) |
Nil |
219.65 (3.60) |
14.18 (0.40) |
16.33 (0.34) |
-0.20 |
10.80 |
0.22 |
EC= Electrical conductivity; TDS=Total Dissolved Solids; RSC=Residual Sodium Carbonate; SAR=Sodium Adsorption Ratio; Na%= Soluble sodium percentage; values in parentheses are in meq/L.
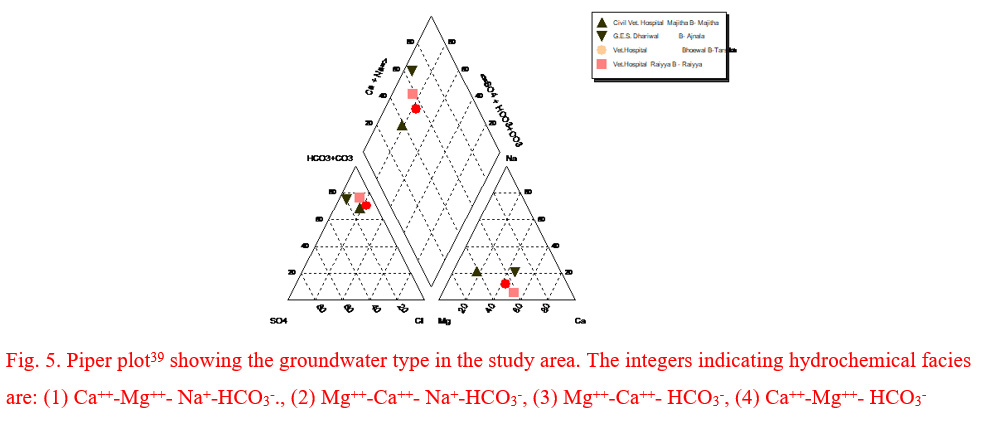
Hydrochemical facies of groundwater has been classified using Piper Trilinear Diagram39. All the plotted points appeared in the field -1 of the Trilinear Diagram (Fig. 5) indicating alkaline earth exceeding the alkalis, weak acids exceeding the strong acids and the water type as Ca++-Mg++-HCO3-.
|
|
Figure 5: Piper plot39 showing the groundwater type in the study area. The integers indicating hydrochemical facies are: (1) Ca++-Mg++- Na+-HCO3-., (2) Mg++-Ca++- Na+-HCO3-, (3) Mg++-Ca++- HCO3-, (4) Ca++-Mg++- HCO3 |
Conclusion
The study area shows multiple aquifer-system. The phreatic groundwater conditions prevail up to a depth of 60m bgl, below which semi-confined and confined conditions are there. The monthly monitored water levels, over a period of eight years (2006 to 2013), show sustainability of groundwater resource in major part of the region due to replenishment of water levels by monsoon precipitation, streams and canals. On the contrary, CGWB classified the entire study area as over-exploited indicating draft exceeding the recharge which is leading to long term decline in groundwater levels. This may be due to several reasons (i) CGWB estimates the dynamic groundwater resource using data from shallow aquifers whereas; withdrawal is taking place from multiple aquifers, (ii) in the absence of detail soil data, CGWB assumes a constant infiltration factor whereas, this assumption is not valid at least in the present case as the surface soil conditions are not uniform (iii) recharge zones and recharge sources of deeper aquifers are not same as that of unconfined shallow aquifer. (iv) excess withdrawal induced accelerated inflow to aquifers from nearby surface water sources which has been not accounted in the GEC41 groundwater estimate where the calculation is based on constant recharge from wetted surface water regions.
In areas of multi-aquifer system, with high surface soil variability and in the presence of multiple surface water sources the groundwater estimation using the existing norms may greatly deviate from the actual results. However, groundwater estimated using GEC41 may provide realistic values if the estimate is conducted on basin/sub-basin scale region and integrated over sufficient time scale exceeding the groundwater age of the region. On the contrary to the CGWB estimate, the present analysis suggests that the phreatic aquifers can smoothly sustain the pumpage of the existing groundwater structures. So far, no estimates are available on how much groundwater out of the total groundwater reserve in the region which is distributed at all the depths till bed-rock, got reduced. If the net depletion is a negligible fraction of the total groundwater reserve then the use of the words like over exploitation of groundwater or depleting groundwater resource requires to be modified. The groundwater quality is good and it is suitable for sprinkler irrigation. The farmers should be motivated to replace the flow irrigation method by the sprinkler irrigation method to save about 40% of groundwater. Due to presence of surface clay layer and substantially thick aquifer below this layer, artificial recharge of groundwater in the region can be done by well-recharge methods and not by surface flooding technique. Water intensive crops are unsuitable in the south east zone. Overall, the groundwater quality is suitable for the irrigation.
Acknowledgments
Authors thank Director, National Institute of Hydrology (NIH), Roorkee and Dr. N.C. Ghosh, Scientist ‘G’ and Head, Groundwater Hydrology Division, NIH, Roorkee for their support, guidance and encouragement. The funding received from Purpose Driven Studies under HP-II at PWRED, Chandigarh and BGS-DFID to GK during 2014-15 is duly acknowledged.
References
-
CGWB. Ground Water Resource of India. Ministry of Water Resources , Govt. of India, Faridabad. 1995.
-
CGWB. Dynamic Ground Water Resources of India (As on March, 2004). Ministry of Water Resources, Govt. of India. www.cgwb.gov.in /documents/DGWR2004.pdf. 2006.
-
CGWB (2011) Dynamic Ground Water Resources of India (As on March, 2009). Ministry of Water Resources, Govt. of India. www.cgwb.gov.in/documents/Dynamic GW Resources -2009.pdf
-
CGWB (2014) Groundwater Scenario in India. Ministry of Water Resources, Govt. of India. http://www.cgwb.gov.in/GroundWater/GW%20LEVEL%20SCENARIO_January%202014.pdf
-
CGWB, Central Ground Water Board (2007) Ground water scenario of Amritsar District, Punjab. Central Ground Water Board North Western Region, Chandigarh, 2007.
-
CGWB, Central Ground Water Board (2008) Groundwater Information Booklet Gurdaspur District Punjab. Central Ground Water Board, North Western Region, Chandigarh, 2008.
-
Chopra RPS, Krishan G. Analysis of aquifer characteristics and groundwater quality in southwest Punjab, India. J Earth Sci Engineer 4(10): 597-604. http://doi: 10.17265/2159-581X/2014. 10. 001. 2014.
-
Chopra RPS, Krishan G. Assessment of groundwater quality in Punjab. J Earth Sci Climate Change. 2014;5(10):243. http://dx.doi.org/10.4172/2157-7617.1000243
-
Lapworth D. J., Krishan G., MacDonald A. M., Rao M. S. Groundwater quality in the alluvial aquifer system of northwest India: new evidence of the extent of anthropogenic and geogenic contamination. Science of the Total Environment. 2017;599–600:1433–1444
-
Lapworth Dan., Macdonald A. M., Taylor R. G., Burgess., Willy, Kazi, Ahmed, Krishan, Gopal, Mukherjee, Abhijit, Zahid, Anwar. 2016. Hydrogeological responses to intense groundwater pumping in the Indo-Gangetic Basin – evidence from environmental tracers. IAH International Congress “Groundwater and Society” Montpellier, France, 25-29 September. 2016;175.
-
Lapworth D. J., MacDonald A. M., Krishan G., Rao M. S., Gooddy D. C., Darling W. G. Groundwater recharge and age-depth profiles of intensively exploited groundwater resources in northwest India. Geophys. Res. Lett. 2015;42(18):7554-7562.
-
Lapworth D. J., Krishan G., Rao M. S., MacDonald A. Intensive Groundwater exploitation in the Punjab – an evaluation of resource and quality trends. Technical Report. NERC Open Research Archive, BGS-UK. Project report Groundwater Science programme, BGS, UK. 2014.
-
Lohani A. K., Krishan G. Groundwater level simulation using artificial neural network in southeast, Punjab, India. J Geol. Geosciens. 2015a;4(3):206. http://dx.doi.org/10.4172/2329-6755.1000206
-
Lohani A. K., Krishan G. Application of artificial neural network for groundwater level simulation in Amritsar and Gurdaspur districts of Punjab, India. J Earth Science Clim Change. 2015b;6:274. http://dx.doi.org/10.4172/2157-7617.1000274
-
Krishan G., Chopra RPS. Assessment of water logging in south western (SW) parts of Punjab, India-a case study from Muktsar district. NDC-WWC J . 2015;4(1):7-10.
-
Krishan G., Rao M. S., Kumar C. P., Semwal P. Identifying salinization using isotopes and ionchemistry in semi-arid region of Punjab, India. J Geol Geosci 2013;2:4. http://dx.doi.org/10.4172/jgg.1000129
-
Krishan G., Rao M. S., Loyal R. S., Lohani A. K., Tuli N. K., Takshi K. S., Kumar C. P., Semwal P., Kumar S. Groundwater level analyses of Punjab-a quantitative approach. Octa J Environ Res. 2014;2(3):221-226.
-
Krishan G., Lapworth D. J., Rao M. S., Kumar C. P., Smilovic M., Semwal P. Natural (baseline) groundwater quality in the Bist-Doab catchment, Punjab, India: a pilot study comparing shallow and deep aquifers. Int J Earth Sc Engg. 2014;7:16--26
-
Krishan G., Lohani A. K., Rao M. S., Kumar C. P. Prioritization of groundwater monitoring sites using cross-correlation analysis. NDC-WWC J. 2014;3(1):28-31.
-
Krishan G., Rao M. S., Purushotaman P., Yawat Y. S., Kumar C. P., Gupta S., Bhatia A. K., Marwah S., Kaushik Y. B., Angurala M. P., Singh G. P. Groundwater resources in Bist-Doab region, Punjab, India-an overview. NDC-WWC J. 2014;3(2):5-13.
-
Krishan G., Chandniha S., Lohani A. K. Rainfall trend analysis of Punjab, India using statistical non-parametric test. Curr World Environ. 2015;10(3)
-
Krishan G., Saini R., Tuli N. K., Kaur G. Assessment of groundwater quality in Baddi catchment, Solan, Himachal Pradesh, India. IWRA (India) Journal. 2015;4(2):25-30.
-
Krishan G., Lohani A. K., Rao M. S., Kumar S., Takshi K S. Spatiotemporal Variability Analysis of Groundwater Level for Water Resources Development and Management in Northern Punjab, India. J Environ Anal Toxicol. 2015;5(4):279. http://dx.doi.org/10.4172/2161-0525.1000279
-
MacDonald AM et al. Groundwater Resources in the Indo-Gangetic basin- Resilience to climate change and abstraction. British Geological Survey Open Report, OR/15/047. 2015;63.
-
MacDonald AM et al. Groundwater depletion and quality in the Indoâ€Gangetic Basin mapped from in situ observations. Nature Geosciences. 2016;9:762-766.
-
Rao M. S., Purushothaman P., Krishan G., Rawat Y. S., Kumar C. P. Hydrochemical and isotopic investigation of groundwater regime in Jalandhar and Kapurthala districts, Punjab, India. Int J Earth Sc Engg. 2014;7(01):06-15.
-
Rao M. S., Krishan Gopal., Kumar C. P., Purushotmanan P., Kumar Sudhir. Observing changes in groundwater resource using hydro-chemical and isotopic parameters: a case study from Bist Doab, Punjab. Environmental Earth Science. 2017;76:175. DOI: 10.1007/s12665-017-6492-1
-
Rodell M., Velicogna I., Famiglietti J. S. Satellite-based estimates of groundwater depletion in India. Nature. 2009;460:999-1003
-
Sidhu R. S., Vatta K., Dhaliwal H. S. Conservation agriculture in Punjab – economic implications of technologies and practices. Ind J Agric Econ. 2010;65:413–427.
-
Singh K. Groundwater depletion in Punjab: measurement and countering strategies. Ind J Agric Econ. 2011;66:583–589.
-
CGWB. http://cgwb.gov.in/District_Profile/Punjab/Amritsar.pdf accessed on. 2009.
-
ICAR. http://agricoop.nic.in/Agriculture%20Contingency%20Plan/Punjab/PUNJAB%201-Amritsar%2030.04.2011.pdf Assessed on 10-03-2015. 2011.
-
GoI. State of Agriculture 2015-16, Directorate of Economic & Statistics, Government of India. 2015-16.
-
ESO. Statistical Abstract, Punjab, Economic Advisor to Government of India. 2015.
-
Bonsor HC et al. Hydrogeological typologies of the Indo-Gangetic basin alluvial aquifer, South Asia. Hydrogeology Journal. 2017. DOI: 10.1007/s10040-017-1550-z
-
Mahajan G. Groundwater Surveys and Investigations A P H Publ. Corp., New Delhi. 2009.
-
AgricultureCensus. http://www.censusindia.gov.in/2011census/dchb/0315_PART_B_DCHB%20_AMRITSAR.pdf. 2011.
-
IS:10500. https://law.resource.org/pub/in/bis/S06/is.10500.2012.pdf Assessed on 10-03-2015. 2012.
-
Piper A. M. A graphic procedure in the geochemical interpretation of water analyses. Trans Am Geophys Union 25:914–928. 1944.
-
Thomas., Abraham., Sharma P. K. "The shift of ravi river and the geomorphological features along its course in amritsar and gurdaspur districts of punjab". Journal of the Indian Society of Remote Sensing. 1998;26:57. doi:10.1007/BF03007340.
-
GEC Groundwater Estimation Committee Report. 1997 http://cgwb.gov.in/documents/gec97.pdf assessed on date 10-03-2015
-
Krishan., Gopal. Groundwater recharge source in deep aquifer using isotopes in Punjab. National Institute of Hydrology, Roorkee. A report submitted to Department of Water Supply and Sanitation, Mohali, Punjab. 2017.
-
Jalali M. Salinization of groundwater in arid and semi-aridzones: an example from Tajarak, Western Iran. Environ Geol. 2007;52:1133-1149.
-
Collins R., Jenkins A. The impact of agriculture and land use on stream chemistry in the middle hills of the Himalayas, Nepal. J Hydrol. 1996;185:71-86.
-
Saleh A., Al-Ruwih F., Shehata M. Hydrogeochemical process operating within the main aquifers of Kuwait. J Arid Environ. 1999;42:195-209.
-
Tijani M. N. Hydrochemical assessment of groundwater in Moroarea, Kwara State, Nigeria. Environ Geol. 1994;24:194-202.
-
Karanth K. R. Ground water assessment, development and management. Tata McGraw Hill, New Delhi. 1987.


