Assessment of Bacterial Pollution in Sediment of Padma River, Rajshahi, Bangladesh
Md. Ayenuddin Haque1
 , Md. Abu Sayed Jewel1
*
, Abdulla Al Masud 1
, Md. Shahinur Rahman2
and Jakia Hasan 3
, Md. Abu Sayed Jewel1
*
, Abdulla Al Masud 1
, Md. Shahinur Rahman2
and Jakia Hasan 3
1
Department of Fisheries,
University of Rajshahi,
Rajshahi,
Bangladesh
2
Department of Fisheries,
Government Republic of Bangladesh,
Bangladesh
3
Bangladesh Fisheries Research Institute (BFRI),
Marine Fisheries Technology Station,
Cox’s Bazar,
Bangladesh
http://dx.doi.org/10.12944/CWE.13.1.07
Padma is one of the largest rivers of Bangladesh, which has huge potential for fishery resources. Microbial pollution status of this riverine ecosystem has not been evaluated yet. Therefore, the present study was conducted to find out the bacterial pollution in sediment of this river. Four distinctive study locations were evaluated for three respective seasons in 2016. Enumeration of total heterotrophic bacteria (THB), total coliform (TC), fecal coliform (FC) and Vibrio cholerae were done by standard plate count technique from surface layer of sediment samples. Results revealed that all the samples were contaminated with THB, TC, FC and Vibrio cholerae with a range of 20.60×10⁶±1.41 cfu/g (Site-2 Padma Garden) to 3.46×10⁶±0.47 cfu/g (Site-4 Talaimari), 140.00×10⁴±22.63 cfu/g (Site-2 Padma Garden) to 2.88×10⁴±0.97 cfu/g (Site-1 T-Dam), 5.98×10³±0.36 cfu/g (Site-2 Padma Garden) to 1.04×10³±0.08 (Site-4 Talaimari) and 3.85×10⁴±0.26 cfu/g (Site-3 I-Dam) to 0.91×10⁴±0.07 cfu/g (Site-4 Talaimari), respectively. The bacterial density data had seasonality showing very high density during summer and winter seasons and the lowest in monsoon season. During the study period, it was observed that Site-2 (Padma Garden) and Site-3 (I-Dam) was comparatively more polluted with bacteria then other two sites. As per the criteria of sediment quality evaluation, the sediment of Padma River can be categorized as moderate to moderately high polluted with total heterotrophic bacteria, while very little polluted with fecal coliform bacteria. Therefore, the present study suggests a regular monitoring and assessment for reducing the bacterial load into the Padma River ecosystem through appropriate measures.
Copy the following to cite this article:
Haque M. A, Jewel M. A. S, Al Masud A, Rahman M. S, Hasan J. Assessment of Bacterial Pollution in Sediment of Padma River, Rajshahi, Bangladesh. Curr World Environ 2018;13(1). DOI:http://dx.doi.org/10.12944/CWE.13.1.07
Copy the following to cite this URL:
Haque M. A, Jewel M. A. S, Al Masud A, Rahman M. S, Hasan J. Assessment of Bacterial Pollution in Sediment of Padma River, Rajshahi, Bangladesh. Curr World Environ 2018;13(1). Available from: http://www.cwejournal.org?p=1069/
Download article (pdf) Citation Manager Publish History
Introduction
Microbiological contamination of aquatic ecosystem is a major issue worldwide. Human and animal fecal material is generally considered as greater risk to human health, as it is more likely to contain human enteric pathogens. These pathogens may sometimes pose serious health-hazards to the environment and human population through water and sediment.1, 2
Padma is one of the largest and important rivers in Bangladesh, which flows adjacent to Rajshah city. Therefore, a huge amount of domestic and municipal sewage is regularly mixed with its water, which ultimately pollutes it. The domestic sewage contains fecal materials originated from human and other animals. These pollutants reduce the amount of oxygen in the water and adversely affect its biodiversity.3 The increased agricultural and industrial activates are now a threat to the biodiversity of Padma River due to the explosion of population growth. In such situation, evaluation of microbial pollution of this river is an urgent need of the hour. The large diversity of microorganisms in aquatic ecosystem sometimes makes it difficult to identify due to the absence of consistent and low-cost detection technique. For the convenience of identification of pathogenic bacteria, total coliforms and fecal coliforms bacterial indicators were used worldwide.4 Sometimes, survivability of Coliform bacteria in clean water for a limited time makes them a reliable indicator of organic pollution.5 Thus, for routine monitoring, Fecal Indicator Bacteria (FIB) such as total coliform and fecal coliform are usually used to evaluate the contamination level of water. Sediments of aquatic environments may sometimes constitute a reservoir for FIB. It is also known that FIB survives better in sediment than the surface water.6, 7 Together with FIB, assessments of Vibrio cholerae also bears immense potential, as it is pathogenic in nature and are frequently present in aquatic ecosystem. Therefore, the aim of the present study was to evaluate the variation of these indicators (total heterotrophic, total coliform and fecal coliform) and pathogenic bacteria (V. cholerae) in the surface sediment of Padma River to investigate the bacterial pollution of this river.
Materials and Methods
Selection of Study Area
The present study was conducted at four different study sites along the Padma River at T-Dam (Site-1), Padma Garden (Site-2), I-Dam (Site-3) and Talaimari (Site-4) covering most of the parts of Rajshshi City Corporation along the bank of the Padma River (Fig. 1). Geographical and topological characteristic of the study sites is shown in Table 1. Sampling was done in three consecutive seasons viz. summer, monsoon and winter in the year 2016.
Table 1: Sampling Sites, Sampling Code and Topological Characters of Study Sites
Sampling Station | Sampling Code | Coordinates | Topological Characters |
T-Dam | Site-1 | Latitude: N-24º21´42.41´´ Longitude: E-88º34´31.18´´ | Discharge of effluent from some household garbage, no human activities except recreational activities. |
Padma Garden | Site-2 | Latitude: N-24º21´42.30´´ Longitude: E-88º35´52.44´´ | Direct discharges of effluent from vegetable markets and slaughter discharges; discharge from household septic tanks, more human activities as recreational site. |
I-Dam | Site-3 | Latitude: N-24º21´34.95´´ Longitude: E-88º36´39.92´´ | Direct discharges of effluent from household septic tanks, more human activities as recreational site. |
Talaimari | Site-4 | Latitude: N-24º21´29.30´´ Longitude: E-88º37´30.55´´ | No human activities and no source of discharge into the river |
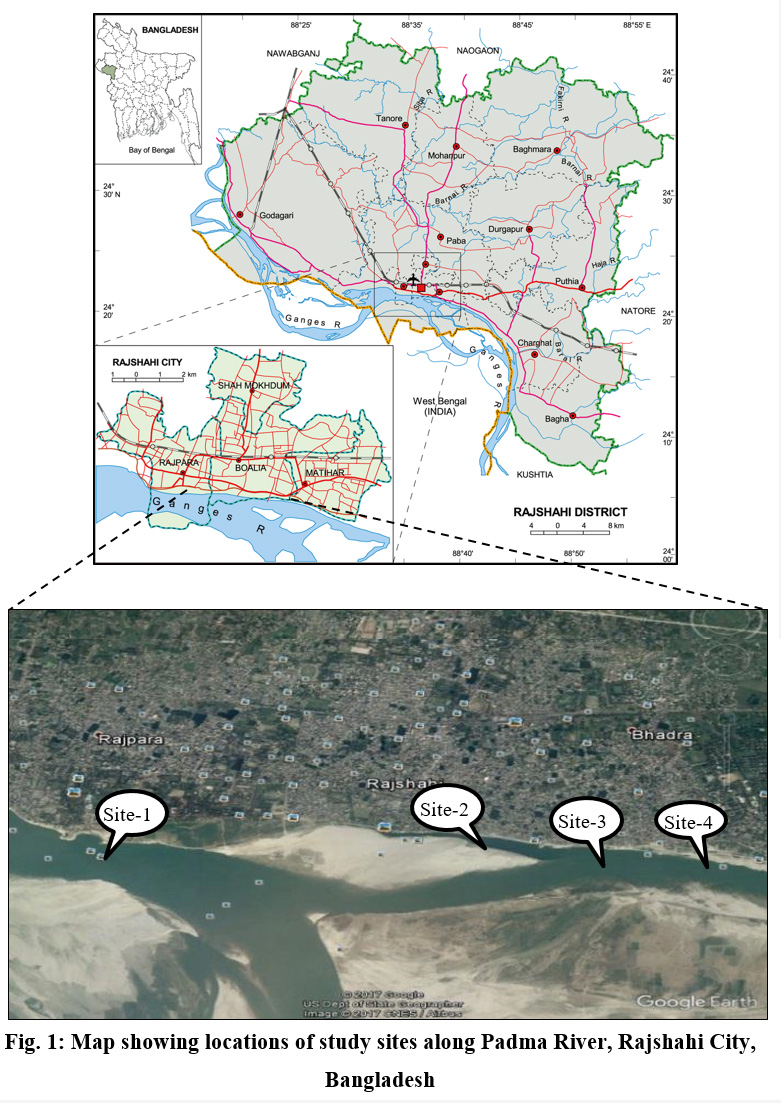 | Figure 1: Map showing locations of studysites along Padma River, Rajshahi City,Bangladesh Click here to view figure |
Bacteriological Analysis
For the bacteriological analysis, surface layer of sediment (upto a depth of 10 cm) was sampled from the respective sampling points. The samples were delivered to laboratory in an ice box containing melting ice as quick as possible i.e. the time gap between sampling and analyses was below 3 hrs. During each sampling period, a triplicate samples were collected and bacterial analysis was done from this triplicated samples and average value for each triplicates were recorded. A total of 12 samples were collected in each time and in all, a total of 36 samples were taken for the analysis in this study. Total variation for field sampling and laboratory analysis of bacteria samples were estimated by collecting replicates for approximately 20% of samples. Precision up to 25% relative standard deviation (RSD) log transformed was considered acceptable for all the four types of bacteria. Enumeration of Total Heterotrophic Bacteria (THB), Total Coliform (TC), Fecal Coliform (FC) and V. cholerae of sediment were done by Standard Plate Count (SPC) technique.8 For serial dilution of samples, 1 g sediment was weighed and transferred in a sterile test tube containing 9 ml of phosphate buffer solution. A vortex (Model iSwix VT) was used to shake the tube properly for homogenization of samples. The sample was diluted give 1:10 or 10-1 dilution. Each dilution (an amount of 0.1 ml) was then transferred into the petri dish containing the respective bacterial growth media. To avoid too high load of debris and sand particles on the plate, samples were centrifuged and let to settle for sometimes and then the aliquots of the supernatant were used for inoculation in media plates. Bubbles arising during plating of culture media were removed by lightly flaming the plate with bunsen burner. Incubation of the culture plates was done at 37 °C for 24-48 hrs and final counts of colonies were done by a digital colony counter (Model SC5). Results were recorded as colony forming unit (cfu/g). The specific culture media and their resulted colony colours used for quantitative count of bacteria are shown in Table 2.
Table 2: Culture Media and Colony Coloration for Quantitative Bacterial Analysis
Bacterial Type | Media | Incubation Period | Colony Coloration |
Total heterotrophic bacteria | Nutrient agar | 37â°C for 24-48 h. | Not specified. |
Total coliform | MacConkey agar | Pink | |
Fecal coliform | Eosine Methylene Blue (EMB) agar | Green metallic sheen | |
V. cholerae | Thiosulphate Citrate Bile Salts (TCBS) agar | Yellow |
Statistical Analysis
The data was analyzed using SPSS software (Version 20.0) and Microsoft Excel (Version 10). Correlation coefficient test (r) was used to determine the relationship between bacterial parameters separately. Correlation was considered significant at 0.01 levels (2-tailed).
Table 3: Correlation (r) Between Bacterial Parameters of Sediment of Padma River (N = 12).
| THB | TC | FC | VC |
THB | 1 |
|
|
|
TC | 0.978** | 1 |
|
|
FC | 0.951** | 0.951** | 1 |
|
VC | 0.959** | 0.939** | 0.974** | 1 |
Key: THB = Total heterotrophic bacteria; TC = Total coliform; FC = Fecal coliform and VC = V. cholerae; N = No. of samples; **. Correlation is significant at 0.01 level (2-tailed).
Results
The population of Total Heterotrophic Bacterial (THB) in sediment of the Padma River over the three seasons is presented in Fig. 2. THB count was highest at all the sampling sites during summer, followed by winter and monsoon seasons. THB count was also more uniform at all the sampling sites during monsoon season, where fluctuation was observed during other seasons (summer and winter). However, the maximum count of THB was noted at Site-2 (20.60×10⁶ ±1.41cfu/g) during summer and minimum count at Site-4 (3.46×10⁶ ±0.47cfu/g) during monsoon (Fig. 2).
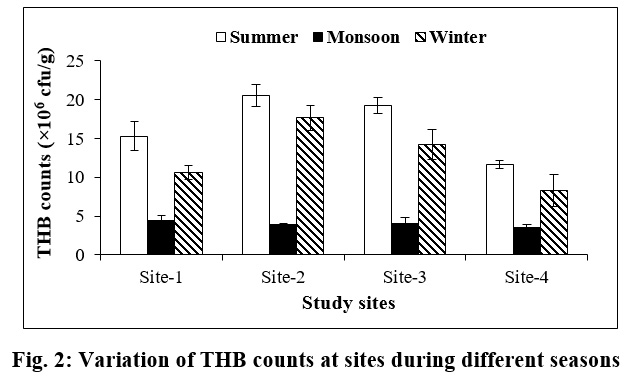 | Figure 2: Variation of THB counts at sites during different seasons Click here to view figure |
Total coliform (TC) count also showed peak population during summer season at all the study sites, followed by winter season. The highest TC count was observed during summer at Site-2 (140.00×10⁴ ±22.63 cfu/g) and lowest at Site-1 (2.88×10⁴ ±0.97 cfu/g) during monsoon season (Fig. 3).
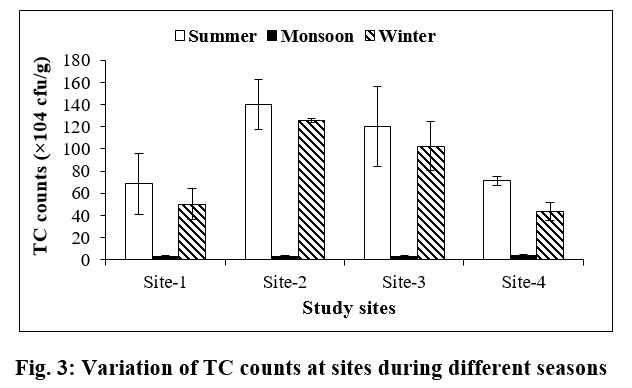 | Figure 3: Variation of TC counts at sites during different seasons Click here to view figure |
The Fecal coliform (FC) count was also fluctuated during summer and winter seasons, it was more uniform during monsoon season at all the study sites. During summer, the highest count of FC count was documented at Site-2 (5.98×10³±0.03 cfu/g) and lowest at Site-4 (1.14×10³±0.11 cfu/g). During winter season, the FC count ranged between 1.04×10³±0.08 to 3.84×10³±1.00 cfu/g at Site-4 and Site-2, respectively (Fig. 4).
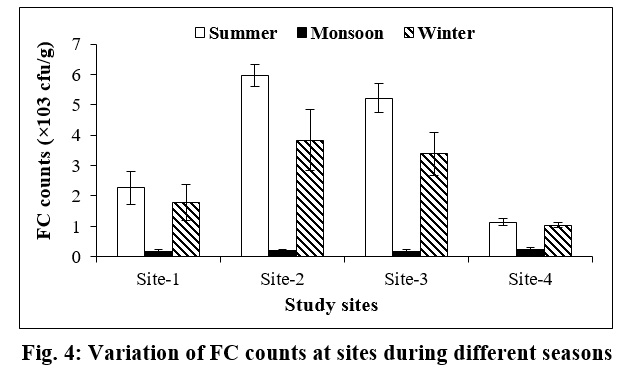 | Figure 4: Variation of FC counts at sites during different seasons Click here to view figure |
The uniform distribution of Vibrio cholerae (VC) count was observed during monsoon season at all the sampling sites. During summer, its highest count was noted at Site-3 (3.85×10⁴±0.26 cfu/g), followed by Site-2 (3.45×10⁴±0.05 cfu/g). During winter season, the highest count was also found at Site-3 (2.48 ×10⁴±0.54 cfu/g) and the lowest count at Site-4 (0.91×10⁴±0.07 cfu/g) (Fig. 5).
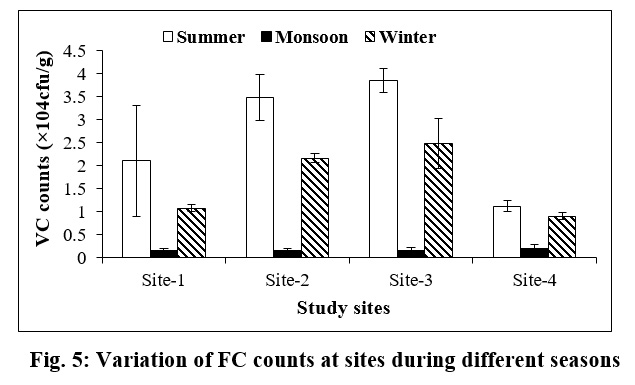 | Figure 5: Variation of FC counts at sites during different seasons Click here to view figure |
Correlation analysis among bacterial parameters of sediment is shown in Table 3. Significant positive correlation was observed between THB and TC (r = 0.978), THB and FC (r = 0.951), THB and VC (r = 0.959), TC and FC (r = 0.951), TC and VC (r = 0.939) and between FC and VC (r = 0.974) at p < 0.01 level respectively.
Evaluation of microbial quality of sediment of Padma River is shown in Table 4. According to the sediment quality guidelines,9,10,11 the sediment of Padma River was moderately polluted with THB during monsoon at Sites-1, 2 and 3, while its moderate pollution was noted during monsoon as well as winter season at Site-4. Moderately high population of THB was found at all the sites during summer and winter seasons except winter season at Site-4. In case of FC, very little contamination was observed during monsoon season at all the study sites, while little contamination of sediment of Padma River with FC was observed at all the sites during summer and winter seasons, respectively.
Table 4: Evaluation of sediment quality of Padma River at study sites during different seasons9, 10, 11
Bacteria | Number of bacteria | *Sediment quality | Site-1 | Site-2 | Site-3 | Site-4 | ||||||||
S | M | W | S | M | W | S | M | W | S | M | W | |||
THB (x 106 cfu/g) | 0.50 | 1 | ||||||||||||
> 0.50-1.00 | 2 | |||||||||||||
> 1.00-10.00 | 3 | ? | ? | ? | ? | ? | ||||||||
> 10.00-50.00 | 4 | ? | ? | ? | ? | ? | ? | ? | ||||||
> 50.00-100.00 | 5 | |||||||||||||
> 100.00-750. 00 | 6 | |||||||||||||
> 750.00 | 7 | |||||||||||||
FC (x 103 cfu/g) | 0.10-1.00 | 1 | ? | ? | ? | ? | ||||||||
> 1.00-10.00 | 2 | ? | ? | ? | ? | ? | ? | ? | ? | |||||
> 10.00-100.00 | 3 | |||||||||||||
> 100.00-500.00 | 4 | |||||||||||||
> 500.00-1000.00 | 5 | |||||||||||||
> 1000.00-10000.00 | 6 | |||||||||||||
> 1000.00 | 7 | |||||||||||||
Key: THB = Total heterotrophic bacteria; FC = Fecal coliform; No. of bacterial range for *According to sediment quality guidelines: THB, 1 = 0.50, 2 = > 0.50-1.00, 3 = > 1.00-10.00, 4 = > 10.00-50.00, 5 = > 50.00-100.00, 6 = > 100.00-750. 00 and 7 = > 750.00. No. of bacterial range for FC, 1 = 0.10-1.00, 2 = > 1.00-10.00, 3 = > 10.00-100.00, 4 = > 100.00-500.00, 5 = > 500.00-1000.00, 6 = > 1000.00-10000.00 and 7 = > 1000.00; degree of loading with easily decomposable organic substance and feces: 1- very little, 2 - little, 3 - moderate, 4 - moderately high, 5 - high, 6 - very high, 7 - extremely high. S = Summer, M = Monsoon, W = Winter.
Discussion
Municipal, industrial wastewater and agricultural runoff are main sources of pollution of river ecosystem. These polluting sources may vary from different locations and different seasons. With the prompt development in agriculture, urbanization, and industrialization, contamination of river water is becoming a common phenomenon in Padma River. In such a grave situation, this present study is an important finding to know the present status of microbial pollution level in this river.
THB count was highest at Site-2 (20.60×10⁶±1.41 cfu/g) during summer and lowest at Site-4 (3.46×10⁶±0.47 cfu/g) during monsoon season. It was found that seasonal variation is one of the major factors in determining bacterial abundance in Padma River, which agrees with findings of,12 who found that in tropical countries the seasonal variation is a driving force in distribution and abundance of microorganisms. Sediment quality a guideline was also showed similar findings and it indicated that during dry months the sediment of Padma River was moderately polluted with THB. Followed by THB, total coliform (TC) count was highest during summer at Site-2 (140.00×10⁴±22.63 cfu/g) and lowest at Site-1 (2.88×10⁴±0.97 cfu/g) during monsoon. In general, the higher counts of coliform bacteria are attributed to rapid growth of population in the open defecation areas along the river banks. Along with open defecation, the release of municipal and industrial effluents and the drainage of agricultural land fertilization contribute to the increase in concentrations. In a study conducted by13 in well water to compare the survival of organisms indicated that coliform bacteria have a half-life of 17 hrs where they confirm the effectiveness of coliforms as indicators for the suitability of water. Therefore, maximum counts of bacterial population during summer season indicated worsen condition of river water, and it may be related to the discharge of household wastes and fecal matters that directly enters into the river. However, sometimes open defecation along the river bank contributes to the above process. The disposal of city waste are mostly taken place through the drains located at Site-2, which might be a possible reason for higher total coliform at this location. On the other hand, as the growth of bacteria in an aquatic environment is influenced by seasonal variation of temperature,14 lowest count of total coliform during winter period might be due to low temperature, which is not favourable for duplication of bacterial population. Fecal pollution was initiated by the presence of raw and partially decomposed sewage materials; therefore it is a best indicator for the assessment of fecal pollution in an aquatic environment.15 The highest value of FC was also recorded at Site-2 (5.98×10³±0.36 cfu/g) in summer and the lowest at Site-3 (0.16×10³±0.08 cfu/g) in monsoon during the study period. Site-2 was characterized as a high sewage and municipal disposal location which contributed to the higher fecal coliform level as reported by,16 high bacterial counts are attributed to contamination by domestic sewage in the Densu River of Ghana. However, sometimes direct defecation and urination by wild and domestic animals also contaminate the surface water of river.17 Higher concentrations of total and fecal coliforms were also strongly associated with rainfall and pollutant sources.18 However, the concentration of fecal coliform was higher during summer season might be the reason of low water level, high organic matter and optimum growth supporting nutrient. This finding was also supported the result of sediment quality evaluation. According to sediment quality guidelines, sediment of Padma River was very little polluted with FC during wet months, while it was little polluted with the same bacterial profile during dry months. In the present study, the value of bacterial population drops down during the rainy season, which was due to the dilution caused by the rain water through flood water. Similarly, V. cholerae was highest at Site-3 (3.85×10⁴±0.26 cfu/g) in summer, and lowest at Site-1 and Site-3 (0.15×10⁴±0.06 and 0.15×10⁴±0.07 cfu/g) during monsoon season. The possible reason for higher V. cholerae during summer days might be due to low water level, and mounting sewage contamination, which is in agreement with an earlier findings of19 who conducted a study on seasonal variations of Vibrio cholerae (non-O1) from California coastal waters. Therefore, people living along the Site -2 and Site-3 were exposed to high risk of THB, TC, FC and V. cholerae by their use of the surface water of Padma River especially in dry season. However, the present bacterial pollution can causes ecosystem degradation that might be devastating for ecological life of Padma River.
Correlation analysis among bacterial parameter of sediment indicates significantly (p < 0.01) positive correlation, which means all the bacterial populations were related with each other and might possibly being originated from same sources. Therefore, addressing issues concerning major point source pollution by identifying and implementing ecologically-sound treatment processes can ensure the better management of the surface water of Padma River. In such a situation the government can implement Ecological Sanitation (EcoSan) as a sustainable approach which can also promote proper use of waste materials as fertilizer to agriculture.20
Conclusion
In this study, sediment of Padma River was assessed to evaluate the level of bacterial pollution. The result of the present study indicates that the pollution of sediment was categorized as moderate to moderately high with THB and very little to little polluted with FC bacteria according to sediment quality guidelines. This indicates that the river sediment is obviously polluted by indicator and pathogenic bacteria especially at Site-2 and Site-3 during the dry months. Therefore, the present study recommends to tighten the control on the discharged wastes into the river from local households and other water polluting industries and to take proper pretreatment measures of these pollutants before discharging these into the river system.
Acknowledgement
The authors are grateful to the Ministry of Science and Technology, Government of the People’s Republic of Bangladesh for providing the National Science and Technology Fellowship and associated funding for this research work.
References
Dionisio L. P. C., Rosado E. G., Lopez-cortes L., Castro D., Borrego J. J. Microbiological and sanitary quality of recreational seawaters of Southern Portugal. Water Air and Soil Pollution. 2002;138:319-334.
CrossRef
Bonetta S., Borelli E., Bonetta S., Conio O., Palumbo F., Carraro E. Development of a PCR protocol for the detection of Escherichia coli O157:H7 and Salmonella spp. in surface water. Environmental Monitoring and Assessment. 2011;177:493-503.
CrossRef
Ouyang Y., Nkedi-Kizza P., Wu Q.T., Shinde D., Huang C. H. Assessment of seasonal variations in surface water quality. Water Research. 2006;40:3800-3810.
CrossRef
Ouattara K. N., Passerat J., Servais P. Faecal contamination of the water and sediment in the rivers of the Scheldt drainage network. Environmental Monitoring and Assessment. 2011;183:243-257.
CrossRef
Hiraishi A., Saheki K., Horie S. Relationship of total coliform, faecal coliform and organic pollution levels in Tamagawa river. Bulletin of Japanese Society for Science of the Fish. 1984;50(6):991-997.
CrossRef
Lee C. M., Lin T. Y., Lin C. C., Kohbodi G. A., Bhattl A., Lee R., Jay J. A. Persistence of fecal indicator bacteria in Santa Monica Bay beach sediments. Water Research. 2006;40:2593-2602.
CrossRef
Davies C. M., Long J. A. H., Donald M., Ashbolt N. J. Survival of fecal microorganisms in marine and freshwater sediments. Applied Environmental Microbiology. 1995;61:1888-1896.
American Public Health Association (APHA). Compendium of methods for the microbiological examination of foods. Washington, D.C. 1976.
Kohl W. Uber die Bedeutung bakteriologischer Untersuchungen fiir die Beurteilung von Fliessgewassem, dargestelt am Beispiel der osterreichischen Donau. Archives of Hydrobiology, 44(Donauforschung). 1975;392-461.
Kavka G. G., Poetsch E. Microbiology In: Technical Report of the International Commission for the Protection of the Danbue River. Eds. Peter Literathy, Veronika Koller Kreimel, Igor Liska. Eigenverlag ICPDR. 2002;138-150.
Albinger O. Bacteriological investigation of water and sediment of the River Danube between stream kilometers 16 and 1868 from March 13rd-17th. Archives of Hydrobiolgical Supply. 1992;84:115.
Neumann D. A., Benemon H., Hubster E., Thinhutuan N., Tie-van L. Vibrio parahaemolyticus in the Republic of Vietnam. American Journal of Tropical Medicine and Hygiene. 1972;22:464-470.
CrossRef
McFeters G. A., Bissonnette G. K., Jezeski J. J., Thomson C. A., Stuart D. G. Comparative survival of indicator bacteria and enteric pathogens in well water. Applied Environmental Microbiology. 1974;27(5):823-829.
Tiefenthaler L. L., Stein E. D., Lyon G. S. Fecal Indicator Bacteria (FIB) Level during dry weather from southern California reference streams. Southern California Costal Water Research Project, Technical report. 2008;542.
Kowsalya R., Uma A., Meena S., Saravakumar K. Assessment of microbiological quality of Porur Double Lake, “Erettai Eri”, Chennai. Asian Journal of Microbiology Biotechnology and Environmental Science. 2010;12(3):667-671.
Karikari A. Y., Ansa-Asare O. D. Physicochemical and microbial water quality assessment of the Densu River of Ghana. West African Journal of Applied Ecology. 2006;10:87-100.
Crowther J., Kay D., Wyer M. D. Relationships between microbial water quality and environmental conditions in coastal recreational waters: the fylde coast, UK. Water Research. 2001;35:4029-4038.
CrossRef
Vincent N., Veronica J. A., Charles A. U., Stella I. O., Ameh J. Study of the bacteriological and physicochemical indicators of pollution of surface waters in Zaria, Nigeria. African Journal of Biotechnology. 2006;5(9):732-737.
Kenyon J. E., Piexoto D. R., Austin B., Gillies D. C. Seasonal variations of Vibrio cholerae (non-O1) isolated from California coastal waters. Applied Environmental Microbiology. 1984;47(6):1243-1245.
Simha P., Ganesapillai M. Eological Sanitation and nutrient recovery from human urine: How far have we come? A review. Sustainable Environment Research. 2017;27:107-116.
CrossRef


