Mapping of Agro-Ecological Zones of North-West India in Context to Climate Change Using Geographical Information System
Mohan Singh1
 and R.K Aggarwal1
*
and R.K Aggarwal1
*
http://dx.doi.org/10.12944/CWE.13.1.08
A study was conducted to quantify agro-climatic and agro-ecological zones in north-west India using 34 years (1980-1914) weather data of twenty two agro-meteorological stations of Jammu & Kashmir, Himachal Pradesh, Uttarakhand, Punjab, Haryana, Chandigarh, Delhi, Uttar Pradesh and Rajasthan. The weather data and the coordinates were converted into decimal system for each meteorological station, for spatial analysis. The map of north-west India was digitized and thermal, humidity, rainfall and moisture index and Length of growing period layers were prepared in the GIS environment using Arc GIS 10.1. These layers were combined by union operation and polygons were grouped into different zones. The moisture index and length of growing period zones were integrated with other spatial input layers of soil texture on logical manner to demarcate different agro-climatic and agro-ecological zones and sub zones. Based on texture the soils of study area were broadly characterized in five classes. North-west India was divided into ten agro-climatic zones as Z-1 to Z-10 and thirty six sub agro-ecological zones which represent homogeneity with respect to climate, growing periods and soil texture, which covers all features of abiotic crop environment. These zones helped to adjust cropping season according to moisture, temperature, vegetations and their combination regime. A shift in climatic belt was observed towards south-west as moist sub humid zone in Haryana which did not exist in old climatic map of Haryana. Itwas a new zone noticed in this state. The south-western limit of dry sub humid zone shifted about 40 km and of semi-arid zone shifted to about 60 km. The study will be very useful in the planning of farming system as well as cropping systems and may fill the gaps in ecological zonation of the area.
Copy the following to cite this article:
Singh M, Aggarwal R. K. Mapping of Agro-Ecological Zones of North-West India in Context to Climate Change Using Geographical Information System. Curr World Environ 2018;13(1). DOI:http://dx.doi.org/10.12944/CWE.13.1.08
Copy the following to cite this URL:
Singh M, Aggarwal R. K. Mapping of Agro-Ecological Zones of North-West India in Context to Climate Change Using Geographical Information System. Curr World Environ 2018;13(1). Available from: http://www.cwejournal.org?p=1073/
Download article (pdf)
Citation Manager
Publish History
Introduction
Climate is the composite of all the day-to-day weather conditions in a region over a considerable time. This time period should ideally be long enough to establish relevant statistical information necessary to describe the variations in a region.1 Climate may be thought of as an average of weather conditions over a period of time including the probability for distributions from this average.2,3 Climate is determined by three key factors the amount of energy the climatic system receives from the sun, the way in which this energy is distributed throughout the system and the degree of interaction between the various components of the system.4 Knowledge of climate is a valuable aid in the agriculture which including horticulture development, planning of a region, climate and weather are key factors in agriculture production.5,6 In some cases like rainfed production systems as much as 80%, of the variability of agricultural production is due to the variability in weather conditions.7,8
Agriculture crops grow best in locations where the climatic conditions meet their growth requirements.9 Since land suitability analysis requires the use of different kind of data and information viz; soil, climate, topography etc. as compared to the Geographical Information System (GIS) offers a flexible and powerful tool than conventional data processing systems.9,10 A framework of agro-ecological zoning describing concepts, methods and procedures was conceptualized for the first time.11 Agro-climatic classification is a technique that allows the simplification and generalization of climatic data to define climatic types in terms of basic climatic parameters so that it may evolve homogenous and traditional climatic regions.12 This zoning may help to adjust cropping season according to moisture, temperature, vegetations and their combination regime. When temperature and moisture layers superimposed on the soils maps it bring out Agro-climatic zones in term of climatic parameters and soils characteristics. These zones indicate ecological conditions and agricultural potential in respect of temperature or moisture conditions of the area or the region.
The climatic classification needs to be revisited at least once in 30 years; may be more frequently in future since more warming trends have been projected for future.13 Such an exercise may not reveal a substantial change in the overall area under different climates, even then may reveal spatial shifts of climatic zones, which has bigger implications for crop planning, water resources assessment and launching of special schemes on drought and floods including disaster management.13 There are observable changes identified in some subtypes of climates, especially semi-arid, savanna and tundra during the period 1961-1990.14
Climatic Agro-climatic zoning have been done by several workers.15,16 Each of these zoning has qualitative or quantitative criteria, or both, for delineation of its climate. Based on temperature, precipitation and native vegetation Koppen15 divided the world climate into five zones. Thornthwaite16 improved upon Koppen’s method by introducing the concept of water balance which was further improved by Thornthwaite and Mather.17 Subramanyam18 and Subramanian19 adopted the modified criteria for mapping climates of India in term of moisture and thermal regions. Rao et al.20 classified India’s climate according to the Thornthwaite and Mather method. Based on rainfall distribution pattern, the agricultural commission21 delineated the country into different rainfall groups and chose limits that have a closer relation with crop development. Planning commission22 has divided India into fifteen major agro-climatic zones based on similarity in rainfall, temperature, soil topography, cropping, farming system and water resources. Murthy and Pandey23 tried to delineate different agro-ecological regions of India. Patel et al.24 and Patel et al.25used the modern information tools like remote sensing and GIS to extend applicability of agro-ecological zoning in mountainous areas of Kumaon Himalayas. Bal et al.26 carried out agro-ecological zoning for the entire state of Punjab using remote sensing and GIS. Zoning divides the area into smaller units based on distribution of social, land surface, climate; and the level of detail to which given on the scale of the study, and sometimes on the facilities.27 FAO27 distinguishes agro-ecological cells are the basic units for land evaluation and data processing, from the ecological zones, which are spatial units related to a soil map. While each has a unique combination of soil and climatic characteristics, related to particular soil type, agro-ecological zones may contain a number of sets of characteristics, relating to different soil types within the same mapping unit.27 Sometimes, broader definitions are applied to agro-ecological zones, to encompass several soil mapping units and climatic zones with similar, but not identical, properties.27 Kunkel et al.28 provide a complete description of the analytical procedures used to determine length of growing season trends.29 The agro-ecological zoning and mapping of North-West India of the present study will provide a detailed base for the planning of agriculture and horticulture cropping systems and may also fill the gaps left over in the earlier studies.
Materials and Methods
Study Sites
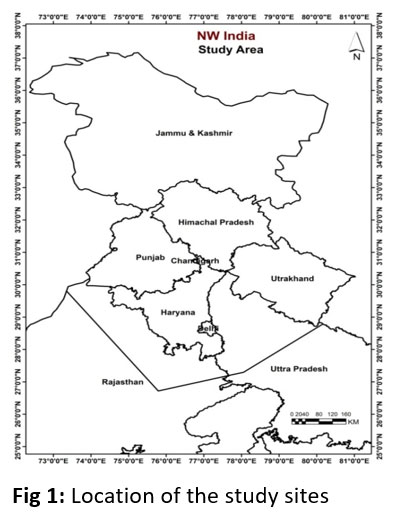
Twenty two meteorological stations, Srinagar, Jammu (Jammu & Kashmir), Manali, Shimla, Palampur, Solan (Himachal Pradesh), Ranichauri (Uttarakhand), Ludhiana, Bathinda Patiala (Punjab) Chandigarh, Ambala, Karnal, Rohtak, Sirsa, Hisar, Bawal, Narnaul (Haryana) Delhi, Ganganagar, Jaipur (Rajasthan) Saharanpur (Uttar Pradesh) located in north-west India were selected for the study. The experimental site was the north-west India (Fig 1) which approximately is located between 26040′ to 37010′ N latitude and between 720 50′ and 810 00′ E longitudes. The altitude of area varies between 200 to 8600 meters above mean sea level. Total area of the site is approximately 5 lakh square km out of this 1000 thousand hectare is covered under the fruit crops. It has geographic features like the cold desert, the coldest place on the earth30 the Higher Himalaya, the Middle Himalaya, the Lower Himalaya, the Shiwalik hills, semi desert sandy plain & the Aravali range and the hot Thar Desert.
The geographical information of all the stations is given in Table 1. Based on the altitude, the study area was divided >1000 meters as hills: Srinagar, Manali, Shimla, Palampur, Solan and Ranichauri and < 1000 m as Plains: Jammu, Chandigarh, Ambala, Saharanpur, Delhi, Karnal, Patiala, Ludhiana, Rohtak, Bathinda, Hisar, Sirsa, Bawal, Narnaul, Ganganagar and Jaipur.
Data Collected
Daily maximum and minimum temperature, Rainfall, evaporation and relative humidity data of twenty two locations, viz.,Manali, Shimla, Solan, Chandigarh, Ambala, Saharanpur, Delhi, Karnal, Patiala, Ludhiana, Rohtak, Bathinda, Hisar, Narnaul, Ganganagar and Jaipur for the year 1980 to 2014 and at Srinagar, Palampur, Ranichauri, Ranichauri, Sirsa, Bawal from 1985 to 2014, were used. These data were collected from (IMD), Central Research Institutes for Dry Land Agriculture (CRIDA), Revenue Departments, State Agricultural Universities (SAUs), Regional Research Stations (RRS), Regional Horticultural Research Stations (RHRS) etc. The maximum and minimum temperatures and monthly mean temperature for each station wereused for the computation of potential evapotranspiration in the Thornthwaite method.16 The rainfall and Potential Evapotranspiration (PET )was used to calculate the moisture index.
Table 1: Geographical Information of Different Meteorological Stations
|
S. No. |
Station |
Latitude |
Longitude |
Altitude (m) |
Division |
|
1 |
Manali |
32.27 |
77.17 |
2050 |
Hills |
|
2 |
Palampur |
32.12 |
76.53 |
1219 |
|
|
3 |
Ranichauri |
30.06 |
78.99 |
1950 |
|
|
4 |
Shimla |
31.11 |
77.17 |
2397 |
|
|
5 |
Solan |
30.92 |
77.12 |
1600 |
|
|
6 |
Srinagar |
34.09 |
74.79 |
1600 |
|
|
7 |
Ambala |
30.38 |
76.78 |
264 |
Plains |
|
8 |
Bathinda |
30.23 |
74.95 |
201 |
|
|
9 |
Bawal |
28.08 |
76.58 |
266 |
|
|
10 |
Chandigarh |
30.75 |
76.78 |
321 |
|
|
11 |
Delhi |
28.62 |
77.21 |
216 |
|
|
12 |
Ganganagar |
29.92 |
73.88 |
178 |
|
|
13 |
Hisar |
29.15 |
75.71 |
215 |
|
|
14 |
Jaipur |
26.91 |
75.81 |
431 |
|
|
15 |
Jammu |
32.73 |
74.87 |
327 |
|
|
16 |
Karnal |
29.69 |
76.98 |
245 |
|
|
17 |
Ludhiana |
30.91 |
75.85 |
244 |
|
|
18 |
Narnaul |
28.01 |
76.01 |
308 |
|
|
19 |
Patiala |
30.34 |
76.38 |
350 |
|
|
20 |
Rohtak |
28.89 |
76.57 |
220 |
|
|
21 |
Saharanpur |
29.96 |
77.54 |
268 |
|
|
22 |
Sirsa |
29.53 |
75.01 |
205 |
Calculation of PET
Potential evapotranspiration was computed by the Thornthwaite method16 which is the best among different empirical approaches as used by many workers for estimation of PET over several location of India31,32.
PET = 1.6 (10T/l)a (D/12) (N/30)
For a month consisting 30 days and 12 hours a day, the above equation can be written as:
E = 1.6(10T/I)a
Where,
E = Unadjusted PET, cm/month
T = Mean air temp, °C
I = Annual heat index. It is the summation of 12 values of monthly heat indices i.
i = (T/5)1.514
a = an empirical exponent computed by an expression given as,
a = 6.75x10⁻⁷ I3 -7.71x10⁻⁵ I2 +1.79x10⁻²I + 0.49239
For daily computation the equation is modified as:
PET = (KxEx10)/30 (mm/day)
Where, K = Adjustment factor
Calculation of Moisture Index
Moisture indices typically are function of the ratio of time averaged precipitation to time averaged moisture demand by the atmosphere. The moisture index given by Thornthwaite16 is well known, simple and typical used by researchers to describe the soil moisture status33 was chosen to calculate moisture index (MI) in this present study.
MI = (P-PET)/PET
Where,
P - Precipitation;
PET- Potential evapotranspiration
Calculation of Length of Growing Period (LGP)
The LGP is the period in days during a year when rainfall exceeds half the potential evapotranspiration plus a period during which half of PET is met by assured estimated stored moisture.34 Following formula was used in the present study:LGP = d(P ≥ PET/2) + 2ASM/PET
Where,
d = day and
ASM= Assured Stored Soil moisture
Delineation of Ecological Zones
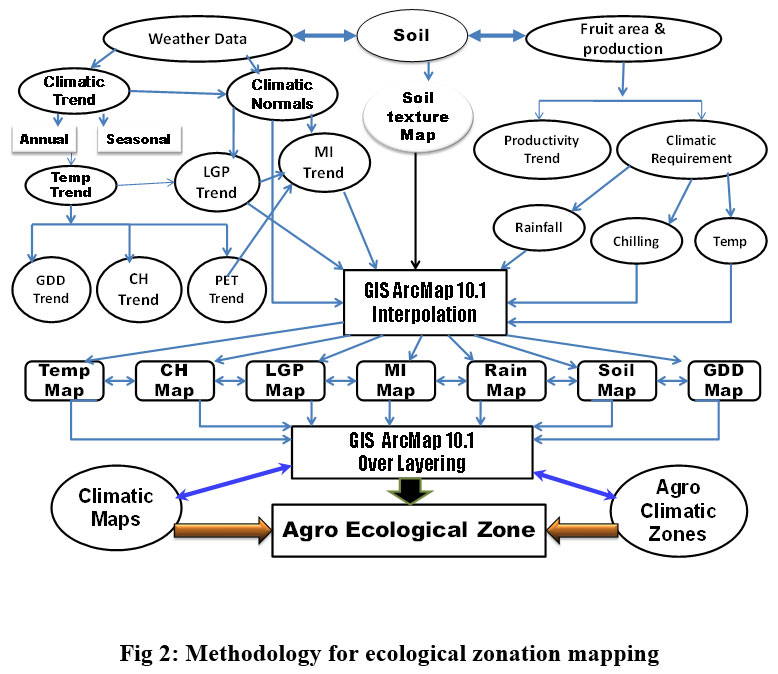
The nature of analysis, which involves the combination of layers of spatial information to define zones, lends itself to application of a GIS. The major requirements of computerized GIS for an activity like agro-ecological zoning and zonal resource information of mountain areas are topographic maps, land resource maps and contour maps. These maps, containing physiographic, geographic, and bio-climatic information form primary inputs. Various outputs are generated in both tabular and map forms. Thermal, humidity, rainfall and LGP maps were prepared in the GIS environment using Arc GIS 10.1. To finalize the zoning, these layers were combined by union operation and polygons were grouped into different zones. The grouping of polygons was based on suitability or favorability of concerned parameter (MI/LGP) for selected crops. After this the moisture index and length of growing period zones were integrated with other spatial input layers of soil texture on logical manner (Fig 2) to demarcate different agro-climatic and agro-ecological zones and sub zones. The hard copy of the map of the study area was digitized and shape file was created. Then NW India polygon shape file was selected. The latitude-longitude values of each point were find out and converted to degree-decimal format to enter in GIS. The coverage file (point) was then generated from the location data in Arc info GIS. The collected and analyzed data entered as attribute table and attached/joined to the point file already generated. Then the point file was interpolated by GIS tools and converted to raster format by krigging/radial basis interpolation function and hence different maps are generated, transported to the MS word for further use.
|
|
Figure 1: Location of the Study Sites |
|
|
Figure 2: Methodology for Ecological Zonation Mapping |
Results and Discussion
Agro-Climatic Zones
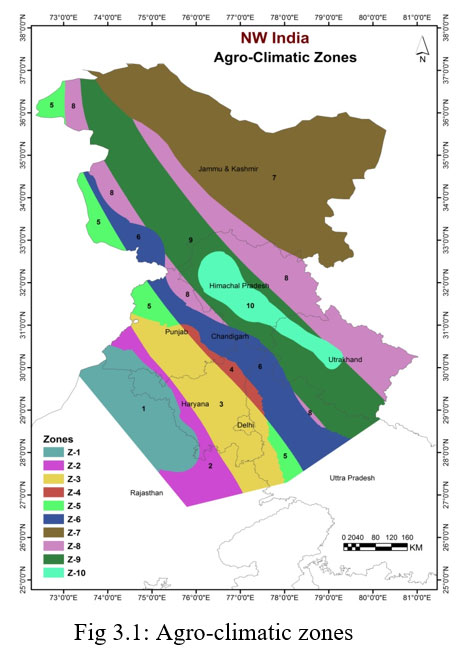
Climate map comprises of five zones (Perhumid, Humid, Sub-humid, Semi-arid and Arid) and LGP map comprises of five zones (<120 days, 120-180 days, 180-240 days and >240 days) were used to delineate agro-climatic zones. Ten (Z-1, Z-2, Z-3, Z-4, Z-5, Z-6, Z-7, Z-8, Z-9 and Z-10) agro-climatic zones have been generated through overlaying of these two maps in GIS software ArcMap GIS ver 10.1 (Fig 3.1). Central part of Uttarakhand and Himachal Pradesh with per-humid climate and more than 240 days of growing period was covered under Z-10. Surrounding of Z-10 a small area of northern Uttar Pradesh, southern Uttarakhand and west central of J&K was covered under Z-9 with humid climate and more than 240 days of growing period. Northern area and southern fringe of Uttarakhand and a small northern strip of Punjab and central J&K surrounding Z-9 were covered under Z-8 zone with humid climate and more than 180-240 days of growing period. North-eastern J&K (Kargil, Leh and Ladakh) and a small part of northern Himachal Pradesh were covered under Z-7 zone with cold arid climate and less than 120 days of growing period. Central part of Uttar Pradesh, northern Haryana, Punjab, Chandigarh and south-western J&K covered under Z-6 zone with sub-humid climate and 180-240 days of growing period. A small area of western Uttar Pradesh, south-western Punjab and most western strip of J&K were covered under Z-5 area with sub-humid climate and more than 120-180 days of growing period. Small area of south-western Uttar Pradesh, northern Haryana and central Punjab were covered under Z-4 with semi-arid climate and more than 180-240 days of growing period (Table 3.1). South-western Uttar Pradesh, fringe of northern Rajasthan, Delhi, major part of Haryana and central Punjab covered under Z-3 with semi-arid climate and 120-180 days of growing period. Zone-2 covered north east Rajasthan, part of Haryana and Punjab with semi-arid climate and less than 120 days of growing period. North western Rajasthan, portion of south-western Haryana and Punjab were covered under Z-1 zone with hot-arid climate and less than 120 days of growing period.
Agro-Ecological Zones
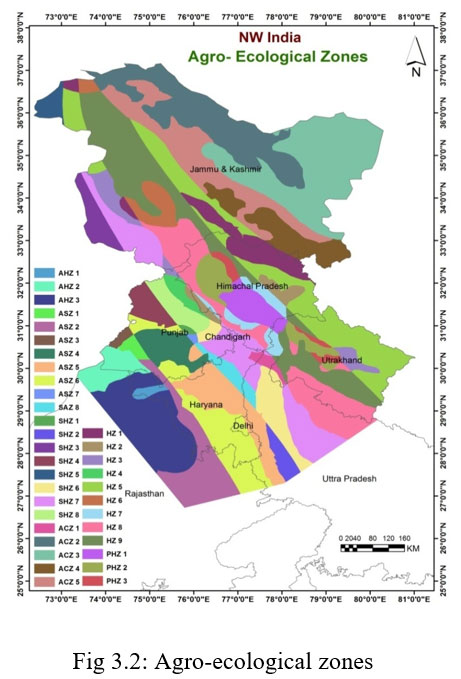
Agro-climatic map comprises ten zones and soil map comprises of five zones were overlayed and logically combined in raster module; the resultant layers obtained were the agro-ecological zones. The north-west India has been divided into thirty six sub agro-ecological zones shown in Figure 3.2. The general characteristics of different agro-ecological zones have been briefly described in Table 3.2. Each zone represents homogeneity with respect to climate, growing period and soil texture. Arid (hot) zone comprised of three sub agro- ecological zones, semi arid zone and sub humid zone each comprised of eight, arid (cold) comprised of five, humid comprised of nine and per-humid zone comprised three sub agro ecological zones (Table 3.2).
Table 3.1:Agro-Climatic Zones of North-West India
|
S. No. |
Name of zone |
Symbols |
M I (%) |
LGP (days) |
|
1 |
Arid (Hot) |
Z-1 |
< -66.7 |
<120 |
|
2 |
Semi-Arid |
Z-2 |
-66.7 to -33.4 |
<120 |
|
3 |
Semi-Arid |
Z-3 |
-66.7 to -33.4 |
120-180 |
|
4 |
Semi-Arid |
Z-4 |
-66.7 to -33.4 |
180-240 |
|
5 |
Sub-Humid |
Z-5 |
-33.4 to 20.0 |
120-180 |
|
6 |
Sub-Humid |
Z-6 |
-33.4 to 20.0 |
180-240 |
|
7 |
Arid (Cold) |
Z-7 |
> -66.7 |
<120 |
|
8 |
Humid |
Z-8 |
20.0 to 99.0 |
180-240 |
|
9 |
Humid |
Z-9 |
20.0 to 99.0 |
>240 |
|
10 |
Per-Humid |
Z-10 |
≥100 |
>240 |
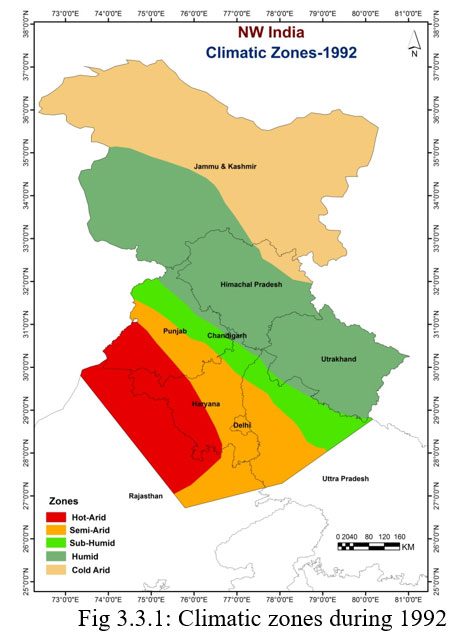
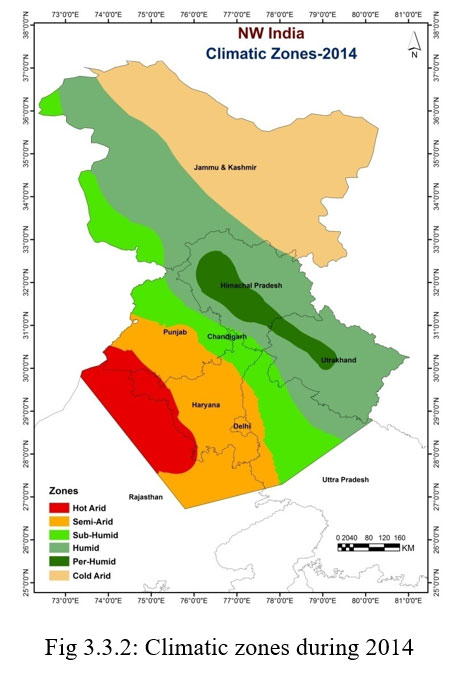
Climatic Shift
The climate zones delineated (Fig 3.3.2) when it was compared with the old climate Map (Fig 3.3.1) prepared by Sehgal35 indicate shift in climatic belt of in north–west India. These Figures shows that there was a climate shift from north-east to south-west of area under study. It was observed that the moist sub humid zone shifted from sub Himalaya to Shiwalik hills in Haryana state. The south-western limit of dry sub humid zone shifted about 40 km and of semi-arid zone shifted to about 60 km towards south-western direction. This shift might be due to increase in rainfall as discussed earlier which caused increase in potential evapotranspiration, ultimately moisture index, which was taken as the basis of zoning. Based upon moisture index Mavi36 delineated seven agro-climatic regions of Punjab, and assessed the suitability of each of the regions for growing crops with and without irrigation. Significant reflections resulting from the study of Raju et al.13 indicated a substantial increase of arid region in Gujarat and, a decrease of arid region in Haryana.
|
|
Figure 3.1: Agro-climatic zones |
Discussion
Soil texture classes were digitized based on hard soil maps and spatial distribution of soil texture in north-west India. The soils of study area were broadly characterized in five classes based on texture using GIS (i) long moist, black organic, under developed, sand to sandy soil (ii) limited moist, under developed sandy and clay in sub soil (iii) limited moisture in July, under developed, saturated with ground water, clay loam, high clay with cracking nature (iv) Dry, under developed, low organic, sandy gravels, sandy loam, erosion soils (v) Limited moisture, July-September, sandy loam to loam, alluvial soils. Similarly, Padma et al. (2012) studied the remote sensing applications and GIS techniques for mapping of land use. Vinod37 used the remote sensing and GIS techniques for soil texture mapping in Haryana.
|
|
Figure 3.2: Agro-ecological zones |
Climate map comprises of five zones (Perhumid, Humid, Sub-humid, Semi-arid and Arid) and LGP map comprises of five zones (<120 days, 120-180 days, 180-240 days and >240 days) were used to delineate agro-climatic zones. Ten agro-climatic zones have been generated through overlaying of these two maps (Climate and LGP) in the Arc/Info for north-west India. These ten zones have been named as Z-1, Z-2, Z-3, Z-4, Z-5, Z-6, Z-7, Z-8, Z-9 and Z-10, which had homogeneity with respect to climate and length of growing period. A shift in climatic belt was observed towards south-west when it was compared with old map as moist sub humid zone did not exist in old climatic map of Haryana and it was a new zone noticed in this state. Similar studies were done by Mavi36 who delineated seven agro-climatic regions of Punjab, Bal et. al.,26 also prepared an agro-ecologic map of Punjab by overlaying of thermal and LGP map layers and the planning commission22 has divided India into fifteen major agro-climatic zones. Based on temperature, rainfall and length of growing period Naidu et al.,38 had categorized lands as highly suitable, moderately suitable, marginally suitable and unsuitable for production of mango, banana, sweet orange, acid lime and cashew in Andhra Pradesh.Agro-climatic map comprises of ten zones and soil map comprises of 5 zones were overlayed and logically combined in raster module, the resultant layer obtained was the agro-ecological zones. North-west India has been divided into thirty six sub agro-ecological zones. Each zone represents homogeneity with respect to climate, growing periods and soil texture, which covers all features of abiotic crop environment. Similarly Manorama et al.,39 delineated suitable agro-ecological zones in plateau region of India for estimation of potential yield of potatoes and Patel et. al.,25 delineated agro-ecological zoning in mountainous areas of Kumaon Himalayas. Sehgal et al.,35 prepared the agro-ecological map of India using physiographic, soils, bio-climate, and the length of growing period; through several approximations. Map shows that there was a climate shift from north-east to south-west of area under study. Lu et al.,40 observed similar shifting results in China.
Table 3.2: Characteristics of Agro-Ecological Zones
|
S. No. |
Agroclimatic Zone |
Sub Agro- Ecological Zone |
Moisture Index (%) |
Soils |
LGP (days) |
|
1 |
Arid (Hot) (Z-1) |
AHZ 1 |
< -66.7 |
Clay loam to clay with cracking nature |
<120 |
|
AHZ 2 |
< -66.7 |
Dry, sandy gravels, sandy loam, eroded soil |
<120 |
||
|
AHZ 3 |
< -66.7 |
Sandy loam to loam, alluvial soils |
<120 |
||
|
2 |
Semi-Arid (Z-2) |
SAZ 1 |
-66.7 to -33.4 |
Limited moist, sandy with clay in sub soil |
<120 |
|
SAZ 2 |
-66.7 to -33.4 |
Clay loam to clay with cracking nature |
<120 |
||
|
SAZ 3 |
-66.7 to -33.4 |
Sandy loam to loam, alluvial soils |
<120 |
||
|
3 |
Semi-Arid (Z-3) |
SAZ 4 |
-66.7 to -33.4 |
Limited moist, sandy with clay in sub soil |
120-180 |
|
SAZ 5 |
-66.7 to -33.4 |
Clay loam to clay with cracking nature |
120-180 |
||
|
SAZ 6 |
-66.7 to -33.4 |
Clay loam to clay with cracking nature |
120-180 |
||
|
4 |
Semi-Arid (Z-4) |
SAZ 7 |
-66.7 to -33.4 |
Limited moist, sandy with clay in sub soil |
180-240 |
|
SAZ 8 |
-66.7 to -33.4 |
Clay loam to clay with cracking nature |
180-240 |
||
|
5 |
Sub-Humid (Z-5) |
SHZ 1 |
-33.4 to 20.0 |
Limited moist, sandy with clay in sub soil |
120-180 |
|
SHZ 2 |
-33.4 to 20.0 |
Clay loam to clay with cracking nature |
120-180 |
||
|
SHZ 3 |
-33.4 to 20.0 |
Clay loam to clay with cracking nature |
120-180 |
||
|
SHZ 4 |
-33.4 to 20.0 |
Sandy loam to loam, alluvial soils |
120-180 |
||
|
6 |
Sub-Humid (Z-6) |
SHZ 5 |
-33.4 to 20.0 |
Limited moist, sandy with clay in sub soil |
180-240 |
|
SHZ 6 |
-33.4 to 20.0 |
Clay loam to clay with cracking nature |
180-240 |
||
|
SHZ 7 |
-33.4 to 20.0 |
Clay loam to clay with cracking nature |
180-240 |
||
|
SHZ 8 |
-33.4 to 20.0 |
Sandy loam to loam, alluvial soils |
180-240 |
||
|
7
|
Arid (Cold) (Z-7)
|
ACZ 1 |
< -66.7 |
Long moist, black organic, sand to sandy |
<120 |
|
ACZ 2 |
< -66.7 |
Limited moist, sandy with clay in sub soil |
<120 |
||
|
ACZ 3 |
< -66.7 |
Clay loam to clay with cracking nature |
<120 |
||
|
ACZ 4 |
< -66.7 |
Clay loam to clay with cracking nature |
<120 |
||
|
ACZ 5 |
< -66.7 |
Sandy loam to loam, alluvial soils |
<120 |
||
|
8
|
Humid (Z-8) |
HZ 1 |
20.0 to 99.0 |
Long moist, black organic, sand to sandy |
180-240 |
|
HZ 2 |
20.0 to 99.0 |
Limited moist, sandy with clay in sub soil |
180-240 |
||
|
HZ 3 |
20.0 to 99.0 |
Clay loam to clay with cracking nature |
180-240 |
||
|
HZ 4 |
20.0 to 99.0 |
Clay loam to clay with cracking nature |
180-240 |
||
|
HZ 5 |
20.0 to 99.0 |
Sandy loam to loam, alluvial soils |
180-240 |
||
|
9 |
Humid (Z-9) |
HZ 6 |
20.0 to 99.0 |
Long moist, black organic, sand to sandy |
>240 |
|
HZ 7 |
20.0 to 99.0 |
Limited moist, sandy with clay in sub soil |
>240 |
||
|
HZ 8 |
20.0 to 99.0 |
Clay loam to clay with cracking nature |
>240 |
||
|
HZ 9 |
20.0 to 99.0 |
Sandy loam to loam, alluvial soils |
>240 |
||
|
10 |
Per-Humid (Z-10) |
PHZ 1 |
≥100 |
Limited moist, sandy with clay in sub soil |
>240 |
|
PHZ 2 |
≥100 |
Clay loam to clay with cracking nature |
>240 |
||
|
PHZ 3 |
≥100 |
Sandy loam to loam, alluvial soils |
>240 |
|
|
Figure 3.3.1: Climatic zones during 1992 |
|
|
Figure 3.3.2: Climatic zones during 2014 |
Conclusions
The soils of study area were broadly characterized in five classes (i) Sand to sandy soil (ii) Sandy and clay with sub soil (iii) Clay loam, high clay with cracking nature (iv) Dry, sandy gravels, sandy loam, erosion soils (v) Sandy loam to loam, alluvial soils. North-west India was divided into ten agro-climatic zones and thirty six sub agro-ecological zones. These zonesrepresented homogeneity with respect to climate, growing periods and soil texture covering all features of abiotic crop environment. A shift in climatic belt was observed towards south-west and the south-western limit of dry sub humid zone shifted about 40 km and of semi-arid zone shifted to about 60 km towards south-western direction.
Acknowledgements
The support and guidance provided by Dr Ram Niwas and Dr. Anurag, Department of Ago-meteorology, HAU, Hisar is highly acknowledged.
Conflict of Interest
There is no conflict of interest.
References
-
Schuize R. E., Mahara J. M., Lynch S. D., Howe B. J., Melvil-Thomson. BSouth African Atlas of Agrohydrology and Climatology. Pp 277, Report TT82/96. Water Research Commission, Pretoria. 1997.
-
Houghton J. T., Jenkins G. J., Ephraums J. J. Climate change: The IPCC scientific assessment. Cambridge University Press, Cambridge, UK. 1990.
-
Houghton D. D. Introduction to climate change: Lecture notes for meteorologist, WMO-No.926. 2002.
-
Schulze R. E. Climate of South Africa, General Survey (8). pp 1-25. South African Weather Bureau, Department of Transport, Republic of South Africa. 1965.
-
De Jager J. M., Schuize R. E. The broad geographic distribution in Natal of Climatological factors important to agricultural planning. Agrochemophysica. 1977;9:81-91.
-
Jones P. G., Thornton P. K. Mark Sim Software to Generate Daily Weather Data for Latin America and Africa. Agron. J. 2000;92:445-53.
CrossRef -
Hoogenboom G. Contribution of agrometeorology to the simulation of crop production and its applications. Agric Forest Meteorol. 2000;103(1-2):137-57.
CrossRef -
Ramaraj A. P., Jagannathan R., Dheebakaran G. ISPRS archives XXXVIII-8/W3 workshop proceedings: Impact of climate change on agriculture. 2009;143-146.
-
Dhami J., Roy S., Nain A. S., Pawan R. Suitability analysis of apple and pear using remote sensing and GIS in Uttarankhand. J. Agrometeorology. 2012;14:464-474.
-
Dhami J., Roy S., Nain A. S. Evolving the suitable zones for plum production in Utrakhand using remote sensing and GIS. International J. Basic & Applied Agril. Res. 2014;12(2):167-172.
-
FAO Guidelines: Agro-ecological zoning. Soils Bulletin 73. Food and Agricultural Organisation, , Rome, Italy. 1976.
-
Fischer G., H van Velthuizen., F.O. Nachtergaele. Global Agro Ecological Zones Assessment: Methodology and Results. IIASA Interim Report IRâ€00â€064. 2000;338.
-
Raju B. M. K., Rao K. V., Venkateswarlu B., Rao A. V. M. S., Rao C. A.., Rao V. U. M., Bapuji Rao., Kumar R. V., Dhakar R., Swapna N., Latha P. Revisiting climatic classification in India: a district-level analysis. Current Science. 2013;105:492-495.
-
Belda M., Holtanová E., Halenka T., Kalvová J Climate classification revisited: from Köppen to Trewartha. Clim Res. 2014;59:1-13. https://doi.org/10.3354/cr01204.
CrossRef -
Köppen, WDas geographische System der Klimate. Handbuch der Klimatologie (ed. by W. Köppen and R. Geiger), Vol 1 Part C pp. 1-44. Verlag von Gebrüder Borntraeger, Berlin. 1936.
-
Thornthwaite C. W. An approach toward a rational classification of climate. Geographical review. 1948;38(1):55-94.
CrossRef -
Thornthwaite C. W., J. R. Mather. The water balance: Laboratory of Climatology, No. 8, Centerton NJ. 1955.
-
Subramanyam V. P. Climate types of India according to the regional classification of Thornthwaite. India J. Met. Geophys. 1956;7:253-255.
-
Subramanian A. R. Agro-ecological Zones of India. Arch. Met. Geoph. Biocl. 1983;32:329-333.
CrossRef -
Rao K. N., George C. J., Ramasastri K. SAgro-climatic classification of India. Agric. Met. Sci. Rep. No. 1, IMD, Pune. 1972.
-
Agriculture Commission. Report on crop production, sericulture and apiculture. Part 5, Ministry of agriculture and irrigation (GOI), New Delhi. 1976.
-
Planning Commission. Annual Report (1989-90), Government of India. 1989.
-
Murthy R. S., Pandey S. Delineation of agro-ecological regions of India. Paper presented in Commission V, 11th Congress of ISSS, Edmonton, Canada. 1978;19-27.
-
Patel N. R., Mandal U. K., Pande L. M. Agro-ecological zoning system. A Remote Sensing and GIS Perspective. Journal of Agrometeorology. 2000;2(1):1-13.
-
Patel N. R., Endang P., Suresh Kumar., Pande L. M. Agro-ecological zoning using remote sensing and GIS – A case study in part of Kumaon region. In: Sustainable agriculture development, Proce. of 2nd International Conference on Sustainable Agriculture, Water Resources Development and Earth Care Policies, 18-20 December, 2002, New Delhi. 2002.
-
Bal S. K., Choudhury B. U., Sood A., Bains G. S., Mukherjee J. Characterization of agro-ecological zones of Punjab state using remote sensing and GIS tools. ISPRS/ XXXVIII-8/W3 Workshop Proceedings: Impact of Climate Change on Agriculture. 2009;331-335.
-
FAO’s Agriculture and Development Economics Division (ESA) with support from the FAO Netherlands Partnership Programme (FNPP) and the EC-FAO Food Security Programme. 1996.
-
Kunkel K. E. Update to data originally published in: Kunkel, K.E., D.R. Easterling, K. Hubbard,and K. Redmond. 2004. Temporal variations in frost-free season in the United States: 1895–2000. Geophys. Res. Lett. 2014;31:L03201.
CrossRef -
Kunkel K. E., Easterling D. R., Hubbard K., Redmond K., Andsager M. C., Spinar M. L. Quality control of pre-1948 Cooperative Observer Network data. J. Atmos. Ocean. Tech. 2005;22:1691–1705.
CrossRef -
Akbar P. I., Kanwar M. S., Saleem M. M., Hussain A. Protected Vegetable Cultivation Technology for Cold Arid Agro-ecosystem of Ladakh, International Journal of Horticulture. 2013;1:3(19):109-113.
-
Krishan Kumar K., Rupa Kumar K., Rackah P. R. Comparison of Penman and Thornthwaite method of estimating potential evapotranspiration for Indian conditions. Theor. Appl. Climatol. 1987;38(3):140-146.
-
Rao, K. N., George, C. J., Ramasastri K. S. Potential evapotranspiration over India. Scientific ReportNo. 136, New Delhi, IMD. 1971.
-
Willmott C. J., Feddema J. J. A more rational climatic moisture index. Professional Geographer. 1992;44(1):84-87.
CrossRef -
Higgins G. M. Kassam A. H. The FAO agro-ecological zone approach to determination of land potential. Pedologie. 1981;31:147-68.
-
Sehgal J, L., Mandal D. K., Mandal C., Vadivelu S. Agro-ecological Regions of India. Publication 24. NBSS & LUP (ICAR), Nagpur, India. 1992.
-
Mavi H. S. Introduction to Agrometeorology. pp 209-27(2nd ed). Oxford & IBH Publishers Co. Pvt. Ltd, New Delhi. 1984.
-
Vinod K. Agro-ecological zoning of Haryana in context of climate change and agricultural post-harvest avenues. Thesis submitted to the Chaudhary Charan Singh Haryana Agricultural University, Hisar. 2015.
-
Naidu L. G. K., Srinivas C. S., Subbi Reddy., Ramesh Kumar S. C., Reddy R. S.Identification and delineation of suitable areas for mango, banana, citrus and cashew crops in Andhra Pradesh. Agropedology. 2009;19(1):30-40.
-
Manorama M., Gaunda K. P. M., Shashirawat., Ravichandran G., Pal S. S. Agro-ecological zoning and estimation of potential yield of potato in plateau region of India. J. Agrometeorology. 2014;16(2):214-215.
-
Lu Q.,Gao Z., Xu X., Ning J., Bi X. Trends in moisture index, farmland area, and their combined effect on grain formation in Northern China. Advance in Meteorology. 2014;1-9.


