Respirable Mercury Particulates and Other Chemical Constituents in Festival Aerosols in Delhi
Anu Arora1
, Anita Kumari1
 and Umesh Kulshrestha1
*
and Umesh Kulshrestha1
*
http://dx.doi.org/10.12944/CWE.13.1.02
The display of fireworks emits a large amount of gaseous and particulate pollutants which accumulate in the atmosphere for a short period and have adverse effects on human health, and climate. Significant accumulation takes place due to episodic emissions of fireworks during special events such as New Year, Cricket match and Deepawali festivals etc. This study reports PM10 loads and chemical compounds during episodic emission of Deepawali by collecting aerosols samples during Pre-Deepawali period (Pre), on the day of Deepawali (D), and Post-Deepawali period (Post), in order to assess the change in chemical composition of air due to fireworks. PM10 aerosol samples were collected by using Respirable Dust Sampler (RDS) at JNU in South Delhi. The samples were analyzed for chemical constituents such as Particulate Mercury (HgP) by using Differential Pulse Anodic Stripping Voltammetry (DPASV) technique, Elemental Carbon (EC) and Organic Carbon (OC) by using a thermal/optical analyzer and metal oxides by using Energy Dispersive X-Ray (EDX). For the morphological characterization of particles Scanning Electron Microscope (SEM) was used. The results showed that particulate mercury (HgP) and PM10 loadings were relatively higher in the samples collected on Deepawali day as compared to Pre- Deepawali and Post-Deepawali samples. The order of metal oxides was recorded as K>Al>S>Cl>Ca>Fe and Ba, Mg and Ti were present only on the day of Deepawali, indicating its contribution from fireworks. OC and EC showed a strong correlation with PM10 concentrations. A strong linkage of K with Al (r=0.92) and S (r=0.83), as well as of Fe with Ca (r=0.94) was observed during Deepawali festival week. Also, S showed its association with PM10 concentration suggesting its emission from combustion of sulphur containing raw material of fireworks. The study suggests that the firework emissions significantly affect air quality, increasing the possibility of respiratory illness.
Copy the following to cite this article:
Arora A, Kumari A, Kulshrestha U. Respirable Mercury Particulates and Other Chemical Constituents in Festival Aerosols in Delhi. Curr World Environ 2018;13(1). DOI:http://dx.doi.org/10.12944/CWE.13.1.02
Copy the following to cite this URL:
Arora A, Kumari A, Kulshrestha U. Respirable Mercury Particulates and Other Chemical Constituents in Festival Aerosols in Delhi. Curr World Environ 2018;13(1). Available from: http://www.cwejournal.org?p=1072/
Download article (pdf)
Citation Manager
Publish History
Introduction
Recently, concern about air pollution and its effects has increased in the society.1 Therefore, a number of studies have been reported to characterize atmospheric aerosols, especially in urban areas.2-4 Delhi stands out at the second position in the list of most polluted megacities of the world with regard to the particulate pollution.5 Factors contributing to the high levels of pollutants are chiefly because of developmental activities and the large population of Delhi.
Among all the major sources of air pollution, one of the remarkable sources is the display of fireworks to celebrate festivities as well as specific events world widely.6 Typically, fireworks consist of paper tubes filled with metallic, non-metallic and organic compounds (magnesium, aluminium, titanium, boron, silicon, sulphur, charcoal), reducing agents (charcoal, sulphur), oxidizing agents (chlorates, nitrate), colouring agents (iron, strontium, barium, lithium, sodium, copper etc.) and binder (dextrin).6,7
These celebrations can cause acute short-term air quality degradation7 and long-term negative health effects on humans.8,9 The burning of fireworks emits organic compounds, metals and gaseous pollutants such as sulphur dioxide, nitrogen oxides and ozone into the atmosphere.3,7,10-15 Due to the burning of fireworks, sudden and dramatic increase in air pollution has also been reported by Zhang et al.,16 The impacts of fireworks on aerosol size distribution and associated barium (Ba), which has a direct bearing on human health (muscle cramps, heartbeat, asthma etc.), particle radiative and toxicological effects have been reported by Khaparde et al.,17 An oxidant, typically, a perchlorate or nitrate salt, is added into the fireworks because the oxygen present in the atmosphere can’t support a fast rate of combustion.18 Different colors in pyrotechnic are displayed by metal ions during combustion with Sr (red), Ba (green), Cu (blue) and Na (yellow-orange) being the most common.19,20
Binders such as gelatin, casein, nitrocellulose, polyester and starch and some additional compounds for noise effects (metal salicylates), color enhancement (chloride salts or chlorinated organics) and smoke generation (organic dyes) are also present in fireworks.18
In this study, we have measured the levels of metals in respirable aerosols at Delhi during 27/10/2016 to 02/11/2016. Particulate Mercury (HgP) content, Elemental Carbon (EC) and Organic Carbon (OC) concentrations have been estimated in the samples. Morphological characterization of particles has also been reported in this study.
Methodology
Sampling Site
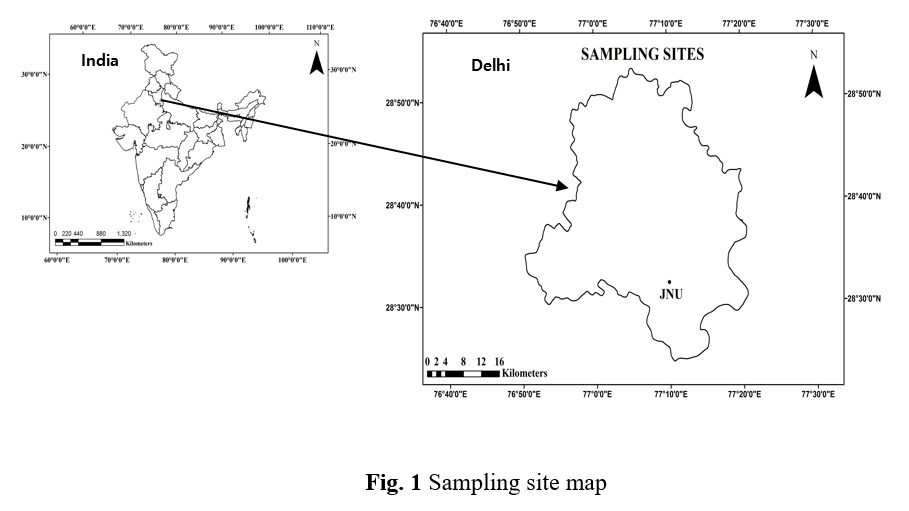
Delhi is the capital of India, located at 28° 36′ 36″ N and 77° 13′ 48″ E and ~240 m above mean sea level. Delhi, having a population density of ~11,297 per km2, ranks second in population and has the land area of 1,484 km2. Delhi has prevailed dry weather conditions during most of the year sometimes even during monsoon season also because it belongs to subtropical climate. Delhi has a variety of areas having different population and traffic densities, land use patterns and a number of industrial sites etc. The samples were collected in the Jawaharlal Nehru University (JNU) campus which is located in South Delhi. Figure 1 shows the site location. The site description is given below.
Jawaharlal Nehru University
JNU (28°32’ N and 77°10’ E) is located in the southern part of Delhi and the north of the Aravali Hills. The campus spreads over 4.12 km2 with high cover of trees. Aerosol samples were collected from the rooftop of the third floor of the School of Environmental Sciences building. Deepawali is celebrated in India every year in October or November. On this festival, a huge amount of firecrackers is burned throughout India especially in North India. Therefore, the source is uniformly distributed in Delhi as well as North India.
|
|
Figure 1: Sampling site map |
Collection and Preparation of Aerosol Sample
For this study, sampling was carried out during Pre-Deepawali (27/10/2016 to 29/10/2016), the day of Deepawali (30/10/2016) and Post-Deepawali (31/10/2016 to 02/11/2016) period. Quartz filters were used for the collection of PM10 aerosols. Before sampling, the filters were kept in the desiccator for 24 hours and weighed to take the initial weight of the filters. Ecotech made Respirable Dust Sampler (RDS) was used for collection of samples on the terrace of the School of Environmental Science building (~19 m height) in JNU campus. The sampling was carried out at an average flow rate of 1m3/min. The collected samples were again kept in the desiccator for 24 hours and weighed to take the final weight of the filters and then wrapped in aluminium foil and packed in the zipper bag and kept in the refrigerator at 4ºC until analysis. Differences of initial and final weights were used to calculate the mass of PM10 collected on the filters. Three sample blanks were also taken by just placing the quartz filter paper on RDS and then taking it out.For analysis, one-fourth filter was extracted in 50 ml of 5% HNO3 by putting in an ultrasonic water bath for 1hour12. After sonication, the extracted solution was passed through nylon syringe filter having the pore size of 0.2 μm and was stored in polypropylene bottles in a refrigerator at 4â—¦C until analysis. All sample containers and glasswares were rigorously acid-cleaned before use.
Determination of Mercury
Mercury in the extracted solution was analyzed by using 797 VA Computarace (version 1.3.2, Metrohm) analyzer with differential pulse anodic stripping voltammetry technique.21 The gold rotating disk electrode (Gold RDE) as working electrode, glassy carbon as auxiliary electrode, silver/silver chloride as the reference electrode were used during analysis. The method’s sensitivity depends upon the ‘deposition time’ of the electrode which is, in fact, a method of pre-concentrating the mercury. The working electrode was conditioned extensively before use. For analysis, 10 ml of extracted sample was taken into the cell to which 300 μl of perchloric acid (70%), 400 μl of EDTA (0.1 Molar) and 100 μl of KCl (3 Molar) were added. During deposition (pre-concentration) step in the analysis, 370 mV deposition potential was applied for 260 seconds. For analysis requiring detection limits below 10 ppb, dedicated electrodes and cell should be used. The Gold RDE was cleaned every day prior to use with the pencil eraser, and then a conditioning method was applied.
Determination of Organic Carbon (OC) and Elemental Carbon (EC)
Aerosol samples (collected on filters) were analyzed for the carbonaceous fraction (EC and OC) by using the Desert Research Institute Model 2001 Thermal/Optical Analyzer. Analyzer basically works on the preferential OC oxidation in pure helium (He) atmosphere followed by EC in 98% He and 2% O2 atmosphere step wise at different temperatures. All the carbon compounds are volatilized and passed through heated MnO2 and liberated in the form of CO2 in different environments from sample punch area of 0.5 cm2 of quartz filter.
Thermal/Optical Reflectance (TOR) method was used for the determination of carbonaceous fractions.22 Four OC fractions (OC1, OC2, OC3 and OC4 at 120ºC, 240ºC, 480ºC and 580ºC, respectively in pure He atmosphere) and three fractions of EC (EC1, EC2 and EC3 at 580ºC, 740ºC and 840ºC respectively in 98% He and 2% O2 mixed gas) were produced. Thus, following formula was used for the determination of EC, OC and TC.
Organic Carbon (OC) = OC1 + OC2 + OC3 +OC4 +OP (Pyrolyzed Organic Carbon)
Elemental Carbon (EC) = EC1 +EC2 + EC3 – OP
Total Carbon (TC) = OC + EC
In this regard, Quality Control/ Quality Assurance procedure has been described by Cao et al.,23
Morphological and Elemental Analyses of Samples
For surface morphology and elemental analysis of aerosol, samples collected on quartz filter were analyzed through Scanning Electron Microscope (SEM) and Energy Dispersive X-Ray (EDX) (Carl Zeiss AG- EVO® 40 Series Model). For elemental and the morphological analysis, first double-sided carbon tape was fixed on acetone washed metallic stubs then around 0.5 cm2 of quartz filter (sample) was cut by using an iron punch and was fixed on the upper side of the carbon tape. Firstly, samples were analyzed for elemental components by EDX. After EDX, morphological analysis was carried out by using SEM. For morphological analysis, the samples were coated with a thin layer of gold by Sputter Coater–Polaron (SC7640) material, which converted the materials into conductive ones.
Statistical Analysis
All graphs were plotted by using MS- Excel 2015. The Pearson’s correlation coefficients were calculated for various chemical species by using Statistical Package for the Social Sciences (SPSS) software.
Results and Discussion
Estimation of the PM10 Concentration
Table 1 gives the concentration of PM10 on different days during the week of festive celebration. PM10 concentration varied from 260 to 1279 µg/m3. These levels are considerably higher than the National Ambient Air Quality Standard (NAAQS) values (100 µg/m3) prescribed by Central Pollution Control Board (CPCB). Also, these levels of particulate matter are very high than the limits set by World Health organization (WHO) and European Union (50 μg/m3). The main cause of these high levels of PM10 is the emissions from fireworks during Deepawali festival. However, the levels of PM10 have been reported above the NAAQS limits due to dusty atmosphere.24,25 Apart from its own air pollution, Delhi also has to contend with the pollution that blows over from states such as Punjab and Haryana, where farmers have been burning the remnants of crops for preparation of their fields for the next sowing season.26
The activities of the neighboring states also affect the air quality of Delhi, noting that the location of the city makes it vulnerable to particulate matter coming from beyond its borders because of the wind direction.27 Moreover, weather conditions such as low temperature, low relative humidity and low wind speed in Delhi during the study period further helped in the accumulation of aerosols in the atmosphere. Just after Deepawali, fog and smog increased gradually. Very dense fog, and hazy conditions prevailed in Delhi on November 2nd, 2016 due to calm weather. These favorable conditions might be the reason for very high PM10 concentration on November 2nd, 2016.
Table 1: PM10 Concentrations (µg/m3) During Deepawali Festive Week.
|
S. NO. |
DATE |
PM10 (µg/m3) |
Period |
|
1 |
27-Oct-2016 |
312 |
Pre- Deepawali |
|
2 |
28-Oct-2016 |
260 |
|
|
3 |
29-Oct-2016 |
342 |
|
|
4 |
30-Oct-2016 |
1058 |
Deepawali |
|
5 |
31-Oct-2016 |
537 |
Post- Deepawali |
|
6 |
1-Nov-2016 |
626 |
|
|
7 |
2-Nov-2016 |
1279 |
Our observations are supported by the data obtained by the System of Air Quality and Weather Forecasting And Research (SAFAR), the network for allocating the health conditions of the location. According to SAFAR on October 3, 2016, the levels of PM2.5 and PM10 were 491µg/m3 and 785µg/m3 respectively. Based on the high values of PM10, SAFAR issued a “sever” advisory warning to avoid any outdoor physical activity on October 31, 2016, and November 1, 2016.
Elemental Characterization
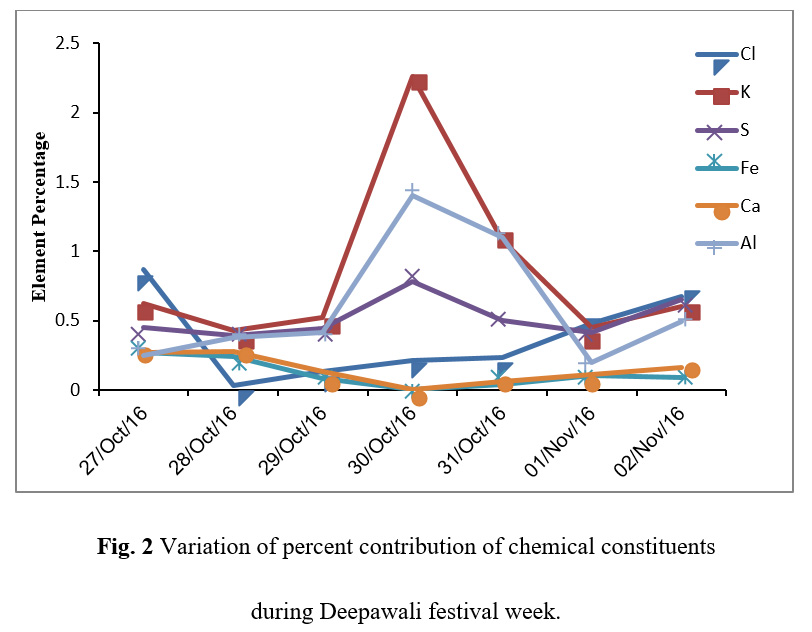
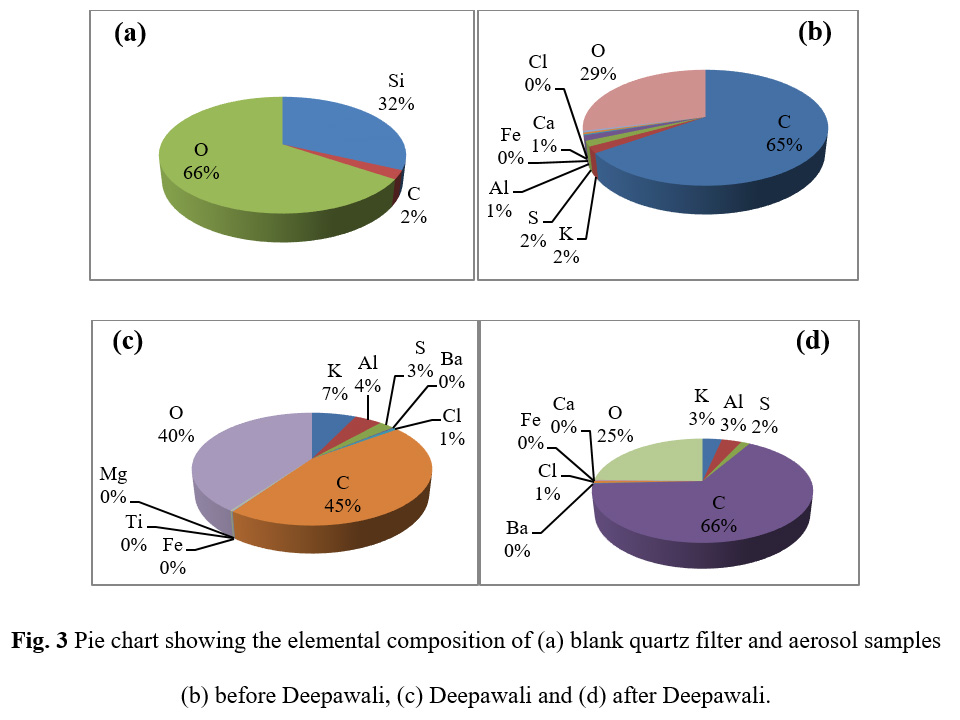
The percent elemental contribution of different chemical constituents as characterized by SEM-EDX has been given in Table 2. Figure 2 shows the variation of different chemical constituents in the samples during the study period. Figure 3 shows the pie charts depicting the elemental composition of blank quartz filter and aerosols samples before Deepawali, during Deepawali and after Deepawali. The blank filter was showing only Si, O and a very small fraction of C whereas the aerosol samples had the deposition of various chemicals such as K, Mg, Cl, S, Fe, Ca, Al etc. The percent fractions of all the elements were found to be gradually increased during the festive week with maximum percent composition on October 30, 2016. The higher concentration of these metals during fireworks were due the use of these metals in the manufacturing of sparkles and crackers. The highest concentration of these metals on festival day justify their emissions from fireworks. The presence of Ba, Mg and Ti have been seen only in the night aerosol sample of October 30, 2016, the reseason of this observation can be explained by looking at the specific signature of fireworks. Cu (blue), Al (white, silver), Ba (white as carbonate and nitrates, green as chlorates), Na (yellow), Sr (red), Ti (silver) are colour and glitter emitters, Zn is used to produce smoke effects, S is used as propellant, sulphate, nitrate, and chloride are metal salts component used which assist the display of colours. The black powder, the combustible material used in the fireworks comprises of sulphur, potassium chlorate or perchlorate and potassium nitrate. The elements such as barium, copper, magnesium, potassium, and strontium used as fireworks tracers have been reported by Steinhauser et al.,28 Fe and Ca were below detection limit on the festival day. In Delhi, Fe is contributed into the atmosphere by industries as well as crustal components while Ca is contributed into the atmosphere primarily by crustal components through re-suspension of soil dust.4 Being a holiday, on Deepawali, many companies and factories remained closed. Therefore, less industrial activates as well as the lower number of vehicles plying on the roads decreased the emissions from other anthropogenic sources and re-suspension of road dust. Hence, on festival day Fe and Ca were found below the detection limit. However, it needs further detailed investigation about the interferences of the crustal elements during Hg analysis.
Table 2: Percent Elemental Composition of Aerosol Samples Collected During Deepawali Festival Week.
|
Elements |
27-Oct-16 |
28-Oct-16 |
29-Oct-16 |
30-Oct-16 |
31-Oct-16 |
1-Nov-16 |
2-Nov-16 |
|
Cl |
0.87 |
0.03 |
0.13 |
0.21 |
0.23 |
0.48 |
0.67 |
|
K |
0.62 |
0.43 |
0.52 |
2.26 |
1.08 |
0.45 |
0.60 |
|
C |
17.36 |
12.24 |
18.58 |
14.26 |
20.96 |
25.37 |
21.86 |
|
S |
0.45 |
0.39 |
0.44 |
0.78 |
0.50 |
0.41 |
0.65 |
|
Fe |
0.27 |
0.24 |
0.08 |
-bd- |
0.04 |
0.10 |
0.09 |
|
Ca |
0.27 |
0.28 |
0.13 |
-bd- |
0.06 |
0.11 |
0.16 |
|
Al |
0.25 |
0.38 |
0.41 |
1.40 |
1.10 |
0.20 |
0.49 |
|
O |
4.04 |
8.77 |
8.22 |
12.75 |
7.84 |
2.51 |
4.08 |
|
Ba |
-bd- |
-bd- |
-bd- |
0.06 |
0.04 |
-bd- |
-bd- |
|
Mg |
-bd- |
-bd- |
-bd- |
0.10 |
-bd- |
-bd- |
-bd- |
|
Ti |
-bd- |
-bd- |
-bd- |
0.05 |
-bd- |
-bd- |
-bd- |
*-bd- is below detection
|
|
Figure 2: Variation of percent contribution of chemical constituents during Deepawali festival week. |
|
|
Figure 3: Pie chart showing the elemental composition of (a) blank quartz filter and aerosol samples (b) before Deepawali, (c) Deepawali and (d) after Deepawali |
HgP Levels
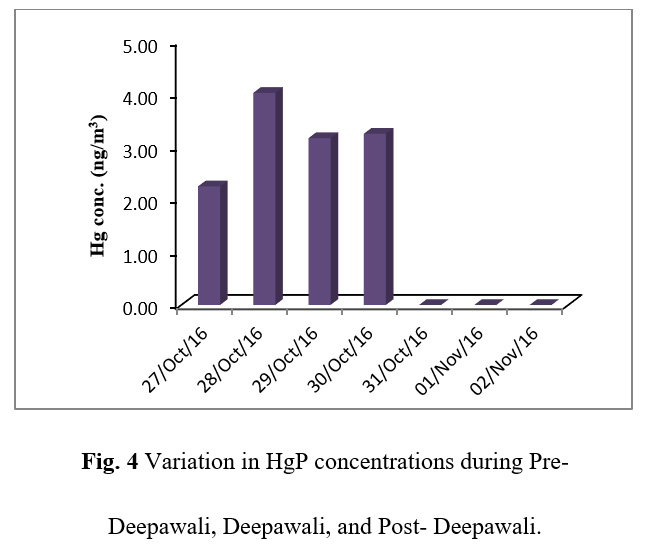
Table 3 gives the concentration of HgP during Deepawali festival week. As shown in Figure 4, HgP concentration was found to increase before the day of Deepawali, but the HgP values were found non-detectable after Deepawali night which was probably because of huge fireworks emissions which increased the concentration of PM10 and SO2. However, a significant amount of sulphur can also be suspended into the air from the unburnt material of fireworks. Basically, Sulphur is used in black powder as a combustible material used in the crackers. Mercuric ions have a strong affinity for sulfide, as evidenced by a preliminary adsorption study on heated pyrite and the solubility product for HgS.29 For HgP, aerosol composition and size distribution are the major drivers for processes involving clusters, particles and heterogeneous chemistry involving atmospheric ultrafine particles (UFPs).30 As shown in Table 2, the chloride ion concentrations increased with the increase in the fireworks activity during the festival, probably because the rate of sorption of mercury increases with increasing concentration of chloride.31,32 It has been reported that the clusters provide a huge surface area for chemical reactions33 and the aggregates of UFPs have distinct properties as compared to the aerosol particles of similar size. However, more investigations are required in this direction as the detailed specific studies for mercury are not yet available to the authors’ knowledge.
Table 3: HgP Concentrations during Deepawali festival week
|
S. NO. |
DATE |
Hg conc. (ng/m3) |
|
1 |
27-Oct-2016 |
2.24 |
|
2 |
28-Oct-2016 |
4.02 |
|
3 |
29-Oct-2016 |
3.16 |
|
4 |
30-Oct-2016 |
3.24 |
|
5 |
31-Oct-2016 |
ND |
|
6 |
01-Nov-2016 |
ND |
|
7 |
02-Nov-2016 |
ND |
*ND = Not Detected
|
|
Figure 4: Variation in HgP concentrations during Pre- Deepawali, Deepawali, and Post- Deepawali. |
Carbonaceous Content
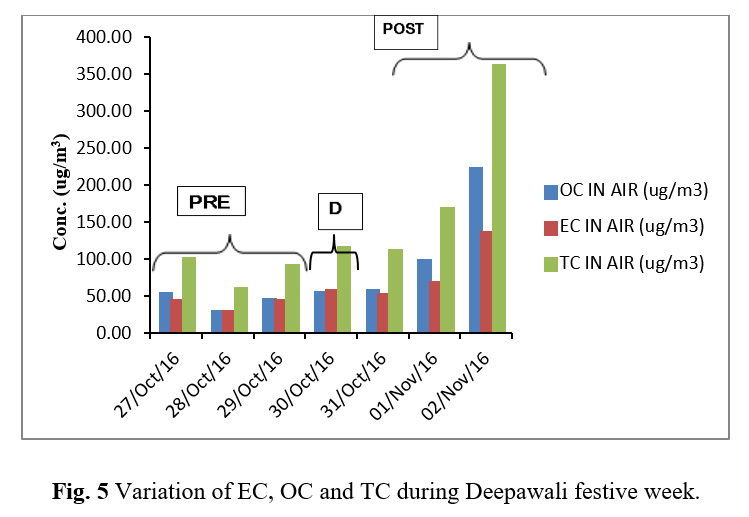
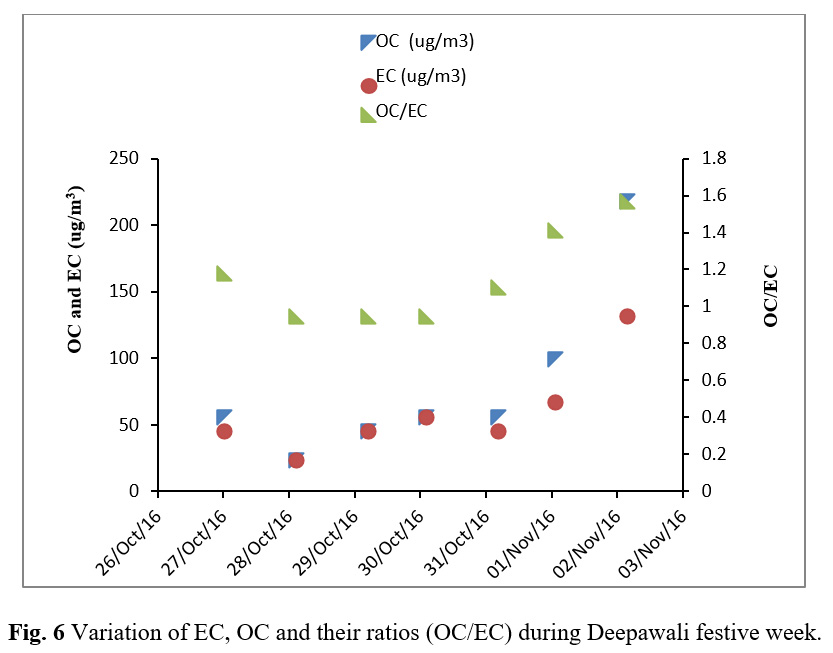
Table 4 reports the EC and OC results obtained from the Thermal/Optical Analyzer. Figure 5 shows the variation of EC, OC and TC during Deepawali festive week. Figure 6 depicts that although OC and EC concentrations were found to be raised during the festive week but their ratio remains constant corroborating that their sources were common. Correlation study as shown in Table 5 shows a strong association of OC and EC having a high correlation coefficient (r=0.99). The high correlation coefficient between OC and EC indicates their co-emission from burning of crackers and sparkles. The OC and EC ratio was found to be decreasing to the lowest value of 0.96 till the day of Deepawali and further increased gradually after Deepawali (Figure 6).
Table 4: Concentration of OC, EC and TC During Deepawali Festive Week
|
DATE |
OC (ug/m3) |
EC (ug/m3) |
TC (ug/m3) |
|
27-Oct-2016 |
56.2 |
46.2 |
102.4 |
|
28-Oct-2016 |
31.4 |
31.4 |
62.8 |
|
29-Oct-2016 |
46.8 |
46.3 |
93.1 |
|
30-Oct-2016 |
57.5 |
59.9 |
117.4 |
|
31-Oct-2016 |
59.9 |
54.0 |
113.9 |
|
01-Nov-2016 |
99.8 |
70.6 |
170.3 |
|
02-Nov-2016 |
225.0 |
138.4 |
363.4 |
|
|
Figure 5: Variation of EC, OC and TC during Deepawali festive week |
|
|
Figure 6: Variation of EC, OC and their ratios (OC/EC) during Deepawali festive week |
Correlations
Table 5 shows the Pearson’s correlation coefficients between various chemical species found in the aerosol samples. The PM10 had a strong correlation with OC (r=0.77), EC (r=0.85) and S (r=0.85), which fairly justified their emission from fireworks during Deepawali celebration because charcoal and sulphur are used in crackers as fuel and reducing agents. A very strong correlation of K with Al (r=0.92) and S (r=0.83) as well as of Fe with Ca (r=0.94) was observed during Deepawali festival week. Enhanced concentrations of typical fireworks elements S, Al, and K observed during the fireworks display on Deepawali and post Deepawali as well as their correlation also justified their emission from the fireworks display.
Table 5: Correlation Matrix Between Various Chemical Species
|
|
PM10 |
OC |
EC |
K |
S |
Fe |
Cl |
Ca |
Al |
|
PM10 |
1 |
|
|
|
|
|
|
|
|
|
OC |
.774* |
1 |
|
|
|
|
|
|
|
|
EC |
.846* |
.990** |
1 |
|
|
|
|
|
|
|
K |
.478 |
-.167 |
-.041 |
1 |
|
|
|
|
|
|
S |
.852* |
.382 |
.493 |
.825* |
1 |
|
|
|
|
|
Fe |
-.572 |
-.254 |
-.361 |
-.507 |
-.539 |
1 |
|
|
|
|
Cl |
.239 |
.527 |
.486 |
-.222 |
.062 |
.326 |
1 |
|
|
|
Ca |
-.531 |
-.063 |
-.186 |
-.722 |
-.619 |
.937** |
.293 |
1 |
|
|
Al |
.435 |
-.146 |
-.024 |
.917** |
.743 |
-.635 |
-.388 |
-.762* |
1 |
*. Correlation is significant at the 0.05 level (2-tailed).
**. Correlation is significant at the 0.01 level (2-tailed).
Morphological Characteristics
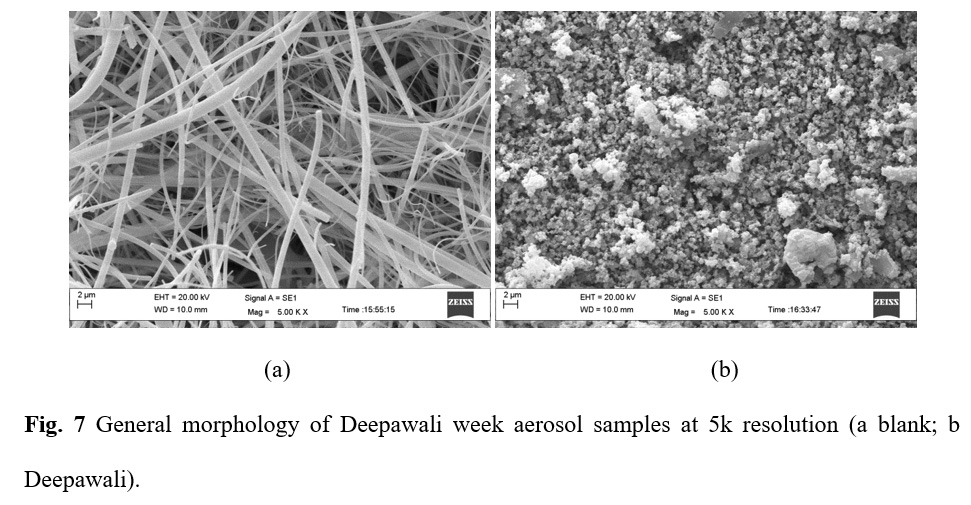
The analysis of the morphology of selected samples indicates the presence of particle sizes ranging from 0.2 μm to 11.48 μm showing the dominance of irregular shape particles having similarities with dust particles. Most of the particles were observed as the aggregates of various compounds which may be due i.) gas to particle conversion of aerosols ii.) aerosols formed by the adsorption of vapours onto the existing aerosols. Agglomeration of aerosol particles is mostly facilitated by carbonaceous and water-soluble components in it.34 Figure 7 shows the morphology of aerosol particles during Deepawali with respect to the blank. Smooth spherical particles in Figure 7 show the presence of fly-ash and aerosols originated from firework activities.35 Some of the particles are formed by the condensation of vapors. Gas to particle conversion also gives rise to such particles.36 Also, adsorption of gases onto the existing aerosols results in such shapes. 37
|
|
Figure 7: General morphology of Deepawali week aerosol samples at 5k resolution (a blank; b Deepawali) |
Conclusion
This study highlights that:
-
The huge burning of crackers and sparkles on Deepawali results in accumulation of PM10 in the atmosphere for short period of time with maximum PM10 on Deepawali night.
-
PM10 was mainly dominated by K, Al, S, Cl in descending order, which has high potential to alter air quality as well as human health. Enhanced concentrations of typical fireworks elements like Al, Ba, K, Mg, S and Ti observed during the fireworks display on Deepawali and post Deepawali and also their correlations suggested that these were contributed during fireworks display.
-
HgP concentration tends to increase until the day of Deepawali though it become non-detectable after that because of its chemistry but its presence in the atmosphere affect both air quality and human health.
-
The morphological study reveals the dominance of irregular shape particles. The complex matrix of aerosol contains aggregates of various chemical compounds.
-
These results showed that the air quality deteriorated significantly and sudden and dramatic increase in air pollution was observed during the festival period due to the fireworks display. Therefore, exposure to the short duration air pollution due to fireworks should be concerned for adverse human health effects. Hence, special activities during festivals should be considered seriously when we take measures for air quality improvement.
Acknowledgements
The authors wish to express their vote of thanks for financial support from UGC-UPEII, DST-PURSE. The authors would also like to thanks Central Instrumentation Facility (CIF), SES, JNU and Advanced Instrumentation Research Facility (AIRF), JNU, New Delhi for analytical assistance. Author Anita Kumari also acknowledges the award of Shyama Prasad Mukherjee Fellowship from CSIR.
References
-
Pope III C. A., Dockery D. W. Health effects of fine particulate air pollution: lines that connect. J. Air Waste Manage.Assoc. 2006;56:709-742.
CrossRef -
Kushwaha R., Srivastava A.., Lai H., Ghosh B., Jain V. K. Particles size distribution of aerosols and associated metals, and source estimation in Delhi, India. Sustain. Environ. Res. 2012;22(5):317-325.
-
Kulshrestha M. J., Singh R., Engardt M. Ambient and episodic levels of metals in PM10 aerosols and their source apportionment in Central Delhi, India. J. Hazard. Toxic Radioact. Waste. 2014;20:A4014002, DOI: 10.1061/(ASCE)HZ.2153-5515.0000227
CrossRef -
Sharma S. K., Sharma A., Saxena M., Choudhary N., Masiwal R., Mandal T. K., Sharma C. Chemical characterization and source apportionment of aerosol at an urban area of Central Delhi, India. Atmos. Pollut. Res. 2016;7
(1):110-121.
CrossRef -
Peden M. World report on road traffic injury prevention.2004
-
Vecchi R., Bernardoni V., Cricchio D., D’Alessandro A., Fermo P., Lucarelli F., Nava S., Piazzalunga A., Valli G. The impact of fireworks on airborne particles. Atmos. Environ. 2008;42:1121-1132.
CrossRef -
Drewnick F., Hings S. S., Curtius J., Eerdekens G., Williams J. Measurement of fine particulate and gas-phase species during the New Year's fireworks 2005 in Mainz, Germany. Atmos. Environ. 2006;40:4316-4327.
CrossRef -
Bach W., Daniels A., Dickinson L.., Hertlein F., Morrows J., Margolis S., Dinh V. D. Fireworks pollution and health. Int. J. Environ. Stud. 1975;7:183-192.
CrossRef -
Devara P. C., Vijayakumar K., Safai P. D., Made P. R., Rao P. S. Celebration-induced air quality over a tropical urban station, Pune, India. Atmos. Pollut. Res. 6: 511-520.
CrossRef -
Attri A. K., Kumar U., Jain V. K. Microclimate: formation of ozone by fireworks. Nature. 2001;411:6841:1015.
CrossRef -
Babu S. S., Moorthy K. K. Anthropogenic impact on aerosol black carbon mass concentration at a tropical coastal station: A case study. Curr. Sci. 2001;81:1208-1214.
-
Kulshrestha U. C., Rao T. N., Azhaguvel S., Kulshrestha M. J. Emissions and accumulation of metals in the atmosphere due to crackers and sparkles during Diwali festival in India. Atmos. Environ. 2004;38:4421-4425
CrossRef -
Wang Y., Zhuang G., Xu C., An Z. The air pollution caused by the burning of fireworks during the lantern festival in Beijing. Atmos. Environ. 2007;41:417-431.
CrossRef -
Singh R., Chandra S., Kulshrestha M. J., Rashmi. Chemical constituents in PM10 aerosols during Diwali and Holi Festivals in Delhi. J. Ind. Geophys. Union. 2016;20:440-444.
-
Lin C.C., Tsai J. H., Huang K. L., Yeh C. K. J., Chen H. L., Chen S. J., Lee J. T., Hsieh Y. C. Characteristics of respirable particulate metals emitted by a beehive firework display in Yanshuei area of Southern Taiwan. Aerosol Air Qual. Res. 2016;16:2227–2236.
CrossRef -
Zhang Y., Wei J., Tang A., Zheng A., Shao Z., Liu X. Chemical Characteristics of PM2. 5 during 2015 Spring Festival in Beijing, China. Aerosol and Air Qual. Res. 2017;17(5):1169-1180.
CrossRef -
Khaparde V. V., Pipalatkar P. P., Pustode T., Rao C., Gajghate D. G. Influence of burning of fireworks on particle size distribution of PM10 and associated barium at Nagpur. Environ. Monit. and assess. 2012;184:903.
CrossRef -
Croteau G., Dills R., Beaudreau M., Davis M. Emission factors and exposures from ground-level pyrotechnics. Atmos. Environ. 2010;44:295-3303.
CrossRef -
Conkling J. A. Pyrotechnics. Kirk-Othmer Encyclopedia of Chemical Technology. 1996
-
Do T. M., Wang C. F., Hsieh Y. K., Hsieh H. F., Do T. M., Wang C. F., Hsieh Y. K., Hsieh H. F. Metals present in ambient air before and after a firework festival in Yanshui, Tainan, Taiwan. Aerosol Air Qual. Res. 2012;12:981–993.
CrossRef -
VA Application Work AW UK4-0183-092007 metrohm. Determination of Mercury in Potable Water.
-
Han Y., Cao J., Chow J. C., Watson J. G., An Z., Jin Z., Fung K., Liu S. Evaluation of the thermal/optical reflectance method for discrimination between char-and soot-EC. Chemosphere. 2007;69:569-574.
-
Cao J. J., Lee S. C., Ho K. F., Zou S. C., Fung K., Li Y., Watson J. G., Chow J. C. Spatial and seasonal variations of atmospheric organic carbon and elemental carbon in Pearl River Delta Region, China. Atmos. Environ. 2004;38:4447-4456.
-
Central Pollution Control Board (CPCB) Ministry of Environment & Forests, Governmnet of India, http://cpcb. nic.in/National_Ambient_Air_Quality_Standards.php. 2012.
-
Sharma D., U. C. Kulshrestha. Spatial and Temporal Patterns of Air Pollutants in Rural and Urban Areas of India. Environ. Pollut. 2014;195:276-81.
-
Chellaney B. Climate change and security in Southern Asia: understanding the national security implications. The RUSI Journal. 2007;152:62-69.
-
Kulshrestha U. Some Facts about Recent Air Pollution Problem in Delhi. Letter to the Editor. J. Indian Geophys. Union. 2015;19(3):351-352.
-
Steinhauser G., Sterba J. H., Foster M., Grass F., Bichler M. Heavy metals from pyrotechnics in New Years Eve snow. Atmos. Environ. 2008;42:8616-8622.
-
Brown J. R., Bancroft G. M., Fyfe W. S., McLean R. A. Mercury removal from water by iron sulfide minerals. An electron spectroscopy for chemical analysis (ESCA) study. Environ. Sci. Technol. 1979;13:1142-1144.
-
Justino C. I., Rocha-Santos T. A., Duarte A. C. Sampling and characterization of nanoaerosols in different environments. Trends Anal. Chem. 2011;30:554-567.
-
Forbes E. A., Posner A. M., Quirk J. P. The specific adsorption of inorganic Hg (II) species and Co (III) complex ions on goethite. J. Colloid Interface Sci. 1974;49:403-409.
CrossRef -
Kinniburgh D. G., Jackson M. L. Adsorption of mercury (II) by iron hydrous oxide gel. Soil Sci. Soc. Am. J. 1978;42:45-47.
-
Maynard A. D., Aitken R. J. Assessing exposure to airborne nanomaterials: current abilities and future requirements. Nanotoxicology. 2007;1:26-41.
CrossRef -
Pipal A. S., Kulshrestha A., Taneja A. Characterization and morphological analysis of airborne PM2.5 and PM10 in Agra located in north central India. Atmos. Environ. 2011;45:3621-3630.
CrossRef -
Pachauri T., Singla V., Satsangi A., Lakhani A., Kumari K. M. SEM-EDX characterization of individual coarse particles in Agra, India. Aerosol and Air Qual. Res. 2013;13(2):523-536.
CrossRef -
Harrison R. M., Shi J. P., Xi S., Khan A., Mark D., Kinnersley R., Yin J. Measurement of number, mass and size distribution of particles in the atmosphere. Philosophical transactions of the royal society of London A: mathematical, physical and engineering sciences. 2000;358 (1775):2567-2580.
-
Kirchstetter T. W., Corrigan C. E., Novakov T. Laboratory and field investigation of the adsorption of gaseous organic compounds onto quartz filters. Atmos. Environ. 2001;35:1663-1671.
CrossRef


