Trend Analysis of Groundwater Level Using Non-Parametric Tests in Alluvial Aquifers of Uttar Pradesh, India
Pushpendra Kumar1
, Surendra Kumar Chandniha2
, A.K. Lohani2
, Gopal Krishan2
*
 and A.K. Nema1
1
Department of Farm Engineering,
Banaras Hindu University,
Varanasi,
Uttar Pradesh
India
2
National Institute of Hydrology,
Roorkee,
247667
India
http://dx.doi.org/10.12944/CWE.13.1.05
In the present study, groundwater level trends have been evaluated using the non-parametric methods i.e., Modified Mann-Kendall (MMK) and Sen’s slope estimator during the period 1998 to 2012 at 13 locations in 4 districts of Lucknow division namely Hardoi, Laxmipur, Lucknow and Sitapur of Uttar Pradesh, India. The entire trend analysis has been verified at a significance level of 5 percent. The groundwater level trend analysis has shown negative values for 7 locations covering 54 percent area and positive values for 6 locations covering 46 percent area in pre-monsoon season. However, in post monsoon season, 4 locations covering 31 percent area exhibited negative and 9 locations covering 69 percent area revealed positive trends. The difference in the water level trends in two different seasons may be attributed to the recharge by rainfall in post-monsoon season.
Copy the following to cite this article:
Kumar P, Chandniha S. K, Lohani A. K, Krishan G, Nema A. K. Trend Analysis of Groundwater Level Using Non-Parametric Tests in Alluvial Aquifers of Uttar Pradesh, India. Curr World Environ 2018;13(1). DOI:http://dx.doi.org/10.12944/CWE.13.1.05
Copy the following to cite this URL:
Kumar P, Chandniha S. K, Lohani A. K, Krishan G, Nema A. K. Trend Analysis of Groundwater Level Using Non-Parametric Tests in Alluvial Aquifers of Uttar Pradesh, India. Curr World Environ 2018;13(1). Available from: http://www.cwejournal.org?p=1075/
Download article (pdf)
Citation Manager
Publish History
Introduction
Agriculture is the most important sector of Indian economy contributing about 18 percent to the Gross Domestic Product (GDP). India has about 61% net irrigated agricultural area playing a vital role in food security of the country.12, 46 Groundwater is one of the most used water sources for irrigation. Introduction of contemporary drilling techniques, electrical controlled pumping systems, nominal cost of electricity and groundwater legislation rules are not fully promised in the agriculturally advanced regions of the country. The major cause of depletion of fresh groundwater resources and increase of grey and dark areas in India are related to large scale population, exploitation in agricultural sector and changes in land use patterns for urbanization.13,34 In India, most of the states i.e., Delhi, Punjab, Haryana, Rajasthan, Uttar Pradesh, Gujarat, Tamil Nadu, Karnataka and Andhra Pradesh are suffering with groundwater depletion problem due to over extraction and mismanagement of water resources. However, fresh groundwater resources are finite entity13 but in recent past, it was experienced that the demand of water for agricultural, domestic and industrial sectors is increasing day by day due population explosion and rapid urbanization. Hence, the other natural weather conditions i.e., precipitation, temperature, relative humidity etc. are almost similar or adverse. Due to all these issues, the groundwater table is declining from past few decades. It was also noticed that the intensive agriculture and rapid development in the industrial sector have put more pressure on available groundwater resources in the Indo-Gangetic Plains (IGP).9,27-29,34,41 This has resulted in the reduction of aquifer yield, drying of wells and ponds. However, pronounced effect can be seen in rabi season as compared to kharif season. The IGP has experienced low productivity in rabi season due to mismanagement of water resources and depletion of groundwater levels.5 Any kind of technical studies are usually based on historical database related to the cyclic behavior of weather parameters. In the study of sustainable development and utilization of groundwater resources, it is required to know the behavior of historical climatic parameters and their trends. Sustainable groundwater resources assessment and mitigation for future prospective can be estimated by time series analysis of historical datasets. Time series analysis and its inter-annual variability is dependent upon weather conditions and geographical features. The trend analysis can be utilized for detecting the trend in long-term observed historical time series of groundwater level and its seasonal inter-variability over the specific duration. Further, it can be utilized for planning and mitigation aspects.14,20 One of the best techniques for trend analysis using non-parametric method is Mann-Kendall test, and further its modified version named as Modified Mann-Kendall test.26,35 In recent past studies, it was also experienced that Mann Kendall test extensively used for analyzing the trend of hydro-meteorological parameters.8,28,40,42,47 Stochastic analysis of time series has also been performed by various researchers.1,22,31,45 Temporal time series of groundwater level trend is estimated by Allen (2010), in coastal British Columbia of Canada using the nonparametric Spearman’s rank correlation coefficient.2 Gehrels et al., (1994)18 analyzed the fluctuations in surface water and groundwater levels in the, and have reported that the groundwater levels have declined over the wide area due to the drainage, drought and excess overdraft by the farmers. A non-parametric time series decomposition technique to determine trends and seasonality in groundwater levels in the Ganges-Brahmaputra-Meghna delta in Bangladesh.45 Both non-parametric Mann-Kendall trend test and Sen’s slope estimator were applied for groundwater trend estimation of Holocene unconfined aquifer (HUA) in Hanoi.25 Tabari et al. (2012)49 investigated the temporal trends in annual, seasonal and monthly groundwater level fluctuations during 1985–2007 for north Iran using the Mann-Kendall test and the Sen’s slope estimator.49 Various researchers have reported similar type of studies worldwide i.e., Canada,15 Netherlands,18 Kuwait,4 Taiwan,23 Korea,33 China,55 Bangladesh,44 Iran.47 In India, Thakur and Thomas (2011) used the non-parametric Kendall rank correlation test and the parametric linear regression test for detecting trend in the seasonal groundwater levels of Sagar district.51 Similar studies have been carried out in Gujrat37 and Orissa.38 The results of such studies generally indicated mixed combination of negative and positive trends in the groundwater level time-series. However, best management practices need to be implemented for groundwater conservation as well as protection. So far, no such study has been carried out in the fertile alluvial aquifers of Indo-Gangetic plains in India. Therefore the data of the groundwater levels of four districts viz. Hardoi, Lakhimpur, Lucknow and Sitapur are utilized in the present study for the estimation of groundwater level trends using the non-parametric methods.
Material and Methods
Study Area
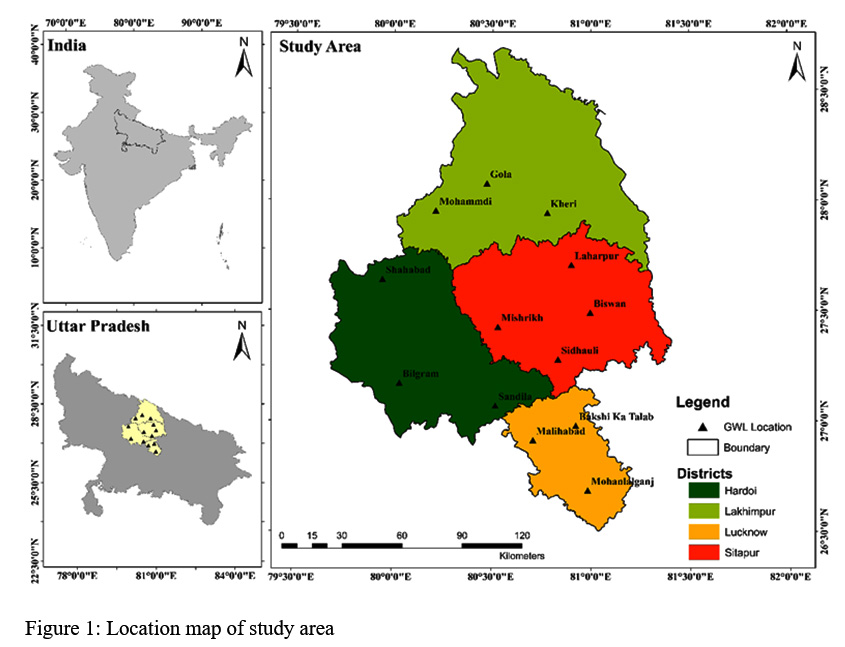
The region of Indo-Gangetic plain is considered as most fertile land for agriculture purpose. Entire Uttar Pradesh state falls under the Indo-Gangetic Plain region. The Uttar Pradesh state is bound by Nepal on the North, Himachal Pradesh on the northwest, Haryana on the west, Rajasthan on the southwest, Madhya Pradesh on the south and south- west and Bihar on the east. The state spreads between 23°52' N and 31°28' N latitudes and 77°3' and 84°39' E longitudes. The lnad of the study area has the dominance of deep silty-loam soils, which are most suitable for agriculture production. The study area zone receives a e large amount of fresh water from the snow/glacier melting from the Himalayas. This water is responsible for groundwater recharge in the region. In the present study, thirteen locations were considered for groundwater level trend analysis under four districts namely as Hardoi, Lakhimpur Kheri, Lucknow and Sitapur. The location map of the study area is shown in Figure 1.
|
|
Figure 1: Location map of study area |
Data
Groundwater level data sets of pre-monsoon and post-monsoon seasons for the period 1998-2012 have been acquired from Central Ground Water Board (CGWB). Consistency of data has been checked by double mass curve technique before using the raw data. The entire data sets are segregated by two-part i.e., pre-monsoon and post-monsoon time step. The Location details of groundwater level stations are illustrated in Table 1.
Table 1: Location Details of Groundwater Level Station
|
District |
Location of GWL Station |
Latitude |
Longitude |
|
Hardoi |
Bilgram |
27.1735° N |
80.0339° E |
|
Sandila |
27.0729° N |
80.5179° E |
|
|
Shahabad |
27.6441° N |
79.9447° E |
|
|
Lakhimpur |
Gola |
28.0786° N |
80.4716° E |
|
Kheri |
27.9462° N |
80.7787° E |
|
|
Mohammdi |
27.9547° N |
80.2135° E |
|
|
Lucknow |
Bakshi Ka Talab |
26.9834° N |
80.9235° E |
|
Malihabad |
26.9168° N |
80.7076° E |
|
|
Mohanlalganj |
26.6895° N |
80.9843° E |
|
|
Sitapur |
Biswan |
27.4938° N |
80.9965° E |
|
Laharpur |
27.7101° N |
80.9014° E |
|
|
Mishrikh |
27.4293° N |
80.5300° E |
|
|
Sidhauli |
27.2821° N |
80.8344° E |
Mann-Kendall Test (MK Test)
The Mann–Kendall test26,35 is a non-parametric test, which does not require the data to be distributed normally. The second advantage of the test is its low sensitivity to abrupt breaks due to inhomogeneous time series.48 MK test has been widely used by various researchers for detecting the trends in rainfall.30,35,39 The non-parametric Mann-Kendall (MK) statistical test has been popularly used to assess the significance of the trend in hydrological time series. The test requires sample data to be serially independent.53,54
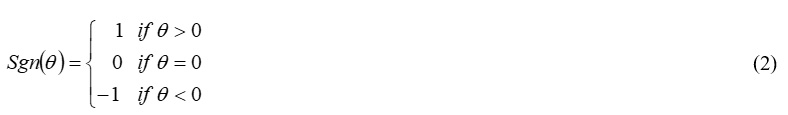
The MK statistic, S, is defined as:
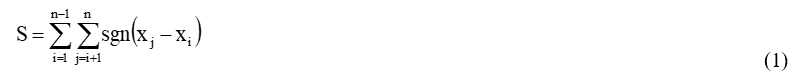
x1,x2,x3....xn represents n data points where data points where xj represents the data point at the timej of data (time series); and xj-xi= Ø
Under the assumption that the data are independent and identically distributed, the mean and variance of the S statistic in Eq. (2) are given by Kendall (1975)26 as (Dinpashoh et al., 2011).16
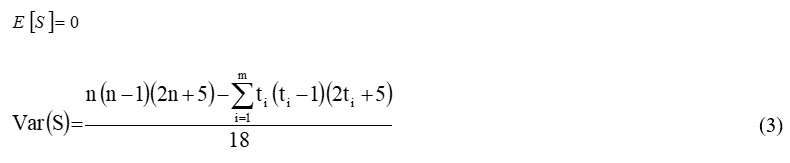
where m is the number of groups of tied ranks, each with ti tied observations. The original MK statistic, designated by Z and the corresponding P-value (p)of the one-tailed test was computed as:
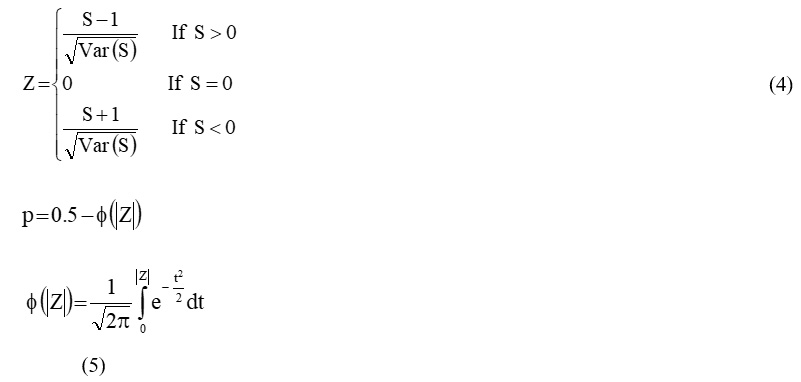
If the p-value is small enough, the trend is quite unlikely to be caused by random sampling. The Z values are approximately normally distributed, and a positive Z value larger than 1.96 (based on normal probability tables) denotes a significant increasing trend at the significance level of 0.05, whereas a negative Z value lower than -1.96 shows a significant decreasing trend.
Modified Mann Kendall Test (MMK Test)
In Modified Mann-Kendall test, the effect of all significant autocorrelation coefficients is removed from a data set.19 For this purpose, a modified variance of S, designated as Var(S)*, was used as follows:

where, n*= effective sample size. The n/n* ratio was computed directly from the equation proposed by Hamed and Rao (1998)19 as
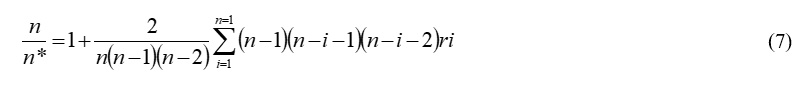
where, n= actual number of observations: and ri=lag-i significant autocorrelation coefficient of rank i of time series. Once Var(s)* was computed from Eq. (6), then it is substituted for Var(S) in Eq. (4). Finally, the Mann-Kendall Z was tested for significance of trend comparing it with threshold levels at 5% level of significance is about 1.96.
Sen’s Slope Estimator
If a linear trend is present in a time series, then the true slope (change per unit time) can be estimated using a simple nonparametric procedure developed by Sen (1968).43 It has been widely used for determining the magnitude of the trend in hydro-meteorological time series48,50. In this method, the slope estimates of N pairs of data are first calculated using the following expression as:

where, xj and xk are data values at time j and k (j>k) respectively. The median of these N values of Qi is sen’s estimator of slope which is calculated as:
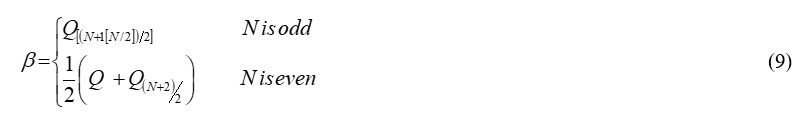
A positive value of B indicates an upward (increasing) trend and a negative value indicates a downward (decreasing) trend in the time series data.
Inverse Distance Weighted (IDW)
In the present study, the inverse distance weighted (IDW) interpolation technique has been used for the spatial maps using preparation of coefficient of variation in groundwater levels during pre-monsoon and post-monsoon season.32,48 The inverse distance weighting tool is already available in ArcMap 10.4. In the IDW methodology, the weight of any known point is set to be inversely proportional to its distance from the estimated point. It is calculated as follows:
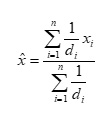
where:x = value to be estimated; xi = known value; d1, d2, d3, …, dn = distance from the n data points to the point estimated n.
Results
Continuous records of pre-monsoon and post-monsoon groundwater levels are important parameters to study the water table fluctuation trends. The differences between pre-monsoon and post-monsoon water levels, represents the combined effect of groundwater recharge and draft in a region. The Z-statistics value of MMK test has been presented at 5 percent level of significance (Table 3). However, there are four major cases i.e., negative significant, negative, positive, and positive significant and values are less than -1.96, -1.96 to 0, 0 to 1.96 and more than 1.96, respectively. The Sen’s slope estimator values are indicating the magnitude of GWL fluctuations for rising or declining trends.
Pre-processing
In any time series analysis, pre-processing of raw data is necessary step. However, in present study, various missing values were presented in raw data. Proper gap filling of missing data are required, so the double mass curve technique has been utilized for filling missing value and the data consistency was checked accordingly. Further, entire time series segregated into two parts e.g., pre-monsoon and post-monsoon during 1998 to 2012. Further, general statistical parameters i.e., mean, standard deviation and coefficient of variation have been for each station for both pre-monsoon and post-monsoon periods. Further, each time series has been treated as separate set for the analysis of MMK test and for estimating Sen’s slope.
Statistical Analysis
In the present study, mean, standard deviation (SD) and coefficient of variation (CV) have been calculated for all the sites during pre-monsoon and post-monsoon seasons. In pre-monsoon season, the values of mean, SD and CV are varying from 4.29 m (Gola) to 8.48 m (Malihabad), 0.45 (Shahabad) to 2.46 (Malihabad) and 7.79 % (Shahabad) to 28.98 % (Malihabad) respectively. Whereas, in post monsoon season it falls 2.84 m (Gola) to 6.33 m (Bakshi Ka Talab), 0.52 (Gola) to 1.69 (Malihabad) and 14.42 % (Shahabad) to 27.43 % (Malihabad) respectively. The detailed station-wise GWL fluctuations and its statistics are presented in Table 2.
Table 2: General statistics of Groundwater levels during 1998 to 2012
|
District |
Block |
Station |
Pre-Monsoon |
Post-Monsoon |
||||
|
Mean |
SD |
CV |
Mean |
SD |
CV |
|||
|
Hardoi |
Bilgram |
Bilgram |
7.41 |
1.33 |
17.91 |
5.76 |
1.22 |
21.20 |
|
Sandila |
Sandila |
5.16 |
0.61 |
11.87 |
3.41 |
0.82 |
24.07 |
|
|
Shahabad |
Shahabad |
5.71 |
0.45 |
7.79 |
4.46 |
0.64 |
14.42 |
|
|
Lakhimpur |
Gola |
Gola |
4.29 |
0.75 |
17.43 |
2.84 |
0.52 |
18.33 |
|
Kheri |
Kheri |
4.85 |
0.79 |
16.19 |
3.28 |
0.58 |
17.51 |
|
|
Mohammdi |
Mohammdi |
5.80 |
0.56 |
9.71 |
4.44 |
0.76 |
17.08 |
|
|
Lucknow |
Bakshi Ka Talab |
Bakshi Ka Talab |
8.25 |
0.78 |
9.41 |
6.33 |
1.35 |
21.31 |
|
Malihabad |
Malihabad |
8.48 |
2.46 |
28.98 |
6.16 |
1.69 |
27.44 |
|
|
Mohanlalganj |
Mohanlalganj |
7.22 |
0.95 |
13.14 |
5.72 |
1.16 |
20.27 |
|
|
Sitapur |
Biswan |
Biswan |
4.44 |
0.78 |
17.49 |
3.61 |
0.68 |
18.92 |
|
Laharpur |
Laharpur |
4.33 |
0.81 |
18.77 |
3.06 |
0.81 |
26.39 |
|
|
Mishrikh |
Mishrikh |
5.81 |
0.62 |
10.64 |
4.24 |
0.73 |
17.25 |
|
|
Sidhauli |
Sidhauli |
7.31 |
0.64 |
8.71 |
5.24 |
0.89 |
16.94 |
|
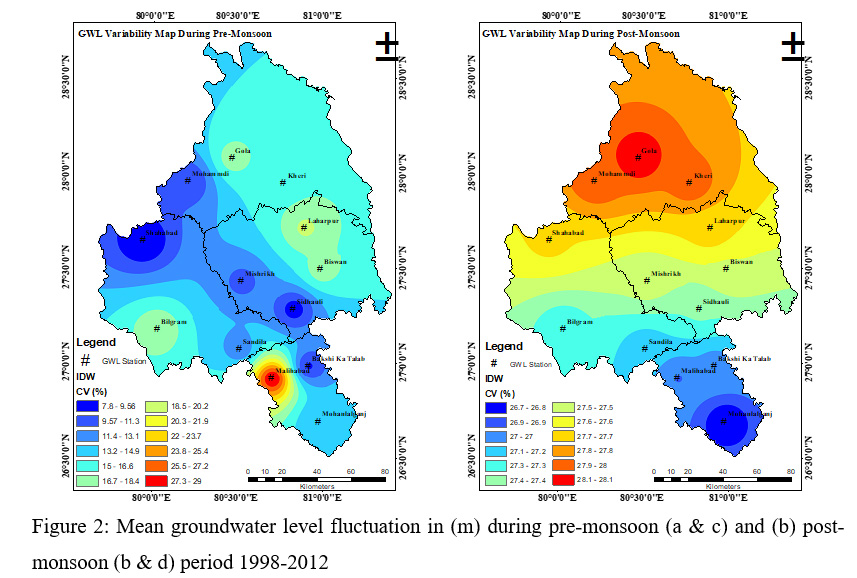
Spatial Analysis of CV Values of GWL
In this section spatial maps have been prepared on the basis of mean GWL and CV (%) values of all station during 1998 to 2012. Initially, spatial maps have been prepared for pre-monsoon and post monsoon periods using Inverse Distance Weightage (IDW) technique and ArcMap 10.4 software shown in Figure 2 (a) & (b). Furthermore, spatial map of GWL fluctuation on the basis of CV (%) values during pre-monsoon and post-monsoon seasons have been illustrated in Figure 2 (c) & (d).
|
|
|
Groundwater Level Trend Analysis During 1998-2012
Results of Modified Mann Kendall
In present study, results are estimated by two parts - pre-monsoon and post-monsoon. In pre-monsoon season out of 13 stations, 7 locations are showing negative and remaining 6 are positive. However, the magnitude of GWL varies from -0.108 m/yr (Bilgram station of Hardoi) to 0.295 m/yr (Malihabad station of Lucknow). Whereas, in post-monsoon season out of 13 stations, 4 locations are showing negative and remaining 9 are positive trend. However, the magnitude of GWL varies from -0.228 m/yr (Bakshi Ka Talab station of Lucknow) to 0.234 m/yr (Malihabad station of Lucknow).
Z-statistics of entire 13 locations during pre-monsoon season varies from -3.107 to 2.926. In pre-monsoon season, 7 locations are showing declining trend and remaining 6 are showing rising trend. However, out of them Gola and Mohammdi stations are showing significant declining trend and Malihabad and Laharpur station are showing significant rising trends at 5% level of significance, respectively. In post-monsoon season, 4 locations are showing declining and remaining 9 are showing rising trend. However, out of them Bakshi Ka Talab station is showing significant negative trend and, Malihabad, Laharpur and Mishrikh stations are showing significant positive trends at 5% level of significance, respectively. The overall result of MMK test and Sen’s slope is summarized in Table 3.
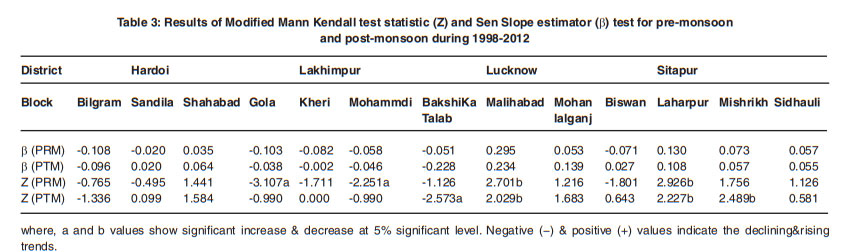 |
Table 3: Results of Modified Mann Kendall test statistic (Z) and Sen Slope estimator (β) test for pre-monsoon and post-monsoon during 1998-2012 Click here to view table |
Discussion
Pre-monsoon and post-monsoon mean groundwater level fluctuations varied from 4.29 to 8.48 and 2.84 to 6.33, respectively. Malihabad and Bakshi Ka Talab location of Lucknow district had maximum groundwater extraction in both pre and post monsoon periods. Hence, it varies from 7.79 to 8.48 and 5.76 to 6.33 in pre and post monsoon seasons, respectively. As compared to all the stations, south and south-western zone were identified as groundwater depletion zones. The overall water demand of Lucknow and Hardoi is greater due to the slightly higher populations of 45,88,455 and 40,91,380, respectively (Census, 2011) as compared to Sitapur and Lakhimpur Kheri district having populations 44,74,446 lakhs and 40,21,243 lakhs, respectively (Census, 2011).11 The rising trends indicate an increasing depth of water level from ground surface and declining trend indicates the decreasing depth of water level from the ground surface. Hence, most of the location of Lucknow and Sitapur are showing the significant rising trend(s) that means the groundwater table is declining in these locations due to over extraction of groundwater.
Conclusions
Long term groundwater fluctuation trends indicate the effect of groundwater withdrawal and recharge on changes in water stored in aquifer, which is required for assessing the groundwater potential available for utilization. Modified Mann-Kendall test performed on time series data of pre-monsoon groundwater levels in various district of Uttar Pradesh showed significantly increasing trend (increasing depth of water level from ground surface) in pre -monsoon groundwater levels during 1998-2013 and post-monsoon ground water levels showed significantly increasing trend (increasing depth of water level from ground surface) in post- monsoon during 1998-2012. The magnitude of GWL varies from -0.108 m/yr (Bilgram station of Hardoi) to 0.295 m/yr (Malihabad station of Lucknow) during pre-monsoon and magnitude of GWL varies from -0.228 m/yr (Bakshi Ka Talab station of Lucknow) to 0.234 m/yr (Malihabad station of Lucknow) during post-monsoon. Most of the locations of Locknow and Sitapur showed the significant rising trend(s) that means the groundwater table is getting down at these locations due to over extraction of ground water. Hence, the best management strategies are needed to conserve the groundwater storage at particular places. The study revealed that the MMK test is an appropriate tool to identify the historical trends of groundwater level changes. The results from the study can be useful for planning and managing the water resources, agriculture and sustainable development of the state. Also, such findings are important for any strategic planning for future.
References
-
Adamowski K., Hamory T. A stochastic systems model of groundwater level fluctuations. Journal of Hydrology. 1983;62(1-4),129-141.
CrossRef -
Allen D. M. Historical trends and future projections of groundwater levels and recharge in costal British Columbia, Canada. Azores, Portugal SWIM, Salt Water Intrusion meeting. 2010;21-26:267-270.
-
Allen D. M. Historical trends and future projections of groundwater levels and recharge in costal British Columbia, Canada. Azores, Portugal SWIM. 2010;21-26.
-
Almedeij J., Al-Ruwaih F. Periodic behavior of groundwater level fluctuations in residential areas. Journal of Hydrology, 2006;328(3-4):677-684.
CrossRef -
Ambast S. K., Tyagi N. K., Raul S. K. Management of declining groundwater in the Trans Indo-Gangetic Plain (India): some options. Agricultural Water Management. 2006;82(3):279-296.
CrossRef -
Arora M., Goel N. K.., Singh P. Evaluation of temperature trends over India/Evaluation de tendances de température en Inde. Hydrological sciences journal. 2005;50(1).
CrossRef -
Aziz O. I. A., Burn D. H. Trends and variability in the hydrological regime of the Mackenzie River Basin. Journal of hydrology. 2006;319(1-4), 282-294.
CrossRef -
Bandyopadhyay A., Bhadra A., Raghuwanshi N. S., Singh R. Temporal trends in estimates of reference evapotranspiration over India. Journal of Hydrologic Engineering. 2009;14(5):508-515.
CrossRef -
Bonsor H. C., MacDonald A. M., Ahmed K. M., Burgess W. G., Basharat M., Calow R. C., Dixit A., Foster S. S. D., Gopal K., Lapworth D., Lark R. M., Moench M., Mukherjee A., Rao M. S., Shamsudduha M., Smith L., Taylor R., Tucker J., van Steenbergen F., Yadav S. K. Hydrogeological typologies of the Indo-Gangetic basin alluvial aquifer, South Asia. Hydrogeology Journal. 2017. DOI: 10.1007/s10040-017-1550-z.
CrossRef -
Burn D. H., Elnur M. A. H. Detection of hydrologic trends and variability. Journal of hydrology. 2002;255(1-4):107-122.
CrossRef -
Census. http://opengovernanceindia.org/leapaf/district-wise-population-in-india-2011-census. 2011.
-
Central Water Commission. Water and related statistics. Information Systems Organization, Water Planning and Project Wing, Central Water Commission, New Delhi, India. 2000.
-
CGWB Groundwater year book India. Central Ground Water Board Ministry of Water Resources Government of India Faridabad. 2012;1-63.
-
Chen H., Guo S., Xu C. Y., Singh V. P. Historical temporal trends of hydro-climatic variables and runoff response to climate variability and their relevance in water resource management in the Hanjiang basin. Journal of hydrology. 2007;344(3-4):171-184.
CrossRef -
Chen Z., Grasby S. E., Osadetz K. G. Relation between climate variability and groundwater levels in the upper carbonate aquifer, southern Manitoba, Canada. Journal of Hydrology. 2004;290(1-2):43-62.
CrossRef -
Dinpashoh Y., Jhajharia D., Fakheri-Fard A., Singh V. P., Kahya E. Trends in reference evapotranspiration over Iran. Journal of Hydrology. 2011;399: 422–433.
CrossRef -
Gan T. Y. Hydroclimatic trends and possible climatic warming in the Canadian Prairies. Water resources research. 1998;34(11):3009-3015.
-
Gehrels J. C., Van Geer F. C., De Vries J. J. Decomposition of groundwater level fluctuations using transfer modelling in an area with shallow to deep unsaturated zones. Journal of Hydrology. 1994;157(1-4):105-138.
-
Hamed K. H., Rao A. R. A modified MannKendall trend test for auto corelated data. Journal of Hydrology. 1998;204:182–196.
CrossRef -
Helsel D. R., Hirsch R. M. Statistical methods in water resources. Elsevier. 1992;49.
CrossRef -
Hirsch R. M., Slack J. R. A nonparametric trend test for seasonal data with serial dependence. Water Resources Research. 1984;20(6):727-732.
CrossRef -
Houston J. F. T. Groundâ€Water Systems Simulation by Timeâ€Series Techniques. Groundwater, 1983;21(3):301-310.
CrossRef -
Jan C. D., Chen T. H., Lo W. C. Effect of rainfall intensity and distribution on groundwater level fluctuations. Journal of hydrology. 2007;332(3-4):348-360.
CrossRef -
Kampata J. M., Parida B. P., Moalafhi, D. B. Trend analysis of rainfall in the headstreams of the Zambezi River Basin in Zambia. Physics and Chemistry of the Earth, Parts A/B/C. 2008;33(8-13):621-625.
CrossRef -
Kawamura A., Bui D. D., Tong T. N., Amaguchi H., Nakagawa N. Trend Detection in Groundwater Levels of Holocene Unconfined Aquifer in Hanoi, Vietnam, by Non-Parametric Approaches. In World Environmental and Water Resources Congress 2011: Bearing Knowledge for Sustainability. 2011;914-923.
-
Kendall M. G. Rank correlation methods, Griffin, London. 1955.
-
Krishan., Gopal., Singh., Surjeet., Khanna., Anurag., Singh R. P., Ghosh N. C. Current groundwater conditions in alluvial gangetic plains of Haridwar district, Uttarakhand, India. Current World Environment. 2016;11(3):737-742.
-
Krishan Gopal., Chandniha., Surendra., Lohani A. K. Rainfall trend analysis of Punjab, India using statistical non-parametric test. Current World Environment. 2015;10(3):792-800.
-
Krishan., Gopal., Rao., M. S., Loyal R. S., Lohani A. K., Tuli N. K., Takshi K. S., Kumar C. P., Semwal P., Kumar Sandeep. Groundwater level analyses of Punjab, India: A quantitative approach. Octa Journal of Environmental Research. 2014;2(3):221-226.
-
Kumar V., Jain S. K.., Singh Y. Analysis of long-term rainfall trends in India. Hydrological Sciences Journal–Journal des Sciences Hydrologiques. 2010;55(4):484-496.
-
Law A. G. Stochastic analysis of groundwater time series in the western United States, Hydrology paper no. 68. Colorado State University, Fort Collins, Colorado, USA. 1974;26.
-
Lebel T. G., Bastin G., Obled C., Creutin J. D. On the accuracy of areal rainfall estimation: a case study”. Water Resources Research. 1987;23:2123–2134.
-
Lee J. Y., Yi M. J., Moon S. H., Cho M., Won J. H., Ahn K. H., Lee J. M. Causes of the changes in groundwater levels at Daegu, Korea: the effect of subway excavations. Bulletin of Engineering Geology and the Environment. 2007;66(3):251-258
-
MacDonald., Alan., Bonsor., Helen., Ahmed., Kazi., Burgess., William., Basharat., Muhammad., Calow., Roger., Dixit., Ajaya., Foster., Stephen., Krishan., Gopal., Lapworth., Daniel., Lark., Murray., Moench., Marcus., Mukherjee., Abhijit., Rao., M. S., Shamsudduha., Mohammad., Smith., Linda., Taylor., Richard., Tucker., Josephine., Steenbergen Frank van., Yadav., Shobha. Groundwater depletion and quality in the Indoâ€Gangetic Basin mapped from in situ observations. Nature Geosciences. 2016;9:762-766.
-
Mann H. B. Nonparametric tests against trend. Econometrica: Journal of the Econometric Society. 1945;245-259.
-
Mondal A., Kundu S., Mukhopadhyay A. Rainfall trend analysis by Mann-Kendall test: A case study of north-eastern part of Cuttack district, Orissa. International Journal of Geology, Earth and Environmental Sciences. 2012;2(1):70-78.
-
Panda D. K., Mishra A., Kumar A. Quantification of trends in groundwater levels of Gujarat in western India. Hydrological Sciences Journal. 2012;57(7):1325-1336.
-
Panda D. K., Mishra A., Jena S. K., James B. K., Kumar A. The influence of drought and anthropogenic effects on groundwater levels in Orissa, India. Journal of hydrology. 2007;343(3-4):140-153.
-
Partal T., Kahya E. Trend analysis in Turkish precipitation data. Hydrological processes. 2006;20(9):2011-2026.
-
Patle G. T., Singh D. K., Sarangi A., Rai A., Khanna M., Sahoo R. N. Temporal variability of climatic parameters and potential evapotranspiration. Indian Journal of Agricultural Sciences. 2013;83(5):518-24.
-
Priyanka., Krishan G., Sharma L. M., Yadav B. K., Ghosh N. C. Analysis of Water Level Fluctuations and TDS Variations in the Groundwater at Mewat (Nuh) District, Haryana (India). Current World Environment. 2016;11(2):388-398.
-
Ramazanipour M., Roshani M. Seasonal trend analysis of precipitation and discharge parameters in Guilan, north of the Iran. In International Conference on Humanities, Geography and Economics (ICHGE’2011) Pattaya. 2011;290-293.
-
Sen P. K. Estimates of the regression coefficient based on Kendall’s tau. Journal of the American Statistical Association. 1968;63:1379-1389.
-
Shahid S., Hazarika M. K. Groundwater drought in the northwestern districts of Bangladesh. Water resources management, 2010;24(10):1989-2006.
-
Shamsudduha M., Chandler R. E., Taylor R. G., Ahmed K. M. Recent trends in groundwater levels in a highly seasonal hydrological system: the Ganges-Brahmaputra-Meghna Delta. Hydrol. Earth Syst. Sc. 2009;13(12):2373-2385.
-
Sharma K. D. Groundwater management for food security. Current Science. 2009;96(11):1444-1447.
-
Singh V. P., Chowdhury P. K. Comparing some methods of estimating mean areal rainfall. Water Resources Bulletin. 1986;22:275–282.
CrossRef -
Tabari H., Marofi S., Aeini A., Talaee P. H., Mohammadi K. Trend analysis of reference evapotranspiration in the western half of Iran. Agricultural and forest meteorology. 2011;151(2):128-136.
CrossRef -
Tabari H., Nikbakht J., Some’e, B. S. Investigation of groundwater level fluctuations in the north of Iran. Environmental Earth Sciences. 2012;66(1):231-243.
CrossRef -
Tabari H., Taye M. T., Willems P. Statistical assessment of precipitation trends in the upper Blue Nile River basin. Stochastic environmental research and risk assessment. 2015;29(7):1751-1761.
CrossRef -
Thakur G. S., Thomas T. Analysis of groundwater levels for detection of trend in Sagar district, Madhya Pradesh. Journal of the Geological Society of India. 2011;77(4):303-308.
-
Yue S., Wang C. Y. The Mann-Kendall Test Modified by Effective Sample Size to Detect Trend in Serially Correlated Hydrological Series. Water Resources Management. 2004;18:201-218.
CrossRef -
Zhang W., Yan Y., Zheng J., Li L., Dong X., Cai H. Temporal and spatial variability of annual extreme water level in the Pearl River Delta region, China. Global and Planetary Change. 2009;69(1-2):35-47.
CrossRef -
Zhang X., Harvey K. D., Hogg W. D., Yuzyk T. R. Trends in Canadian streamflow. Water Resources Research. 2001;37(4):987-998.
CrossRef


