Altitude and Canopy Cover Effects on Air Temperature in a Mountainous Region of Ionian Islands, Greece
Athanasios Kamoutsis1
 , Kostas Chronopoulos2
*
and Aristidis Matsoukis1
, Kostas Chronopoulos2
*
and Aristidis Matsoukis1
http://dx.doi.org/10.12944/CWE.13.3.03
Copy the following to cite this article:
Kamoutsis A, Chronopoulos K, Matsoukis A. Altitude and Canopy Cover Effects on Air Temperature in a Mountainous Region of Ionian Islands, Greece. Curr World Environ 2018;13(3). DOI:http://dx.doi.org/10.12944/CWE.13.3.03
Copy the following to cite this URL:
Kamoutsis A, Chronopoulos K, Matsoukis A. Altitude and Canopy Cover Effects on Air Temperature in a Mountainous Region of Ionian Islands, Greece. Curr World Environ 2018;13(3). Available from: https://bit.ly/2EuPHAC
Download article (pdf)
Citation Manager
Publish History

Introduction
Air temperature (T), one of the most important climatic parameters of mountain terrain in tourism industry,1 is considered as a key driver for many physical processes that influence the distribution of vegetation.2 Topography contributes greatly to the prevailing T conditions. Altitude (alt), in particular, seems to have a more distinguished influence on thermal environment in relation to other parameters, such as slope and aspect.3-5 In general, it is known that an increase of alt causes a decrease of T6 and this change is considered as a basis for the understanding of the distribution of forests over the mountainous terrain.7
Canopy cover (Pc), a key for the determination of vegetation structure,8 strongly influences the thermal environment.9,10 Specifically, higher T values were confirmed in more open canopies and by extension in forest clearings than in less open canopy locations.11 This can explain to a great extent the positive influence of forest cover on microclimatic conditions, since many forest areas are considered as attractive destinations for recreational and walking activities.
The recreational behavior of people is influenced by weather factors.12 Favorable thermal conditions that prevail in mountains are considered as a fundamental factor in decision-making13,14 related to various recreational activities of visitors, for example, hiking, walking and camping, during their vacation period. However, it is not always possible to determine the weather conditions, due to difficulties of installation and maintenance of meteorological instruments, especially at the high alts of the mountainous regions.15 Therefore, it is necessary to estimate the meteorological parameters, in particular T, by using appropriate models which include input variables related to local topography16-18 and vegetation.19
There has been no information, to our knowledge, on how topography in combination with canopy cover affect the T conditions of high alt forested areas of southeastern Europe, Greece in particular. This study aims to investigate the role of alt and Pc on T conditions in an area of great ecological importance, Mount (Mt) Aenos in Cephalonia, Ionian Islands, Greece.
Materials and Methods
Study Region and Measurement Sites
The research was carried out in Mt Aenos (including both the National Park and its greater area) on the island of Cephalonia (Municipality of Cephalonia, Regional unit of Cephalonia, Periphery of Ionian islands) in Greece, during three successive years (2011-2013), from May to October, which is the high tourist season. Mount Aenos (northwestern -southeastern orientation), the tallest mountain in the Ionian islands group, is located on the southeastern part of Cephalonia island, forming an elongated mountain range with many peaks at alts above 1,000 m.20,21 The National Park of Mt Aenos covers an area of 28,620 km2 and includes two main regions around the summits of Megas Soros and Roudi at alts of 1,627 m and 1,125 m, respectively. The areas of the aforementioned National Park are covered mainly by forests of Abies cephalonica Loudon (Cephalonian fir). There is a rich flora of endemic plant species,22 many of which are characterized as rare and endangered. It is important to note that the National Park of Mt Aenos is considered as an attractive destination for tourists from all over the world, especially during the hot season.
Twelve sites were selected in the greater area of the National Park of Mt Aenos (Table 1) based mainly on the differences in alt and canopy cover. All sites with alt above 750 m are located within the vegetation zone of Cephalonian fir, while the C1 site at lower altitude is covered mainly by sparse and low individuals of Quercus sp. The latitude, longitude and alt of each site were evaluated using a mobile Global Positioning System (Garmin eTrex Vista) and cross-checked against 1:65,000 topographic maps while the aspect was based on the estimation of azimuth.23
Table 1: Examined sites in Mount Aenos, Cephalonia Island, Greece
| Site | Latitude | Longitude | Altitude (m) |
| C1 | 38ο 07´ 38.3ËΝ | 020ο 37´ 26.0ËΕ | 250 |
| C2 | 38ο 09´ 26.7ËΝ | 020ο 40´ 06.3ËΕ | 758 |
| C3 | 38ο 11´ 28.5ËΝ | 020ο 35´ 50.5ËΕ | 775 |
| C4 | 38ο 11´ 38.9ËΝ | 020ο 36´55.0ËΕ | 816 |
| C5 | 38ο 08´ 22.8ËΝ | 020ο 41´ 52.4ËΕ | 827 |
| C6 | 38ο 08´ 12.3ËΝ | 020ο 41´ 56.9ËΕ | 1037 |
| C7 | 38ο 09´ 38.3ËΝ | 020ο 37´ 25.0ËΕ | 1100 |
| C8 | 38ο 07´ 30.3ËΝ | 020ο 42´ 14.6ËΕ | 1100 |
| C9 | 38ο 11´ 13.4ËΝ | 020ο 36´ 56.0ËΕ | 1107 |
| C10 | 38ο 09´ 14.9ËΝ | 020ο 38´ 30.0ËΕ | 1300 |
| C11 | 38ο 07´ 37.3ËΝ | 020ο 41´ 50.1ËΕ | 1300 |
| C12 | 38ο 07´ 49.6ËΝ | 020ο 41´ 11.8ËΕ | 1400 |
Instrumentation, Data Collection and Processing
Air temperature data were recorded continually every 10 minutes by sensors with data loggers (Hobo Pro v2 U23-001, Onset Computer Corporation, USA, accuracy ± 0.2 oC over 0 oC to 50 oC). Each sensor was located in each measurement site, during May-October of 2011-2013, in order to evaluate the prevailing thermal conditions in the study region. In order to assure the reliable operation of the instruments both appropriate checks in the laboratory and in situ tests were carried out in agreement with the methods of other studies.24,25
It is pointed out that in the warm Mediterranean environments, visitors are looking for locations with cool thermal conditions during the summer, from 11:00 to 17:00 h, during which the daily maximum air temperature (Tx) is reached.26 Also, the investigation of parameters that improve the thermal conditions is a basic prerequisite for increasing the number of visitors to a National Park and in particular to Mt. Aenos. Thus, in our research, from the initial T data, daily Tx was taken into account for the calculation of mean Tx values for each site for the whole period examined.
For the estimation of Pc as an indicator of horizon limitation (%) in the fisheye view of the canopy, images were collected using a Cool Pix 4500 Nikon digital camera (maximum resolution 4.0 megapixel, 4x zoom, Nikon Corporation, Japan) with Nikon FC-E8 lens (0.21x zoom). This camera was placed directly upwards and aligned on a tripod at the level where each sensor with data logger was installed. In total, nine sampling images were taken at each measuring point, the first one right at each measurement site and the rest eight images around it, in a radius of 50 m and at equal distances between successive images (Fig. 1a). For the estimation of the horizon limitation the images (Fig. 1b) were analyzed using the Rayman software. This software detected the amount of the visible sky indicating thus the shading levels of various vegetated areas.27 The Pc value for each site was calculated as an average value of the nine images.
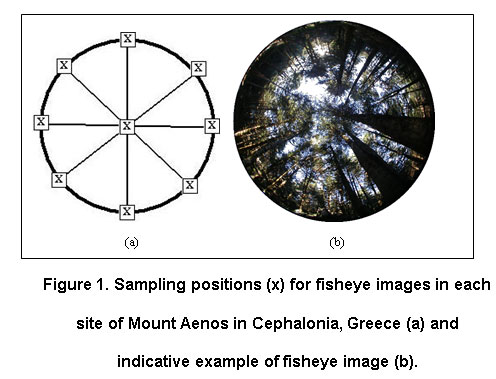 |
Figure 1: Sampling positions (x) for fisheye images in each site of Mount Aenos in Cephalonia, Greece (a) and indicative example of fisheye image (b). |
Statistical Analysis
As a first step, for the detection of possible relationships between Tx, alt, Pc and aspect, a linear correlation (Pearson’s) analysis28 was applied including all the sites examined during the study period. From this analysis, significant correlations were confirmed between alt and Tx as well as between Pc and Tx (p<0.05) with no significance (p>0.05) in the rest of the cases.
Thus, this first statistical approach led to the conduction of a multiple linear regression analysis,29 with Tx as the dependent variable and alt and Pc as the independent variables.
In addition, the two-sample t test for correlated data29,30 was used for the detection of possible differences of Tx of the whole examined period between sites with same or similar alt and different Pc. Statistics were applied using IBM SPSS Statistics 23 and MS Excel 2010 with results to be considered significant at p≤0.05.
Results and Discussion
The results of the application of the multiple regression analysis (Table 2) revealed a negative significant relationship between Tx and each of the examined independent variables (alt, Pc).
Table 2: Multiple linear correlation parameters for the mean maximum temperature (Tx) in relation to the altitude (alt) and canopy cover (Pc) in the study region of Mount Aenos, Cephalonia, Greece during the period 2011-2013 [Tx= b1∙alt +b2∙Pc].
| b1 | SE(b1) | b2 | SE(b2) | R2 |
| -0.74 *** | 0.01 | -0.42 *** | 0.01 | 0.96 |
b1, b2: regression coefficients, SE(b1) and SE(b2): standard errors of b1 and b2, respectively, ***: significance at p≤0.001, R2: coefficient of determination.
The higher absolute value of the regression coefficient b1 compared with b2 indicates, in general, a greater effect of alt on the prevailing Tx conditions than Pc. Τhe negative effect of alt on T has been meticulously confirmed in previous studies carried out in mountainous terrain.1,4,6,31
Regarding the cases of different Pc between two sites of similar or same alt, it seems that Pc plays a decisive negative role on their thermal conditions. Indicatively, at the sites C4 and C5 which were located at similar alts (816 m and 827 m, respectively, Table 1), Tx values of 22.2 oC and 25.8 oC were recorded, respectively. These values, with their difference (-3.6 oC) being significant (p<0.05), could be attributed mainly to the respective values of Pc which were 90% and 39% (Fig. 2). When examining higher alts, a similar pattern was noticed. Specifically, at C7 and C9 sites (1100 m and 1107 m, respectively) Tx values of 20.9 oC (89% Pc) and 23.6 oC (40% Pc) were recorded, respectively. In other words, an increase of Pc by 49.0% resulted in a significant decrease (p<0.05) of Tx by 2.7 oC (Fig. 2). As for the alt of 1300 m (C10 and C11 sites), an increase of Pc by 11.0% led to a respective significant decrease (p<0.05) of Tx by 1.0 oC (Fig. 2).
Therefore, for same or similar alts (alt difference up to 11 m), it was demonstrated that a Pc increase ranging from 11% to 51% resulted in distinctly more favorable thermal conditions.
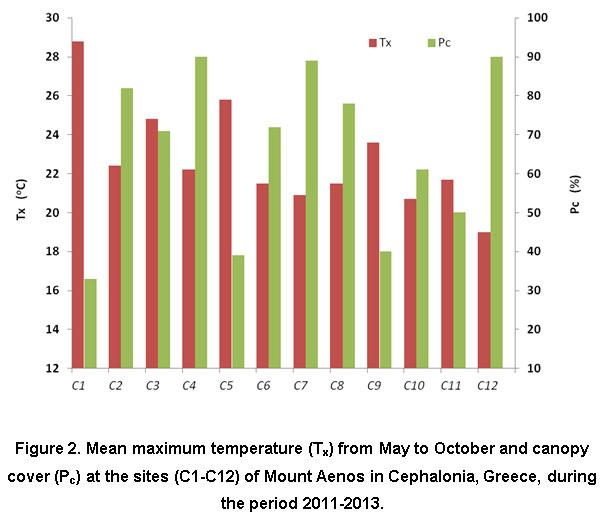 |
Figure 2: Mean maximum temperature (Tx) from May to October and canopy cover (Pc) at the sites (C1-C12) of Mount Aenos in Cephalonia, Greece,during the period 2011-2013. |
The positive role of forest vegetation on T conditions, especially during the period of April to October, has been reported in the study of Renaud and Rebetez.32 According to the results of this research, the Tx values were lower below the canopy of deciduous, conifer and mixed forests in comparison with those of open fields. In general, the forest cover effects on T have been examined in many cases of mountain terrain.11,33,34
In green spaces such as in the National Parks a visitor can enjoy locations with different microclimatic conditions. Sunny open-field and shaded closed-canopy sites are used by the visitors for their recreation and walking activities.26,35 However, at the aforementioned shaded sites, lower T values prevailed than in more open sites, which is why shaded sites are preferred by visitors during the summer.26
At the lowest alt site (C1), Tx showed its highest value (28.8 oC) during the examined period. This could be attributed to the combined effect of alt and vegetation composition. It is noted that C1, located outside the Cephalonian fir tree zone, is covered by low and sparse shrubs of Quercus sp. The above site is characterized as the most open and sunny site owing to the lowest canopy cover (33%), leading to the warmest conditions and therefore to the most unfavorable thermal environment.
Regardless of alt, the assessment of high Pc locations can become the basis for the design of recreational sites, especially in the protected forested areas. In the same way, the Pc of the adjacent locations should be taken into account for the construction of hiking trails. The open locations with low values of Pc could be improved by adding plants of the same endemic plant species, thus leading to the shading of the hiking trails. Therefore, favorable thermal conditions can be created during the summer, particularly during the hot hours of the day.
Conclusions
The analysis of the results of the present study revealed negatively significant relationships of air temperature with altitude and canopy cover during the May-October period. Furthermore, altitude showed a greater effect on the prevailing air temperature conditions rather than canopy cover. However, in cases of sites with same or similar altitude, the canopy cover determined the prevailing temperature conditions to a high degree.
In our study, an increase of canopy cover up to 51% resulted in a significant decrease of air temperature up to 3.6 oC in locations with the same or similar altitude. Thus, at more closed canopy locations, more favorable conditions are created in comparison with less closed canopy locations. This information can be crucial in planning the construction of hiking trails in mountainous forest areas of special importance, such as the National Park of Mount Aenos in Cephalonia Island, Greece.
References
- Becken S. The importance of Climate and Weather for Tourism: Literature Review. http://researcharchive.lincoln.ac.nz/bitstream/handle/10182/2920/weather_literature_review.pdf?sequence=1. February, 2010. Accessed on December 10, 2018.
- Nigrelli G., Fratianni S., Zampollo A., Turconi L. The altitudinal temperature lapse rates applied to high elevation rockfalls studies in the Western European Alps. Theor Appl Climatol. 2018; 131(3-4): 1479-1491.
CrossRef - Beniston, M. Mountain weather and climate. A general overview and a focus on climate change in the Alps. Hydrobiologia. 2006;562(1):3-16.
CrossRef - Kirchner M., Kessler-Faus T., Jakobi G., Leuchner M., Ries L., Scheel H.-E., Suppan P. Altitudinal temperature lapse rates in an alpine valley: trends and the influence of season and weather patterns. Int J Climatol. 2013;33(3):539-535.
CrossRef - Sun R., Zhang B. Topographic effects on spatial pattern of surface air temperature in complex mountain environment. Environ Earth Sci. 2016;75(7):621,1-12.
- Barry, R.G. Mountain Weather and Climate. 3rd Edition, New York, USA: Cambridge University Press. 2008.
- Wason J.W., Bevilacqua E., Dovciak M. Climates on the move: Implications of climate warming for species distributions in mountains of northeastern United States. Agric For Meteorol. 2017;246:272-280.
CrossRef - Winn, M. F. Lee S.-M., Araman P. A. ForestCrowns: A Software Tool for Analyzing Ground-based digital photographs of forest canopies. In: Miller G.W., Schuler T.M., Gottschalk K.W., Brooks J.R., Grushecky S.T., Spong B.D., Rentch J.S. eds. Proceedings 18th Central Hardwood Forest Conference. Delaware OH, USA, U.S. Forest Service Publications; https://www.nrs.fs.fed.us/pubs/gtr/gtr_nrs-p-117.pdf. Accessed on December 10, 2018.
- Potter, B.E., Teclaw R.M., Zasada J.C. The impact of forest structure on near-ground temperatures during two years of constructing temperature extremes. Agric For Meteorol. 2001; 106(4):331-336.
CrossRef - Mehta P., Baweja P.K., Aggarwal P.K. Impact of Micro-climatic variations on forest ecosystem in Mid Hills of Himachal Pradesh. Curr World Environ. 2017; 12(1): 97-106.
CrossRef - Geiger R., Aron R.H., Todhunter P. The climate near the ground. Sixth Edition. Maryland, USA: Rowman & Litlefield Publishers Inc. 2003.
- Li C., Lin S.-H. Influence of weather conditions on hiking behavior. Int J Biometeorol. 2012; 56(4):777-781.
CrossRef - Endler V., Matzarakis A. Climate and tourism in the Black Forest during the warm season. Int J Biometeorol. 2011;55(2):173-186.
CrossRef - Zaninovic K., Matzarakis A., Cegnar T. Thermal comfort trends and variability in the Croatian and Slovenian mountains. Meteorol Z. 2006;15:243-251.
CrossRef - Friedland A.J., Boyce R.L., Vostral C.B., Herrick G.T. Winter and early spring microclimate within a mid-elevation conifer forest canopy. Agric For Meteorol. 2003;115(3-4):195-200.
- Blennow K., Persson P. Modelling local-scale frost variations using mobile temperature measurements with a GIS. Agric For Meteorol. 1998;89(1):59-71.
CrossRef - Guler M., Cemek B., Gunal H. Assessment of some spatial climatic layers through GIS and statistical analysis techniques in Samsun Turkey. Meteorol Appl. 2007;14(2):163-169.
CrossRef - Guan B.T., Hsu H.-W., Wey T.-H., Tsao L.-S. Modeling monthly mean temperatures for the mountain regions of Taiwan by generalized additive models. Agric For Meteorol. 2009;149(2):281-290.
CrossRef - Greiser C., Meineri E., Luoto M., Ehrlén J., Hylander C. Monthly microclimate models in a managed boreal forest landscape. Agric For Meteorol. 2018;250-251:147-158.
- Karagianni V. Management and protection of endemic, threatened and rare plants of the Aenos National Park, Cephalonia. M.Sc. Thesis. Patras, Greece: University of Patras. 2010.
- Kamoutsis A. The climate of Mt. Aenos. In: Phitos D., Kamari G., Katsouni N., Mitsainas G., eds. The Mt. Aenos of Cephalonia Island, History Physiography Biodiversity. Kiato, Greece: Management Body of the National Park of Mt. Aenos. 2015:73-87.
- Kamari G., Mitsainas G., Xanthakis M., Lysitsa G., Karagianni V., Moschopoulou S., Minetos P., Spanou D., Ismailos G., Volteras C., Koumarioti E. The National Park of Mt. Aenos and its Management Body. In: Phitos D., Kamari G., Katsouni N., Mitsainas G., eds. The Mt. Aenos of Cephalonia Island, History Physiography Biodiversity. Kiato, Greece: Management Body of the National Park of Mt. Aenos; 2015:259-318.
- Blennow K. Modelling minimum air temperature in partially and clear felled forests. Agric For Meteorol. 1998;91(3-4):223-235.
- Maniatis S., Kamoutsis A., Chronopoulou-Sereli A. and Nastos P. Air temperature estimation over the Ainos Mountain, Kefallinia Island, using linear regression analysis. In: Karacostas T.S., Bais A.F. and Nastos, P.T., eds. Perspectives on Atmospheric Sciences. Vol. I. Switzerland: Springer International Publishing AG. 2017:349-354.
- Maniatis S., Chronopoulos K., Matsoukis A., Kamoutsis A. Statistical models in estimating air temperature in a mountainous region of Greece. Curr World Environ. 2017; 12 (3): 547-552.
CrossRef - Chronopoulou-Sereli A., Chronopoulos I.K. Biometeorology-Bioclimatology. Applications to the configuration of outdoor spaces. Thessaloniki, Greece: Ziti Publications; 2011.
- Lin T.P., Matzarakis A., Huang R.L. Shading effect of long term outlook thermal comfort. Build Environ. 2010;45(1):213-221.
CrossRef - Matsoukis A., Kamoutsis A., Chronopoulou Sereli A. Air temperature effect on end of flowering of Cirsium arvense (L.) Scop. in a mountainous region of Greece. The J Anim Plant Sci. 2018; 28 (1): 100-106.
- Wilks D.S. Statistical Methods in the Atmospheric Sciences. Second Edition. Burlington, MA, USA: Elsevier, 2006.
- Matsoukis A., Kamoutsis A., Chronopoulou Sereli A. A note on the flowering of Ajuga orientalis L. in relation to air temperature in Mount Aenos (Cephalonia, Greece). Curr Agri Res J. 2018;6(3):261-267.
- Kattel D.B., Yao T., Panday P. K. Near-surface air temperature lapse rate in a humid mountainous terrain on the southern slopes of the eastern Himalayas. Theor Appl Climatol. 2018;132(3-4):1129-1141.
- Renaud V., Rebetez M. Comparison between open-site and below canopy climatic conditions in Switzerland during the exceptionally hot summer of 2003. Agric For Meteorol. 2009;149(5):873-880.
- Potter B.E., Teclaw R.M., Zasada J.C. The impact of forest structure on near ground temperatures during two years of contrasting temperature extremes. Agric For Meteorol. 2001;106(4):331-336.
CrossRef - Ferrez J., Davison A.C., Rebetez M. Extreme temperature analysis under forest cover compared to an open field. Agric For Meteorol. 2011;151(7):992-1001.
CrossRef - Thorsson S., Lindquivist M., Lidquivist S. Thermal bioclimatic conditions and patterns of behavior in an urban park in Göteborg, Sweden. Int J Biometeorol. 2004;48:149-156.
CrossRef


