Assessment of Environmental Noise Pollution in Warri and Effurun Metropolitan Cities
Godwin Johuel Birma 1
*
 , Baba Rani Issa 2
and Emmanuel E. Ukpebor 1
, Baba Rani Issa 2
and Emmanuel E. Ukpebor 1
1
Petroleum Training Institute,
Effurun-Warri,
Nigeria
2
Department of Chemistry,
University of Benin,
Benin-City,
Nigeria
http://dx.doi.org/10.12944/CWE.13.3.16
Environmental noise pollution affects not only the quality of life, but it poses a serious health and social problem. The Cirrus integrating averaging sound level instrument: model CR262A was employed to determine the noise levels at the twenty-two (22) selected sampling stations. The measurement of the noise was carried out during the morning, afternoon, and evening periods, to evaluate noise pollution within the twin city.Results indicated that there is no much difference (p>0.05) in the mean noise values within the different periods of the day at each sampling station, but there is significant variation (p<0.05) in the mean noise values at each period of the day over all the sampling stations. The results of the noise measurement showed that Enerhen Junction and NNPC Complex recorded the highest and lowest overall noise values of 84.84+5.39 dB(A) and 70 .90+2.98 dB(A) respectively. The results of this survey showed that the noise values at all the measurements points within Warri and Effurun metropolitan cities and at all the periods of the day is more than the Nigeria Federal Ministry of Environment (NFMEnv) and World Health Organization (WHO) permissible limit of 55dB daily noise level criteria for residential areas. The ssurvey requires the need to enact and enforce permissible noise levels/standards for residential neighbourhoods of 55dB by relevant environmental authorities both at Federal and state levels instead of applying 90dB standard meant for regulations in industrial settings.
Copy the following to cite this article:
Birmag J, Ukpebo E. E, Issa,B. R. Assessment of Environmental Noise Pollution in Warri and Effurun Metropolitan Cities. Curr World Environ 2018;13(3).
DOI:http://dx.doi.org/10.12944/CWE.13.3.16Copy the following to cite this URL:
Birmag J, Ukpebo E. E, Issa,B. R. Assessment of Environmental Noise Pollution in Warri and Effurun Metropolitan Cities. Curr World Environ 2018;13(3).Available from: http://bit.ly/2AxIfB9
Download article (pdf)
Citation Manager
Publish History

Introduction
Noise pollution, majorly a by-product of high human population density and developed industrial state, is now globally recognized as a major challenge for the quality of life in urban areas. It is becoming progressively perpetual, yet unnoticed form of air pollution even in developed nations.
The growth in noise pollution is unsustainable because it involves direct, as well as cumulative, adverse health effects. It also adversely affects future generations and has sociocultural, aesthetic, and economic effects.1,2 The most important factors raising noise pollution in urban areas include interalia appliances, vehicular traffic, neighborhood electrical appliances, TV and music systems. Others include public address systems, railway and air traffic, garbage trucks, construction equipment, manufacturing processes, and lawnmowers and generating sets. The noise created does not affect only people, but even oneself, fall prey to the cumulative noise generated by the household equipments used daily.3 Agarwal and Swami, confirmed that the transportation sector was one of the major contributors to noise in urban areas. Hence, as a first step towards assessment of noise pollution, measurement was taken up with emphasis on traffic noise.4
The hike in the population and in the number of vehicles has led to an increase in noise pollution, but noise pollution has been considered to be no effect than other contaminants in the environment.5 In comparison to many other environmental issues, noise pollution continues to increase and is accompanied by an growing number of complaints from people vulnerable to the noise.
The health significance of noise pollution are: noise-induced hearing impairment; interference with speech communication; disturbance of rest and sleep; psycho-physiological as well as mental-health. Other effects are decrease of children's ability to comprehend, concentration, assimilation and performance effects; effects on residential behavior and annoyance as well as interference with proposed activities.6,7
The air medium through which noise is released and moves is common to all human.Therefore People, businesses, and organizations, do not have unrestricted rights to emits noise at will, as if the resultant effects of noise were uncommon only to their private property. On the contrary, people should have obligation to use the host medium in ways that are compatible with or do not hamper other uses.8
According to Maduemezia,9 noise pollution is one aspect of environmental pollution that is taken rather lightly in Nigeria. He asserted that greater part of the sources of noise in the society is of a social origin. However, noise, as a polluting agent in the environment, has been recognized in recent years as a serious threat to the quality of life enjoyed by people in most industrialized nations. In developing nations, however, noise pollution has not been seen as dangerous and having adverse effect on the life of the people.10,11
World Health Organisation also state that there is evidence, that disturbed sleep causes fatigue, accidents and reduced performance (Naish et al., 2012)
The effects of noise are seldom catastrophic,and are often only transitory, but adverse effects can be cumulative with prolonged or repeated exposure. Sleep disruption, the masking of speech and television, and the inability to enjoy one's property or leisure time, impair the quality of life. This is probably the reason why not much research into environmental noise pollution has been carried out within Nigeria cities. Consequently, the need for monitoring environmental noise pollution has become necessary in Warri-Effurun and environs, so that the citizens can have a better understanding of the level of noise they are daily exposed to and the health implication.
Materials and Methods
Description of the Study Area
The study was carried out in the twin city of Effurun-Warri metropolis in Delta State of the Niger Delta Region, Nigeria and is situated on lat.5052’0’’E and Long. 5035’0’’N- (Figure 1).
The metropolis is a multicultural landscape (consisting of Urhobo, Itsekiris and Ijaws among others) with a population of 500,698.12 The coastal city is a tourist centre with a wide range of existing potential attraction Sites and Monuments, Hospitality Centres, Festivals and Dances, in addition to its known religious tolerance.13 The study area is among the largest oil-producing sites in the African continent and has a sea port strategically located in the city, making it an industrialized and highly commercial city characterized with high traffic volume all year round with frequent traffic jams at market and road junction vicinities located along the major roads in the city.14
Twenty-two noise monitoring stations were carefully selected to represent all the quarters of the study area with high noise pollution sources. The monitoring sites consist of road junctions and markets situated along the major roads and are opened on a daily basis from morning to evening. The monitoring stations were geo-referenced using Global Positioning System (GPS).15, 16 Table 1 shows the monitoring stations and their respective coordinates.
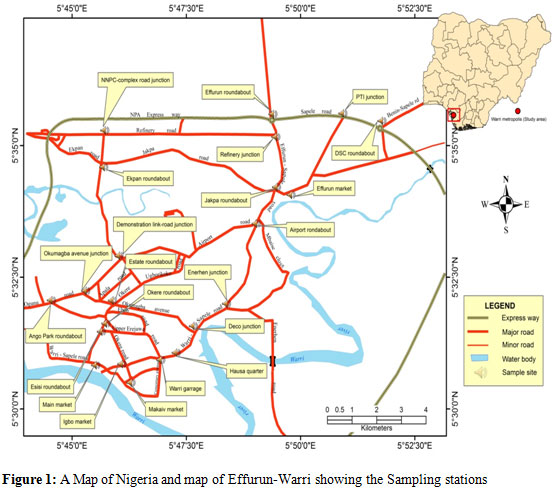 |
Figure 1: A Map of Nigeria and map of |
Cirrus integrating averaging sound level meter: model CR262A
Cirrus sound level meter: model CR262A is a type II, portable direct noise measuring device according to IEC 60651 specifications. It is an integrating averaging sound level hand-held meter with 35–130 dB(A) as a measuring range. The instrument is fitted with microphone interface that responds to sound pressure from the acoustic source and transforms it into an electric signal which can be interpreted by the measuring instrument.
The sound meter was calibrated by a calibrator as defined by IEC 60942 for checking the accuracy of the hand-held indicating instruments. The Calibrator is a small, battery driven device and has a standard sound level of 94 dB with an accuracy of ±0.5 dB.17
Table 1: Sampling stations and their coordinates and descriptions.
|
S/N |
Name of Station |
Elevation |
Coordinate |
Description of the measurement station |
|
1 |
DSC Roundabout |
12 |
N 05o 34’15.8” |
One of the major gateway roundabouts to the study area. Surrounded by filling stations and other businesses |
|
E 05o 48’33.0” |
||||
|
2 |
PTI junction |
11 |
N 05o 34’23.6” |
PTI junction is surrounded by PTI school on the south and has road side shops including shops for musicals. |
|
E 05o 47’59.5” |
||||
|
3 |
Effurun market |
6 |
N 05o 33’22.3” |
Market Site along PTI road, Effurun. It has high density and traffic jam. It hosts a lot of shops for musicals. |
|
E 05o 47’18.3” |
||||
|
4 |
Jakpa round about |
8 |
N 05o 33’21.9” |
Jakpa roundabout is a major traffic junction. It has high traffic jam, many musical shops and high pedestrian. |
|
E 05o 47’06.0” |
||||
|
5 |
Effurun roundabout |
11 |
N 05o 34’10.3” |
The major gateway roundabout to the study area. It has a high traffic and some businesses. |
|
E 05o 47’04.6” |
||||
|
6 |
Refinery junction |
11 |
N 05o 34’10.5” |
Traffic junction near Navy yard Effurun. It is a link to refiner road from Effurun-Sapele Road. |
|
E 05o 47’04.6” |
||||
|
7 |
Airport junction |
12 |
N 05o 32’51.7” |
The site is a major traffic junction. It has high traffic jam, many musical shops. It is near mother of redeemer catholic church. |
|
E 05o 46’48.0” |
||||
|
8 |
Enerhen junction |
9 |
N 05o 31’42.9” |
It is a major traffic junction along Effurun-Sapele. It has high traffic jam, many musical shops and high pedestrian daily. |
|
E 05o 46’25.7” |
||||
|
9 |
Deco junction |
10 |
N 05o 31’31.0” |
The station is a traffic junction. It has lot of musical shops and high pedestrian. Is located along Warri-Sapele |
|
E 05o 45’59.1” |
||||
|
10 |
Hausa Quarters |
11 |
N 05o 31’03.7” |
Most busy market in the study area along warri-Sapele road. It is an activity area with high daily traffic jam. |
|
E 05o 45’46.2” |
||||
|
11 |
Warri Garage |
16 |
N 05o 30’57.4” |
Warri garage site is along Warri-Sapele road. It has a motor park and many road side businesses. |
|
E 05o 45’27.8” |
||||
|
12 |
Makaiva Market |
11 |
N 05o 30’38.8” |
Relatively busy market in the study area behind warri stadium. It is an activity area with high traffic. |
|
E 05o 45’62.4” |
||||
|
13 |
Igbo market |
11 |
N 05o 30’50.9” |
Relatively busy market in the study area along warri-Sapele road. It is an activity area with high traffic. |
|
E 05o 44’59.5” |
||||
|
14 |
Main market |
11 |
N 05o 30’49.4” |
Relatively busy market in the study area along warri-Sapele road. It is an activity area with high daily traffic jam. |
|
E 05o 44’44.7” |
||||
|
15 |
Esisiroundabout |
12 |
N 05o 31’29.3” |
This site is created along Esisi road at Esisi GRA. It has scanty shops. |
|
E 05o 44’40.2” |
||||
|
16 |
Okere roundabout |
14 |
N 05o 31’34.0” |
The station is a traffic junction. It has high traffic jam, musical shops and high pedestrian. Is located near Okere prison. |
|
E 05o 44’40.9” |
||||
|
17 |
Estate roundabout |
10 |
N 05o 31’45.6” |
The station is a major traffic junction. It has high traffic jam, musical shops and high pedestrian. Is located along Avenue Rd. |
|
E 05o 44’46.6” |
||||
|
18 |
OkumagbaAv. Junction |
9 |
N 05o 31’53.4” |
The site is created along Airport road close Total Filling Station. The site is relatively free of traffic jam. |
|
E 05o 44’24.2” |
||||
|
19 |
Ango park roundabout |
10 |
N 05o 31’46.4” |
The site is a traffic junction that is relatively free along Airport road. There are a lot of business shops around it |
|
E 05o 43’55.1” |
||||
|
20 |
Demonstration link Road |
11 |
N 05o 32’22.2” |
The site is a traffic junction along Airport road surrounded by delta career college and college of education, Edjeba. |
|
E 05o 44’51.3” |
||||
|
21 |
Ekpan roundabout |
10 |
N 05o 33’43.1” |
This site near shrine and primary school at Ekpan. It is surrounded by business operators including musical shops. |
|
E 05o 44’37.0” |
||||
|
22 |
NNPC Complex Road |
13 |
N 05o 34’08.5” |
The site is a traffic junction that is relatively free, but busy sometimes especially at resumption an closure of NNPC workers |
Sound level meter and analytical procedures
Noise measurement procedure
The measurements were made at street level (at market centres’ road junctions and passenger loading parks). It was a typical walk-through surveys with the Sound Level Meter (SLM) held comfortably well away from the body at a distance of about 2.0m above the ground level with the microphone pointed horizontally to the surrounding noise sources.18
A-weighted instantaneous sound pressure level (LAi) measurements were taken for a period of 10 minutes per station per day for one week, (bringing the total period of reading to 70 minutes per sampling station). This procedure was carried out for morning (6:00–8:30 a.m.), afternoon (12:00–2:30 p.m.) and evening (5:00–7:30 p.m.) measurements.19
Analysis of Variance (ANOVA) was used as a statistical tool to analyse the data obtained from the noise measurement at 95% confidence level.
Result and Discussion
The results of the noise level measured in decibel {dB(A)} at 22 strategic locations at different periods of the day (morning, afternoon and evening) in Effurun and Warri metropolitan cities, Delta State, Nigeria, shows that even the lowest noise level value recorded at NNPC Complex Road (72.12 dB(A)) is more than the WHO limit of 55 dB(A) for residential environment and the mean noise level value for the control station (Oha Community) of 54.66 dB(A).20
Morning period
The result of the noise level for the morning period in Warri-Effurun metropolis (Table 2 and Figure 2) below shows that, Delta Steel Company (DSC) roundabout had an average noise level of 75.04±6.59 dB(A). The summary of noise level measurements for the morning period, shows that Hausa Quarters recorded the highest value of 84.60±3.33 dB(A), while Ango park roundabout had the lowest value of 72.16±1.83 dB(A).
Table 2: The values for average, minimum and maximum noise level in dB(A) during morning period.
|
S/N |
Sampling Sites |
Morning |
||
|
Average |
Min. |
Max. |
||
|
Noise level, dB(A) |
||||
|
1 |
DSC Roundabout |
75.04±6.59 |
63.07±4.47 |
91.09±7.44 |
|
2 |
PTI Junction |
76.60±6.82 |
63.74±3.75 |
93.40±5.14 |
|
3 |
Effurun Market |
78.10±6.92 |
68.56±2.70 |
93.14±5.17 |
|
4 |
Jakpa Roundabout |
78.94±5.28 |
69.43±3.49 |
93.91±7.75 |
|
5 |
Effurun Roundabout |
77.77±5.83 |
67.54±3.12 |
94.97±6.41 |
|
6 |
Refinery Junction |
77.40±4.15 |
64.87±5.00 |
88.93±4.93 |
|
7 |
Airport Junction |
80.86±6.91 |
69.11±6.49 |
96.47±6.79 |
|
8 |
Enerhen Junction |
82.14±5.26 |
71.77±6.59 |
100.16±6.52 |
|
9 |
Deco Junction |
76.29±6.83 |
66.24±5.62 |
91.16±4.72 |
|
10 |
Hausa Quarter |
84.60±3.33 |
71.47±7.83 |
97.20±5.26 |
|
11 |
Igbo Market |
74.97±4.23 |
64.89±3.50 |
92.41±5.62 |
|
12 |
Warri Garage |
76.73±6.98 |
65.39±4.83 |
90.67±6.07 |
|
13 |
Makaiva Market |
74.29±6.78 |
63.84±5.38 |
90.21±6.49 |
|
14 |
Main Market |
75.99±5.15 |
64.66±1.77 |
91.37±3.90 |
|
15 |
Esisi Roundabout |
74.90±5.25 |
64.36±4.22 |
88.77±3.97 |
|
16 |
Okere Roundabout |
76.30±3.71 |
63.91±2.85 |
88.49±1.74 |
|
17 |
Estate Roundabout |
78.24±3.27 |
65.74±5.89 |
95.31±4.37 |
|
18 |
Okumagba Av. Junction |
75.04±4.44 |
62.54±2.43 |
92.16±7.41 |
|
19 |
Ango park Roundabout |
72.16±1.83 |
61.73±1.85 |
87.81±3.56 |
|
20 |
Demonstration Link Road |
72.84±4.81 |
59.03±3.40 |
87.36±3.05 |
|
21 |
Ekpan Roundabout |
74.34±4.13 |
61.59±4.58 |
88.40±2.03 |
|
22 |
NNPC Complex Junction |
72.70±3.23 |
59.17±2.05 |
90.39±2.82 |
Afternoon period
The result of the noise measurement during the afternoon period (Table 3 and Figure 3) shows that the mean noise level values of 75.01±4.90 dB(A), 79.76±4.36 dB(A) and 73.03±4.49 dB(A) were recorded for Okere roundabout, Estate roundabout and Okumagba Avenue junction respectively. On the overall, the afternoon measurement shows that Enerhen Junction recorded the highest value of noise level [83.70±4.89 dB(A)], while NNPC Complex Junction had the lowest value of noise level [70.90±2.98 dB(A)] during the period under review
Table 3:The values for average, minimum and maximum noise level in dB(A) during Afternoon period.
|
S/N |
Sampling Sites |
Afternoon |
||
|
Average |
Min. |
Max. |
||
|
Noise level, dB(A) |
||||
|
1 |
DSC Roundabout |
73.71±4.99 |
63.20±5.87 |
91.09±7.44 |
|
2 |
PTI Junction |
77.76±5.91 |
67.13±7.54 |
93.40±5.14 |
|
3 |
Effurun Market |
80.31±4.07 |
67.14±4.79 |
93.14±5.17 |
|
4 |
Jakpa Roundabout |
79.96±4.98 |
67.96±3.75 |
93.91±7.75 |
|
5 |
Effurun Roundabout |
78.26±6.07 |
68.00±7.91 |
94.97±6.41 |
|
6 |
Refinery Junction |
75.80±5.48 |
63.34±3.33 |
88.93±4.93 |
|
7 |
Airport Junction |
79.81±6.02 |
65.90±2.94 |
96.47±6.79 |
|
8 |
Enerhen Junction |
83.70±4.89 |
72.14±6.22 |
100.16±6.52 |
|
9 |
Deco Junction |
76.97±4.53 |
64.64±6.01 |
91.16±4.72 |
|
10 |
Hausa Quarter |
83.27±4.87 |
70.96±4.23 |
97.20±5.26 |
|
11 |
Igbo Market |
77.14±5.25 |
65.51±5.98 |
92.41±5.62 |
|
12 |
Warri Garage |
78.31±6.13 |
65.87±5.25 |
90.67±6.07 |
|
13 |
Makaiva Market |
73.44±5.44 |
62.04±5.46 |
90.21±6.49 |
|
14 |
Main Market |
76.34±3.45 |
64.56±2.58 |
91.37±3.90 |
|
15 |
Esisi Roundabout |
75.03±5.05 |
62.90±5.11 |
88.77±3.97 |
|
16 |
Okere Roundabout |
75.01±4.90 |
62.23±5.24 |
88.49±1.74 |
|
17 |
Estate Roundabout |
79.76±4.36 |
65.59±3.85 |
95.31±4.37 |
|
18 |
Okumagba Av. Junction |
73.03±4.49 |
62.20±4.78 |
92.16±7.41 |
|
19 |
Ango park Roundabout |
73.74±3.85 |
60.11±4.35 |
87.81±3.56 |
|
20 |
Demonstration Link Road |
71.97±2.45 |
59.04±0.33 |
87.36±3.05 |
|
21 |
Ekpan Roundabout |
76.66±4.81 |
63.64±5.83 |
88.40±2.03 |
|
22 |
NNPC Complex Junction |
70.90±2.98 |
60.20±3.99 |
90.39±2.82 |
Evening period
The result of the environmental noiseassessment within the study area during the evening period (Table 4 and Figure 4) showed that DSC roundabout had an average noise level of 76.80±7.37 dB(A), while 78.97±5.92 dB(A) was recorded for PTI junction station. The Enerhen junction and Hausa Quarters sampling stations recorded the highest and second to the highest mean noise level during the evening measurement with values of 84.84±5.39 dB (A) and 83.90 ±5.36 dB (A) respectively.The least and second lowest average noise level were recorded at Demonstration Link Road and NNPC Complex Junction with values of 72.74±3.97 dB(A) and 72.77±4.29 dB(A) accordingly.
|
S/N |
Sampling Sites |
Evening |
||
|
Average |
Min. |
Max. |
||
|
Noise level, dB(A) |
||||
|
1 |
DSC Roundabout |
76.80±7.37 |
67.84±5.78 |
93.79±9.48 |
|
2 |
PTI Junction |
78.97±5.92 |
65.99±8.39 |
95.24±4.69 |
|
3 |
Effurun Market |
82.84±5.01 |
71.10±5.23 |
96.69±4.71 |
|
4 |
Jakpa Roundabout |
81.39±5.36 |
70.36±3.42 |
96.16±7.26 |
|
5 |
Effurun Roundabout |
78.04±4.83 |
68.53±3.68 |
93.23±5.85 |
|
6 |
Refinery Junction |
78.33±4.97 |
70.63±6.10 |
91.26±7.83 |
|
7 |
Airport Junction |
81.69±5.26 |
69.33±5.38 |
93.16±5.31 |
|
8 |
Enerhen Junction |
84.84±5.39 |
72.47±7.25 |
98.41±6.99 |
|
9 |
Deco Junction |
78.90±4.90 |
69.46±6.79 |
93.77±6.87 |
|
10 |
Hausa Quarter |
83.90±5.36 |
72.39±3.64 |
101.27±5.28 |
|
11 |
Igbo Market |
77.54±4.25 |
69.01±3.22 |
95.57±4.45 |
|
12 |
Warri Garage |
78.67±5.49 |
67.80±3.85 |
96.01±5.05 |
|
13 |
Makaiva Market |
74.30±4.05 |
67.83±5.95 |
88.09±2.61 |
|
14 |
Main Market |
77.30±4.37 |
65.81±5.73 |
91.46±3.04 |
|
15 |
Esisi Roundabout |
75.64±4.41 |
64.80±7.27 |
90.54±6.38 |
|
16 |
Okere Roundabout |
77.29±3.07 |
66.54±5.98 |
93.09±6.55 |
|
17 |
Estate Roundabout |
80.19±4.27 |
68.49±3.21 |
96.00±4.89 |
|
18 |
Okumagba Av. Junction |
74.71±4.97 |
63.69±4.43 |
87.93±4.60 |
|
19 |
Ango park Roundabout |
73.63±4.09 |
66.76±5.35 |
87.89±4.57 |
|
20 |
Demonstration Link Road |
72.74±3.97 |
63.79±4.49 |
88.07±1.66 |
|
21 |
Ekpan Roundabout |
76.50±4.95 |
64.09±3.56 |
90.11±3.54 |
|
22 |
NNPC Complex Junction |
72.77±4.29 |
63.86±6.16 |
95.41±6.12 |
Diurnal comparison at each station
When the average noise levels per station are examined across different periods of the day, one could say that the values are not the same. However, the statistical analysis (ANOVA) of the result (Table 5, and Figure 5) affirms that there is no much differences (p>0.05) between the average noise levels at varied periods (morning, afternoon and evening periods) of the day,when all the stations are considered individually.
Table 5: The combined mean noise level values for the morning, afternoon and evening periods.
|
S/N |
Sampling Sites |
Morning |
Afternoon |
Evening |
P-Value |
|
× |
× |
× |
|||
|
1 |
DSC Roundabout |
75.04±6.59 |
73.71±4.99 |
76.80±7.37 |
P>0.05 |
|
2 |
PTI Junction |
76.60±6.82 |
77.76±5.91 |
78.97±5.92 |
P>0.05 |
|
3 |
Effurun Market |
78.10±6.92 |
80.31±4.07 |
82.84±5.01 |
P>0.05 |
|
4 |
Jakpa Roundabout |
78.94±5.28 |
79.96±4.98 |
81.39±5.36 |
P>0.05 |
|
5 |
Effurun Roundabout |
77.77±5.83 |
78.26±6.07 |
78.04±4.83 |
P>0.05 |
|
6 |
Refinery Junction |
77.40±4.15 |
75.80±5.48 |
78.33±4.97 |
P>0.05 |
|
7 |
Airport Junction |
80.86±6.91 |
79.81±6.02 |
81.69±5.26 |
P>0.05 |
|
8 |
Enerhen Junction |
82.14±5.26 |
83.70±4.89 |
84.84±5.39 |
P>0.05 |
|
9 |
Deco Junction |
76.29±6.83 |
76.97±4.53 |
78.90±4.90 |
P>0.05 |
|
10 |
Hausa Quarter |
84.60±3.33 |
83.27±4.87 |
83.90±5.36 |
P>0.05 |
|
11 |
Igbo Market |
74.97±4.23 |
77.14±5.25 |
77.54±4.25 |
P>0.05 |
|
12 |
Warri Garage |
76.73±6.98 |
78.31±6.13 |
78.67±5.49 |
P>0.05 |
|
13 |
Makaiva Market |
74.29±6.78 |
73.44±5.44 |
74.30±4.05 |
P>0.05 |
|
14 |
Main Market |
75.99±5.15 |
76.34±3.45 |
77.30±4.37 |
P>0.05 |
|
15 |
Esisi Roundabout |
74.90±5.25 |
75.03±5.05 |
75.64±4.41 |
P>0.05 |
|
16 |
Okere Roundabout |
76.30±3.71 |
75.01±4.90 |
77.29±3.07 |
P>0.05 |
|
17 |
Estate Roundabout |
78.24±3.27 |
79.76±4.36 |
80.19±4.27 |
P>0.05 |
|
18 |
Okumagba Av. Junction |
75.04±4.44 |
73.03±4.49 |
74.71±4.97 |
P>0.05 |
|
19 |
Ango park Roundabout |
72.16±1.83 |
73.74±3.85 |
73.63±4.09 |
P>0.05 |
|
20 |
Demonstration Link Road |
72.84±4.81 |
71.97±2.45 |
72.74±3.97 |
P>0.05 |
|
21 |
Ekpan Roundabout |
74.34±4.13 |
76.66±4.81 |
76.50±4.95 |
P>0.05 |
|
22 |
NNPC Complex Junction |
72.70±3.23 |
70.90±2.98 |
72.77±4.29 |
P>0.05 |
 ± SD
± SD
Diurnal comparison at all the stations
The result of the statistical test using ANOVA also indicated that there is a significant difference at (p<0.05) of average noise level for different stations at a particular period of time.
Morning period
The post hoc statistical analysis using Duncan multiple range shows that the morning period has four (4) different groups of stations that have no considerable difference (p>0.05) in their average noise values. The Group I, II, III and IV have an average noise level values ranges of 72.16dB(A) to 78.94dB(A), 74.29dB(A) to 80.86dB(A), 75.99dB(A) to 82.14 dB(A) and 78.94dB(A) to 84.60 dB(A) respectively. The groups also have 19, 17, 12 and 4 numbers of stations respectively.
Afternoon period
The post hoc statistical analysis using Duncan multiple range shows that the afternoon period has six (6) different groups of stations that have no much difference (p>0.05) in their average noise values.
Evening period
The post hoc statistical analysis using Duncan multiple range shows that the evening period has six (6) different groups of stations that have no significant difference exist (p>0.05) in their average noise values.
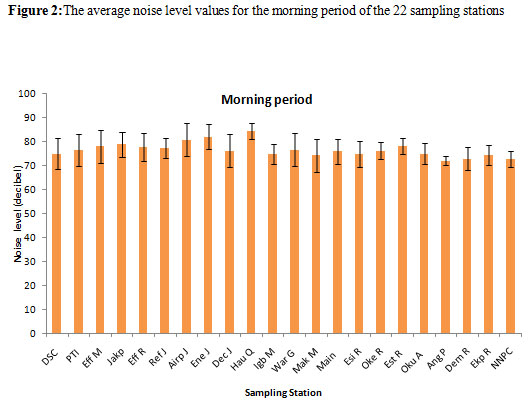 |
Figure 2: The average noise level values for the morning period of the 22 sampling stations Click here to view figure |
 |
Figure 3: The average noise level values for the afternoon period of the 22 |
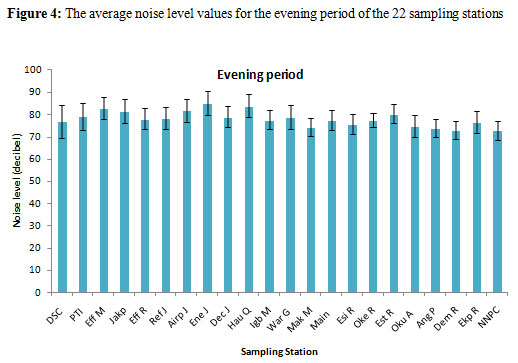 |
Figure 4: The average noise |
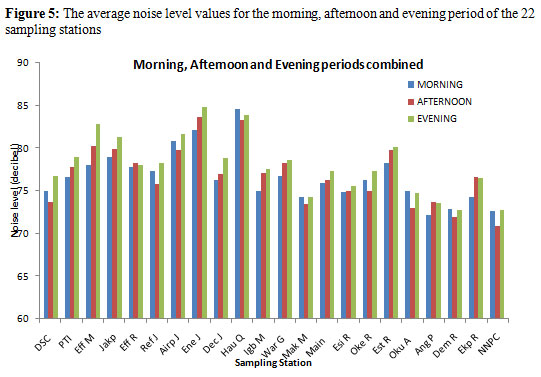 |
Figure 5: The average noise level values for the morning, afternoon and evening period of the 22 sampling stations |
Key: Abbreviations for Figure 1-4
|
DSC |
DSC Roundabout |
Ref J |
Refinery Junction |
Igb M |
Igbo Market |
|
PTI |
PTI Junction |
AirpJ |
Airport Junction |
War G |
Warri Garage |
|
Eff M |
Effurun Market |
Ene J |
Enerhen Junction |
Mak M |
Makaiva Market |
|
Jakp |
Jakpa Roundabout |
Dec J |
Deco Junction |
Main |
Main Market |
|
Eff R |
Effurun Roundabout |
Hau Q |
Hausa Quarter |
Esi R |
Esisi Roundabout |
|
Ekp R |
Ekpan Roundabout |
Est R |
Estate Roundabout |
Dem R |
Demonstration Link Road |
|
Oke R |
Okere Roundabout |
Oku A |
Okumagba Av. Junction |
NNPC |
NNPC Complex Junction |
|
Ang P |
Angoark Roundabout |
|
|
|
|
The research work also revealed that there was general decrease in noise pollution levels in Warri and Effurun in 2012 from the previous available data. For example, average noise level values of 107 dB(A) and 95 dB(A) as recorded for Enerhen and Estate junction by Rim-Rukeh 21 are far higher than the current average values of 84.84 dB(A) and 80.19 dB(A) in 2012, for the same sampling stations respectively. The noise reduction is attributed to a new policy promulgated by Delta State Government that stopped the operation of commercial motor bikes (Okada) in some selected cities in the state including the study area (Warri and Effurun) around November, 2012. This is in line with a study conducted in Sweden which showed that Road traffic noise constituted by far the largest (accounts for about 78 per cent) portion of Urban environmental noise pollution.22,23
Findings
The findings of the study are as follows:
Morning period: Hausa quarters have the highest noise level of 84.60+3.33 dB(A), while Ango park Roundabout records lowest of 72.16+1.83 dB(A).
Afternoon period: Enerhen Junction recorded highest noise level of 83.70+4.89 dB(A) and lowest of 70 .90+2.98 dB(A) obtained for NNPC Complex Junction.
Evening period: Enerhen Junction and Demonstration Link Road recorded 84.84+5.39 dB(A) and 72.74+3.97 dB(A) for highest and lowest respectively.
The noise level values in Warri and Effurun metropolitan cities exceeded World Health Organisation (WHO) limit of 55dB daily noise level criteria for residential areas at all the measurement points and far above the average value of the control of 54.66 dB.
No significant difference exist (p>0.05) in the average noise level values at a particular sampling station over the periods (morning, afternoon and evening) of the day.
Conclusion
The high noise level recorded at the 22 strategic locations within the study area (Effurun and Warri) pose a significant health hazard to the residents. Therefore Government Authorities at various level should put legislative framework in place to protect the growing population of the residents in Effurun and Warri against the high health risk and other effects of environmental noise pollution.
Acknowledgements
We acknowledge the following offices for their immense assistance rendered in the cause of carrying this research work.
Ear, Nose and Throat Unit, Central Hospital Warri, Delta State, Nigeria
Department of Petroleum Analysis Laboratory, Effurun, Delta State, Nigeria
Department of Animal and Environmental Biology, University of Benin, Nigeria
NOTE: This work is funded by the authors.
Reference
- Yilmaz, H and Ozer, S. Evaluation and analysis of environmental noise pollution in the city of Erzurum, Turkey. International Journal of Environment and Pollution, 2005. 23(4):438–448.
CrossRef - Oyedepo Sunday Olayinka. Noise Map: Tool for Abating Noise Pollution in Urban Areas. 2012 1. 185. doi:10.4172/scientificreports.185
- Singh and S. C. Davar. Noise Pollution- Sources, Effects and Control. J. Hum. Ecology. 2004. 16(3): 181-187
- Agarwal, S. and Swami, B.L. Status of Ambient Noise Levels in Jaipur City, Environment Conservation Journal.2010,11(2):105-108.
- Mansouri, N., Pourmahabadian, M., and Ghasenkhani, M. Road traffic noise in downtown area of Tehran. Iranian Journal of Environmental Health, Science and Engineering. 2006. 3(4): 267–272.
- Carter, N. L and Hunyor, S. N. A field study of traffic noise and cardiac arrhythmia during sleep. In: Technical Papers: 4th Western Pacific Regional Acoustics Conference, 1991.165-172, Queensland Department of Environment and Heritage, Brisbane, Australia.
- Odusanya O.O, Nwawolo, C.C, Ademuson. Disabling hearing loss in two industries in Lagos, Nigeria. Nigeria Journal Clinical Practice. 2004. 7(1): 4-
- Abdulaziz Al-Zahrani, Hazim Al-Hazimi, Rami Menkabo, Meshal Al-Malki, Muhammed Al-Mutairi and MutazQutob. Study of noise pollution during hajj season 1427; Bachelor Degree thesis submitted to Umm Al-Qura University.2007.
- Maduemezia, A. Physics, health and the environment. Invited paper presented at the 25th annual conference of the Nigerian Institute of Physics held at the Physics Advanced laboratory.2002., Sheda Science & Technology Complex, Abuja.
- Evelyn M. Ityavyar and Tyav Terungwa Thomas. Environmental pollution in nigeria: the need for awareness creation for sustainable development. Journal of research in forestry, wildlife and environment.2012. 4(2)
- Abumere,O. E; Ebeniro, J.O., and Oghodo, S.N. Investigation of environmental noise within Portharcourt City Metropolis. Nigeria Journal of physics .1999. II. (2) 129-132.
- Naish, D. A. Tan, A.C.C. and Demirbilek, F. N. Estimating Health Related Costs and Savings from Balcony Acoustic Design for Road Traffic Noise. Applied Acoustics, 2012. 73: 497.
CrossRef - National Population Commission. 2006 Population and Housing Census; Priority table, (2010). volume III
- Olomo, R. O.A and Enaruvbe, G. O. The role of maps in the promotion and dissemination of information on tourism in delta state, Nigeria. 2004.
- Ukpebor, E. E., Ukpebor, J. E., Odiase, J. I and Uzoekwe, S. A. Field comparison of two total suspended Particulates (TSP) samplers to assess spatial variation. . International Journal of Environmental Science .2006. 63 (5): 567-577
CrossRef - Oloruntoba E. O., Ademola R.A., Sridhar M. K. C., Agbola S. A., Omokhodion F. O. and Ana G.R.E.E and Alabi R. T. Urban Environmental Noise Pollution and Perceived Health Effects in Ibadan, Nigeria. Afr. J. Biomed. Res., 2012. 15: 77 – 84.
- Malchaire J.Sound measuring instruments.1994.
- Anomohanran, O. and Osemeikhian, J. E. A. Day and night noise pollution study in some major towns in Delta State, Nigeria.Ghana J. Sci. 2006. 46 (3): 47-54.
- Olayinka S. Oyedepo · Abdullahi A. Saadu . Evaluation and analysis of noise levels in Ilorin metropolis. Nigeria Environ. Monit. Assess., 2009. 160:563–577
- Mangalekar S.B., Jadhav A.S. and Raut P.D. Study of Noise Pollution in Kolhapur City, Maharashtra, India Universal Journal of Environmental Research and Technology. 2012. 2(1): 65-69.
- Rim-ruke,A; Okokoyo, P.A., and Igherighe, E. C. Environmental noise pollution pattern within Warri Metropolis. Global Journal of Pure and Applied Science. 2007. 13(3):204-208
CrossRef - Ahmad, J., Abbas, A., & Reem, S. Evaluation of traffic noise pollution. Journal of EnvironmentalMonitoring and Assessment, 2006. 120:499–525.
- Florentina, F. Road Traffic Noise:A study of Skåne region, Sweden.2008. ISRN: LIU-IDA/FFK-UP-A--08/015—SE.


