Assessment of Heavy Metal Pollution in Soils from Farms in the Vicinity of Durumi Quarry Site in Mpape, Abuja Nigeria
Fatimah Oyenike Ojo1
*
 , Tukura Bitrus Wokhe1
and Madu Pascal Chima1
, Tukura Bitrus Wokhe1
and Madu Pascal Chima1
1
Department of Chemistry, Faculty of Natural and Applied Science,
Nasarawa State University,
Keffi,
Nasarawa State
Nigeria
http://dx.doi.org/10.12944/CWE.13.3.09
Copy the following to cite this article:
Ojo F. O, Wokhe T. B, Chima M. P. Assessment of Heavy Metal Pollution in Soils from Farms in the Vicinity of Durumi Quarry Site in Mpape, Abuja Nigeria. Curr World Environ 2018;13(3).
DOI:http://dx.doi.org/10.12944/CWE.13.3.09
Copy the following to cite this URL:
Ojo F. O, Wokhe T. B, Chima M. P. Assessment of Heavy Metal Pollution in Soils from Farms in the Vicinity of Durumi Quarry Site in Mpape, Abuja Nigeria. Curr World Environ 2018;13(3). Available from: https://bit.ly/2EbtpUx
Download article (pdf)
Citation Manager
Publish History

Introduction
Crushed rock quarrying is a mining activity, largely carried out in most parts of the Federal Capital Territory Abuja, because of the availability of large deposits of rocks that adorn the city and obviously for socio-economic benefits.
Quarrying is a destructive development activity whose socio-economic benefits may be unable to compensate for the overall detrimental effects on natural ecosystems as it produces immediate and long term undesirable effects in the environment and even long time after which the mine is closed.1
Crushed rock quarrying activities generates considerable amount of dust and wastes, which contain a number of heavy metals.2 Heavy metals that are mobilized or dissolved into the soil can be taken up by plants or transported to surface or ground water.3 Thus heavy metals enter into food chain and are afterwards accumulated to high amounts instigating acute or chronic toxicity (poisoning) and serious risk to human health when plant foods or plant products are eaten.2,4
The amount of dissolved heavy metal fraction in the pore water which can be taken up by plant roots or other soil organisms is referred to as environmental bioavailability.5 Soil pH, Soil Organic Matter (SOM), Soil texture class and clay minerals have been identified as key factors affecting the availability of heavy metals in soil.3,6,7
Studies in heavy metal content have been carried out on soils in other areas in Abuja different from Durumi. In the study, concentrations of Zn, Cu, Mn, Fe and Pb were investigated in soils from Wuse-Zone 4, Central Area, Jabi Lake, National Mosque, Wuse 2, and Wuse-Zone 6. Levels of total and bioavailable heavy metals observed ranged from 0.35ppm (Pb) to 42346.06ppm (Fe) and 0.09ppm (Pb) to 195.52ppm (Mn) respectively. A comparison of findings with European Union Regulatory Standard showed that all the heavy metals were below toxic level in the soils studied.10
Index of geoaccumulation of heavy metals in some selected auto mechanic soils in Abuja, Nigeria indicated that heavy metal (Cu, Zn, Cr, Fe, Pb, Ni and Cd) pollution levels ranged from unpolluted to extremely polluted.11
Keeping these views in mind a study was conducted to determine the total and bioavailable concentrations of eight heavy metals (Cr, Cu, Cd, Zn, Mn, Ni, Pb and Fe) and some physico chemical parameters of soil in vegetable farms in the vicinity of Durumi quarry in order to assess the level of contamination of the soil. This study will provide data and information required for further actions to be carried out where necessary.
Clay soils retain high amount of metals sandy soils do not.8,9 Clay minerals have a permanent negative charge and a comparatively large surface area, along with a high cation exchange capacity (CEC) hence, are very important for the absorption of metals.9
Studies in heavy metal content have been carried out on soils in other areas in Abuja different from Durumi. In the study, concentrations of Zn, Cu, Mn, Fe and Pb were investigated in soils from Wuse-Zone 4, Central Area, Jabi Lake, National Mosque, Wuse 2, and Wuse-Zone 6. Levels of total and bioavailable heavy metals observed ranged from 0.35ppm (Pb) to 42346.06ppm (Fe) and 0.09ppm (Pb) to 195.52ppm (Mn) respectively. A comparison of findings with European Union Regulatory Standard showed that all the heavy metals were below toxic level in the soils studied.10
Index of geoaccumulation of heavy metals in some selected auto mechanic soils in Abuja, Nigeria indicated that heavy metal (Cu, Zn, Cr, Fe, Pb, Ni and Cd) pollution levels ranged from unpolluted to extremely polluted.11
Keeping these views in mind a study was conducted to determine the total and bioavailable concentrations of eight heavy metals (Cr, Cu, Cd, Zn, Mn, Ni, Pb and Fe) and some physico chemical parameters of soil in vegetable farms in the vicinity of Durumi quarry in order to assess the level of contamination of the soil. This study will provide data and information required for further actions to be carried out where necessary.
Materials and Methods
Study Area
The study area, Durumi is located in the Federal Capital Territory (FCT) in Abuja, Nigeria between latitudes 8° 25´and 9° 25´North of the Equator and longitudes 6° 45´ and 7°45´East. Durumi village is located in Mpape in AMAC, Abuja within geographical coordinates of 9° 8’ 45” North, 7° 29’ 44” East12 ( Figure.1). It is home to a large quarry industry whose quarry activities, according to resident in the village started since 2008. The quarry is sited close to the village on the Durumi hills and has farm lands within its vicinity. Vegetables are mostly planted by the villagers in these farms.
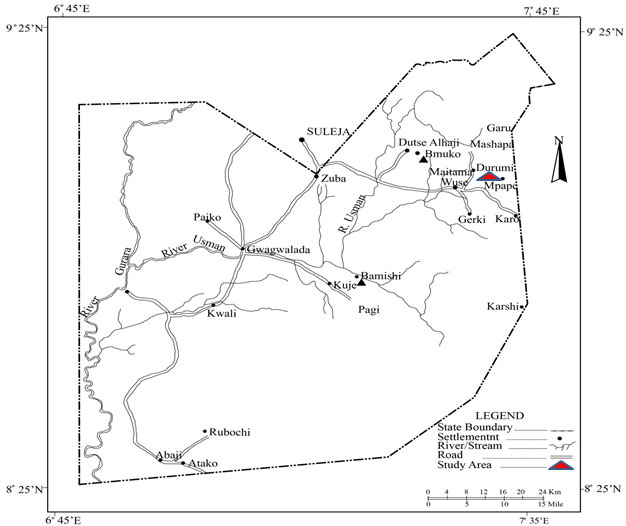 |
Figure 1 click here to view figure |
Control Areas
Control soil were collected from farmlands at a distance of about 5km away from the quarry and in an area not affected by the quarry activities. Control soils were collected from these areas at the same period as those from the study areas.
Sample Collection and Pre-treatment
Sample collection was carried out, during dry and rainy seasons of the year 2017. Mallo and Mgbanyi13 reported that FCT, Abuja usually has six months dry season from November to April and six months rainy season from May to October annually. Therefore, samples were collected in March for the dry season and once in September for the raining season.
Samples collection was done at depths of 0.0 - 5.0cm and 5.0 - 10.0cm from the surface of the earth with the help of plastic trowel. Soil samples were collected at the same spot where the vegetables were planted, mixed thoroughly to give representative samples of the 2 depths. This process was repeated for 3 sets of samples. The soil samples were carried to the laboratory, air –dried, and sieved properly (2mm pore size), homogenized and stored in labelled polythene bags at 4oC prior to laboratory analysis.14
Determination of Physicochemical Properties of Soil and Sample Digestion.
All analyses were carried out in triplicates using standard methods. For the determination of pH, a suspension of 1:5 (w/v) portion of soil and distilled water was measured with a digital pH meter according to the procedure in.15 CEC was analysed using standard method for soil survey as described.21 Loss on ignition, was used for the determination of Organic matter contents of the soil.16 Soil particle size was determined using the Bouyoucos hydrometer method and soil texture extrapolated from soil triangle according to the various soil particle fractions.1819,20
For the quantification of total heavy metals in the soil samples, acid digestion method as described in21 was employed. A 3g portion of the pre – treated soil sample was weighed in a 100 ml round bottom flask. A volume of 21 ml of concentrated HCl (35%) and 7 ml concentrated HNO3 (65%) was added. This was kept at room temperature overnight. A water condenser was attached to the flask and its content and heated to boil for 2 hours. After which 25 ml portion of glass distilled water was added. The mixture was filtered through Whatman (No. 42) filter paper into a 100ml volumetric flask. The residue was filtered twice with 5ml of water into the flask and the solution made up to 100ml. This was analysed using Atomic Absorption Spectrophotometer (AAS).The potentially bioavailable (environmental available) content of heavy metals was extracted with 0.05M Ethylene diamine tetra acetic acid (EDTA). The heavy metals in the extract were determined with the use of AAS.22
Statistical Analysis
Analysis of variance (ANOVA): Single-factor and post hoc analysis using the Bonferroni correction was carried out to evaluate the significant difference in the concentrations of the heavy metals in each of the samples between each soil depth and during each season and between the seasons. Correlation of soil physicochemical properties with bioavailable heavy metals at P ≤ 0.05 level (2 tailed) of significance was also carried out in the samples results.
Quality Control
Along with other standard laboratory practices, heavy metal analysis was validated by conducting spike recovery study on the samples. Portions of the samples collected from 5.0 – 10cm, depth during rain and dry seasons, were each spiked with known concentrations of the metal to be analysed such that there was significant increase in the metal from the original sample content. Results of concentrations recorded for spiked and unspiked samples were recorded. Percent Recovery (%R) was calculated using the equation (2.1) adapted from.18
Anthropogenic Metal
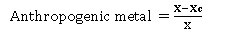
Equation (2.2) was used to quantify anthropogenic metal content for each heavy metal;
Anthropogenic metal =(X-Xc)/X (2.2)
Where X `= Metal content representing the lithogenic metal; Xc = Average concentration of the metal in the soil. The content of the control, which is the background sample, represents the lithogenic heavy metal24, 25.
Contamination/Pollution Index
The contamination/pollution (CP) index was calculated using the contamination/pollution index as defined by25,27

Target (reference) values for maximum allowed concentrations of metals were: Cd - 0.8, Cr -100, Cu -36, Ni - 35, Pb-85, Zn- 146, Co- 20, Mn- 437 & Fe- 5000.27
Table 1 shows the significance of C/P index. C/P index values higher than one (1) indicates pollution and values lower than one (1) indicate contamination.25
Table 1: Contamination/pollution (C/P) index value25
| C/P | Significance | ||
| <0.1 | Very slight contamination | ||
| 0.10–0.25 | Slight contamination | ||
| 0.26–0.50 | Moderate contamination | ||
| 0.51–0.75 | Severe contamination | ||
| 0.76–1.00 | Very serve contamination | ||
| 1.1–2.0 | Slight pollution | ||
| 2.1–4.0 | Moderate pollution | ||
| 4.1–8.0 | Severe pollution | ||
| 8.1–16.0 | Very severe pollution | ||
| >16 | Excessive | ||
Results and Discussion
Quality Control
Table 2: Recovery Studies
|
Results of spiked |
Result of unspiked |
Recovery |
Recovery |
|||||
|
Heavy |
sample (mg/kg) |
sample(mg/kg) |
(%) |
(%) |
||||
|
Metal |
Dry |
Rainy |
Dry |
Rainy |
Dry |
Rainy |
Mean±SD |
|
|
Cr |
24.90 |
24.94 |
0.57 |
0.11 |
91.25 |
93.13 |
92.19±1.33 |
|
|
Cu |
31.78 |
33.17 |
0.19 |
0.04 |
91.15 |
95.56 |
93.35±3.12 |
|
|
Cd |
22.27 |
23.01 |
-0.25 |
0.07 |
93.85 |
95.56 |
94.83±1.38 |
|
|
Zn |
18.82 |
18.66 |
0.79 |
0.17 |
96.61 |
99.04 |
97.82±1.72 |
|
|
Mn |
6.41 |
4.81 |
2.25 |
0.46 |
90.63 |
94.68 |
92.65±2.86 |
|
|
Ni |
16.26 |
16.32 |
0.80 |
0.48 |
96.62 |
99.04 |
94.63±2.81 |
|
|
Pd |
3.55 |
17.08 |
2.43 |
15.93 |
91.58 |
93.58 |
93.38±1.04 |
|
|
Fe |
169.33 |
157.21 |
14.23 |
4.61 |
93.82 |
92.31 |
92.58±1.42 |
|
Key: Dry and Rainy – Season; SD - Standard Deviation
Result of recovery studies carried out is as presented in Table 2. The results which ranged from 91.15% to 99.04% were all within acceptable limits of 100±10%28 thus validating the heavy metal analysis method, including the performance of the equipment used.
Total Heavy Metal in Soil
The mean total heavy metal concentrations of soil samples are stated in Tables 3 and 4. During dry season, mean concentrations of total heavy metal ranged from 0.02 (Cu) to 71.53(Fe) mg/kg for samples and 0.01mg/kg (Zn) to 111.89mg/kg (Fe) for controls. For rainy season the heavy metal concentrations ranged from 0.02mg/kg (Cu) to 22.53mg/kg (Pb) for samples and 0.03 mg/kg (Cd) to 26.63mg/kg (Pb) for controls. These observed concentrations are not as high as in similar studies by,29 where heavy metal concentrations ranged from 0.53(Cd) to 17854mg/kg (Fe) for samples and 0.55(Cd) to 18338mg/kg (Fe).
Heavy metal concentrations varied inconsistently in samples and control. For samples, dry season levels (Table 3), of Zn(5.20mg/kg), Mn(19.44mg/kg), Ni(1.69mg/kg) and Pb(4.56mg/kg) and rainy season levels (Table 4) of Zn (0.26mg/kg), Pb(22.53mg/kg) at soil depth of 0.0 – 5.0cm, and dry season levels (Table 3) of Zn(1.19mgkg) and Ni(1.62mg/kg)along with rainy season levels (Table4) of Cr(0.44mg/kg), Cd (0.06mg/kg), Zn(0.09mg/kg) and Fe(6.74mg/kg) at soil depth of 5.0-10.0cm are all higher than in controls. This is attributed to activities of the quarry which generates dust and waste harbouring heavy metals.2 While dry season concentrations for control (Background) soils at depth of 0.0- 5.0cm &5.0 -10cm for Cr (4.95 & 1.21mg/kg), Cu (0.08 & 0.04mg/kg), Cd (0.08 &0.09mg/kg), and Fe (111.89 & 110.46mg/kg) respectively were higher than in the samples. So also concentrations of Mn (28.6mg/kg and Pb 5.19mg/kg) were higher in controls than in samples. This same observation was made in the rainy season. Control soils though far from quarry activities had higher concentrations of some heavy metals than in soils by the quarry sites. This indicates that other sources such as weathering and erosion of heavy metals could contribute to high heavy metal content in control soil.30 Natural background values of heavy metals in souls have been observed to be usually in the range from 1 - 100 mg/kg and higher or lower values are possible for some metals.7 Similar studies by,31,11 have shown back ground levels of heavy metals in soils from Abuja to be higher than observed in this study.
Table 3: Dry Season means and ranges of levels of total heavy metals (mg/kg) at two soil depths in farms around the study site
| 0.00-5.00cm | 5.00-10.00cm | |||||||
| Sample | Control | Sample | Control | |||||
| Mean±SD | Range | Mean±SD | Range | Mean±SD | Range | Mean±SD | Range | |
| Cr | 0.30±0.20 | 0.16 - 0.53 | 4.95±0.59 | 4.51-5.62 | 0.33±0.20 | 0.20-0.57 | 1.21±1.05 | ND-1.87 |
| Cu | 0.04±0.03 | 0.01 - 0.06 | 0.08±0.07 | ND-0.14 | 0.02±0.02 | ND-0.03 | 0.04±0.01 | 0.02-0.04 |
| Cd | 0.07±0.01 | 0.06 - 0.07 | 0.08±0.03 | 0.05-0.11 | 0.04±0.03 | ND -0.06 | 0.09±0.01 | 0.09-0.10 |
| Zn | 5.20±6.93 | 0.00 -1.26 | 0.01±0.00 | ND-0.14 | 1.19±1.04 | ND -1.92 | 0.11±0.10 | ND-0.20 |
| Mn | 19.44±4.15 | 14.83-22.88 | 1.63±2.10 | 0.30-4.05 | 1.05± 1.04 | ND-0.52 | 28.36±12.02 | 14.98-38.23 |
| Ni | 1.69±1.42 | 0.31-3.14 | 0.47±0.26 | 0.31-0.76 | 1.62±0.77 | 0.80-2.31 | 0..37±0.32 | ND-0.53 |
| Pd | 4.56±0.52 | 4.06-5.11 | 1.90±1.88 | ND-2.00 | 2.39±1.53 | 0.83-3-89 | 5.19±1.42 | 4.20-6.81 |
| Fe | 13.65±12.72 | 0.00 -25.16 | 111.89±16.71 | 94.68-128.05 | 71.53±67.61 | ND-134.39 | 110.46±102.59 | ND-202.75 |
ND – Not Detected; SD - Standard Deviation
Table 4: Rainy Season means and ranges of levels of total heavy metals (mg/kg) at two soil depths in farms around the study site
| 0.00-5.00cm | 5.00-10.00cm | |||||||
| Mean±SD | Range | Mean±SD | Range | Mean±SD | Range | Mean±SD | Range | |
| Cr | 0.52±0.08 | 0.44-0.59 | 2.75±2.39 | ND-4.26 | 0.44±0.28 | 0.11-0.63 | 0.38±0.15 | 0.22-0.50 |
| Cu | 0.04±0.04 | ND-0.08 | 0.04±0.03 | ND-0.07 | 0.02±0.01 | 0.01-0.03 | 0.31±0.11 | 0.20-0.42 |
| Cd | 0.04±0.04 | 0.01-0.09 | 0.06±0.00 | 0.06-0.06 | 0.06±0.05 | 0.01-0.11 | 0.03±0.01 | 0.03-0.04 |
| Zn | 0.26±0.27 | ND-0.18 | 0.21±0.13 | 0.10-0.35 | 0.09±0.08 | ND-0.17 | 0.07±0.06 | ND-0.12 |
| Mn | 0.53±0.11 | 0.40-0.59 | 0.75±0.14 | 0.66-0.91 | 0.53±0.10 | 0.46-0.65 | 0.55±0.10 | 0.44-0.62 |
| Ni | 0.60±0.28 | 0.29-0.85 | 0.95±0.20 | 0.78-1.17 | 0.24±0.21 | 0.08-0.48 | 0.93±0.26 | 0.71-1.22 |
| Pd | 22.53±0.73 | 22.13-23.38 | 11.23±12.96 | 2.50-6.12 | 18.98±2.92 | 15.95-21.78 | 26.63±0.84 | 25.98-27.58 |
| Fe | 2.60±0.74 | 1.88-3.36 | 5.13±1.74 | 3.19-6.55 | 6.74±6.53 | 1.54-14.07 | 3.05±0.05 | 2.48-3.44 |
ND - Not Detected; SD - Standard Deviation
The observed lower levels of these heavy metals in the samples soil could be as a result of leaching of the heavy metals to ground or surface waters caused by low sorption capacity of the soil which can be traced to factors such as soil properties, chemical properties of the heavy metal and nature of rains around the quarry site.32 However, levels of Mn at depth of 0.0 – 5.0cm during dry season were significantly higher in samples than control while only levels of Cr and Fe at 0.0 – 5.0cm depth in dry season and Cu and Pb at depth of 5.00 -10cm depth in rainy season were significantly higher in Control than in samples (P≤0.005).
Table 5: Percent Anthropogenic input of Heavy Metals in Soil at two depths from farms around the Quarry Site during dry and rainy seasons
|
Soil Depth |
Season |
Cr |
Cu |
Cd |
Zn |
Mn |
Ni |
Pd |
Fe |
|
0.0 - 5.0cm |
Dry |
94.00 |
54.17 |
16.67 |
-38916.67 |
-1096.31 |
-262.38 |
-140.29 |
87.80 |
|
5.0 - 10.0cm |
Dry |
72.26 |
53.13 |
57.83 |
-953.41 |
96.28 |
-344.11 |
54.02 |
35.25 |
|
0.0 - 5.0cm |
Rain |
81.23 |
-34.62 |
25.93 |
-23.68 |
29.93 |
36.61 |
-100.62 |
49.26 |
|
5.0 - 10.0cm |
Rain |
-15.93 |
93.21 |
-86.67 |
-18.46 |
4.21 |
74.04 |
28.74 |
-121.17 |
Levels of anthropogenic heavy metals input in soil samples are shown in Table 5. All negative values indicate no anthropogenic input. During dry season, heavy metals that indicated anthropogenic content, had anthropogenic levels that ranged in the order: Cd(16.67%) < Cu(54.17%)33. This is also indicative of the high anthropogenic input observed for Fe and Pd which form complexes with Cr in the natural ores mentioned earlier. It is known that the potential for heavy metal contamination is usually increased when mining activities, such as quarrying, exposes metal bearing ores or when mined ores are discarded on the earth.34
Table 6: Contamination/Pollution (C/P) Index Values for Soil from farms around the Quarry Site
|
Soil Depth |
Season |
Cr |
Cu |
Cd |
Zn |
Mn |
Ni |
Pd |
Fe |
|
0.0 - 5.0cm |
Dry |
0.00 |
0.00 |
0.08 |
0.04 |
0.04 |
0.05 |
0.05 |
0.00 |
|
5.0 - 10.0cm |
Dry |
0.00 |
0.00 |
0.05 |
0.01 |
0.00 |
0.05 |
0.03 |
0.01 |
|
0.0 - 5.0cm |
Rain |
0.01 |
0.00 |
0.06 |
0.00 |
0.00 |
0.02 |
0.27 |
0.00 |
|
5.0 - 10.0cm |
Rain |
0.00 |
0.00 |
0.08 |
0.00 |
0.00 |
0.01 |
0.22 |
0.00 |
Contamination /pollution (C/P) Index in Table 6 ranged from 0.0 to 0.27 indicating that heavy metal levels in the soil are only to contamination levels with Pb having the highest at moderate contamination levels of 0.27 and 0.22 during rainy seasons at soil depths of 0.0 -5.0cm and 5.0 – 10cm respectively. However, Table 7 shows that the seasonal mean total heavy metals in the soil samples were lower than the Maximum Allowable Limits (mg/Kg) for World Health Organization (WHO) and Food and Agriculture Organization (FAO).
Table 7: Comparison of Total Heavy Metal Content of Soil with Maximum Allowable Limits (mg/Kg) for World Health Organization (WHO) and Food and Agriculture Organization (FAO)
|
Heavy Metals |
Dry Season Mean Heavy Metal Levels |
Rainy Season Mean Heavy Metal Levels |
Maximum Permissible Level in Soil |
|
|
Cr |
0.32 |
0.48 |
100 |
|
|
Cd |
0.03 |
0.03 |
3 |
|
|
Cu |
0.05 |
0.05 |
100 |
|
|
Zn |
3.20 |
0.17 |
300 |
|
|
Mn |
10.25 |
0.53 |
2000 |
|
|
Ni |
1.66 |
0.42 |
50 |
|
|
Pb |
3.47 |
20.76 |
100 |
|
|
Fe |
42.59 |
4.67 |
50000 |
|
Soil Properties
All soil properties are shown in Table 8. Soil properties are known to determine the mobility or environmental availability (Bioavailability) of heavy metals in soil, pH as generally the most importantfactor.7 The average pH in this study as shown in Table 8, during dry season at soil depth of 0.5-5.0cm was 6.51and 5.94 for soil at depth of 5.0cm -10.0cm.During rainy season soil at depth of 0.0 -5.0cm, pH was 6.50 while at depth of 5.0 – 10cm it was 5.93. For both seasons pH values were slightly acidic and decreased slightly with depth. This indicates that during the seasons soils at depth of 0.0-5.0cm will not allow the mobilization of cationic metals such as Cd, Zn and Pd while the reverse is the case for soils at depth of 5.0cm -10.0cm7 hence, cationic metals such as mentioned earlier which find their way to soil at depth of 5.0cm -10.0cm are easily made available for plant up take and mobilization to ground water. Metals are generally known not to exist in free forms at pH range of 6.0 to 9.036 as in.29
The levels of Organic Matter (OM) are approximately the same at both soil depth (0.0 – 5.0cm (0.59%) and at 5.0 – 10.0cm (0.60%) during dry season, while during rainy season OM levels decreased from 0.59% at soil depth of 0.0 – 5.0cm to 0.37% at soil depth of 5.0 – 10.0cm.The lower OM observed indicates that heavy metals are more likely to be mobilized at the lower soil depth of 5.0 – 10.0cm. Organic matter is known to form strong complexes with heavy metals hence, heavy metal mobility increases with decrease in Organic matter.37,38,39 However, where the organic matter contain humus, humic acid and fulvin which have high chelating characteristic and provide more binding surfaces for heavy metals adsorption, heavy metals attached to these organic constituent may become available because most of them are water soluble.40
Table 8: Physico-chemical Properties of Soil Samples at Two Soil Depths
| 0.0 – 5.0cm | 5.0 – 10cm | ||||
| Seasons | Parameters | Mean±SD | Range | Mean±SD | Range |
| Dry | pH | 6.51±0.23 | 6.30-6.76 | 5.94±0.27 | 5.75-6.25 |
| OM (%) | 0.59±0.16 | 0.49-0.77 | 0.60±0.08 | 0.56-0.69 | |
| CEC(meq/100g) | 8.97±0.18 | 8.77-9.13 | 9.10±3.96 | 4.5211.48 | |
| Rainy | pH | 6.50±0.21 | 6.30-6.72 | 5.93±0.28 | 5.72-6.25 |
| OM (%) | 0.59±0.11 | 0.50-0.72 | 0.37±0.30 | 0.05-0.65 | |
| CEC(meq/100g) | 8.91±0.18 | 8.74-9.09 | 9.14±4.04 | 4.52-12.39 |
SD – Standard Deviation
Table 9: Particle Size Distribution and Texture Class of Soil Samples at Two Soil Depths
| 0.0-5.0cm | 5.0-10.0cm | |||
| Parameters | Mean±SD | Range | Mean±SD | Range |
| Sand% | 84.69±1.14 | 83.38-85.38 | 85.69±0.60 | 85.32-86.38 |
| Clay% | 4.39±0.51 | 3.84-4.84 | 4.14±0.57 | 3.48-4.48 |
| Silt% | 10.92±0.08 | 10.20-11.78 | 10.16±0.03 | 10.14-10.20 |
| Texture Class | Loamy Sand | Ls - Ls | Loamy Sand | Ls-Ls |
Ls - Loamy soil; SD- Standard Deviation
Cation Exchange Capacity (CEC) observed for soil samples showed that mean dry season levels increased from 8.97 for soils at 0.0 – 5.0cm depth to 9.10 for soil at 5.0- 10.0cm depth while for rainy season it increased from 8.91 at soil depth of 0.0 – 5.0cm to 9.14 at depth of 5.0 – 10.0cm. CEC is soil’s ability to hold positively charged ions, resulting in a strong adsorption of metal cations.9 It is an inherent soil characteristics contributed by soil clay and organic matter content and it is difficult to alter significantly.41,42 The observed slight increased in CEC levels for soil samples during each season at 0.5- 10.0cm soil depth, when compares to the upper soil layer (0.0 -5.0cm), is an indication that heavy metal mobility may be slightly impaired at that depth. This will reduce the leaching and availability of heavy metals for plant uptake.42,43
Soil particle size distribution for sample studied (Table 9) showed the soil to be loamy sand at both soil depths. Loamy soil retains heavy metals more than sandy soils. Soil is generally slightly acidic loamy sand, similar to what was observed in Ikole-Ekiti granite quarry.1
Bioavailable Heavy Metals
evels of bioavailable heavy metals in soil samples for both seasons are recorded in Tables 10 and 11. Dry season levels of bioavailable heavy metals ranged from 0.02mg/kg (Cd) to 0.60mg/Kg (Fe) for soil samples at depth of 0.0-0.05cm and 0.02mg/kg (Cd) to 25.17mg/kg (Fe) at soil depth of 0.5-10cm. While rainy season levels ranged from 0.02mg/kg (Cu) to1.12mg/kg (Fe) at soil depth of 0.0 -5.0cm and ND (Cr and Cu) to 1.05mg/kg (Fe) for soil depth of 5.0 – 10.0cm.
Table 10: Dry Season Mean and Ranges of Levels of Bioavailable Heavy Metals (Mg/Kg) in Soil at Two Depths
| 0.0 -5.0cm | 5.0 – 10.0cm | |||
| Heavy | ||||
| metals | Mean±SD | Range | Mean±SD | Range |
| Cr | 0.26±0.13 | 0.17 - 0.41 | 0.19±0.07 | 0.13 - 0.26 |
| Cu | 0.03±0.01 | 0.02 - 0.04 | 0.01±0.01 | ND - 0.02 |
| Cd | 0.02±0.01 | 0.01-0.02 | 0.02±0.01 | ND - 0.03 |
| Zn | ND | ND | 0.50±0.44 | ND - 0.79 |
| Mn | 0.31±0.21 | 0.18 - 0.55 | 0.15±0.14 | ND - 0.27 |
| Ni | 0.22±0.19 | ND - 0.37 | 0.33±0.15 | 0.16 - 0.43 |
| Pd | 0.32±0.10 | 0.21 - 0.42 | 0.56±0.12 | 0.44 - 0.56 |
| Fe | 0.6±1.03 | ND - 1.79 | 25.17± 0.17 | 14.24 - 34.34 |
Key: ND- Not Detected
Table 11: Rainy Season Mean and Ranges of Levels of Bioavailable Heavy Metals (Mg/Kg) in Soil at Two Depths| 0.0 – 5.0cm | 5.0 – 10cm | |||
| Heavy | ||||
| metals | Mean±SD | Range | Mean±SD | Range |
| Cr | 0.21±0.21 | ND-0.43 | ND | ND |
| Cu | 0.02±0.01 | 0.02-0.03 | ND | ND |
| Cd | 0.03±0.01 | 0.02-0.04 | 0.02±0.01 | 0.01-0.04 |
| Zn | 0.09±0.06 | 0.04-0.15 | 0.03±0.01 | 0.01-0.04 |
| Mn | 0.09±0.03 | 0.05-0.12 | 0.11±0.05 | 0.06-0.13 |
| Ni | 0.18±0.02 | 0.15-0.20 | 0.05±0.00 | ND-0.16 |
| Pd | ND | ND | 0.08±0.00 | ND-0.25 |
| Fe | 1.21±1.05 | ND-1.90 | 1.05±0.91 | ND-1.61 |
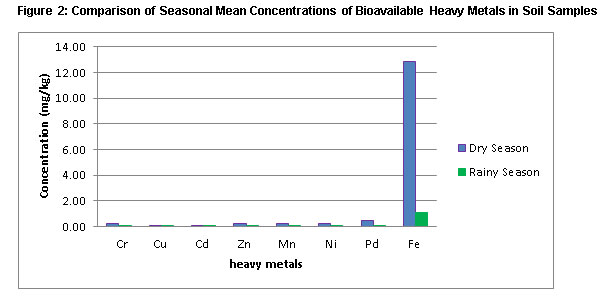 |
Figure 2: Comparison of Seasonal Mean Concentrations of Bioavailable Heavy |
Figure 2 illustrate the comparison of dry and rainy season levels of bioavailable heavy metals. Generally levels of bioavailable heavy metals were higher during dry season than rainy season. However, only levels of Pb were significantly higher during dry season than rainy season (P≤0.005).
Table 12: Pearson Correlation Coefficient (r) for Concentrations of Bioavailable Heavy Metal with Soil Properties during Dry Season
| pH | SOM | CLAY | CEC | |
| Cr | 0.24 | 0.69 | 0.27 | 0.33 |
| Cu | 0.4 | 0.36 | 0.47 | -0.31 |
| Cd | 0.26 | -0.31 | -0.74 | 0.83* |
| Zn | -0.36 | 0.22 | -0.4 | 0.72 |
| Mn | 0.17 | -0.28 | 0.54 | -0.34 |
| Ni | -0.36 | 0.21 | -0.31 | -0.25 |
| Pd | -0.39 | 0.51 | -0.13 | 0.4 |
| Fe | -0.90* | -0.08 | -0.47 | -0.03 |
Key: * Correlation is significant at the P≤0.005 level (2- tailed)
Table 13: Pearson Correlation Coefficient (r) for Concentrations of Bioavailable Heavy Metal with Soil Properties during Rainy Season
| pH | SOM | CLAY | CEC | |
| Cr | 0.38 | 0.56 | 0.37 | -0.01 |
| Cu | 0.77 | 0.57 | 0.22 | -0.04 |
| Cd | 0.18 | -0.16 | -0.43 | -0.07 |
| Zn | 0.58 | 0.47 | 0.16 | -0.17 |
| Mn | -0.66 | -0.85* | -0.57 | -0.44 |
| Ni | 0.45 | -0.09 | -0.41 | 0.14 |
| Pd | -0.5 | -0.89* | -0.89* | 0.27 |
| Fe | -0.06 | 0.69 | 0.89* | -0.16 |
Table 14: Correlation Coefficient Rating
| Coefficient (r) | |||
| Value | Rating | ||
| Exactly 1 | Perfect, | ||
| 0.99 to 0.90 | Very strong | ||
| 0.89 to 0.70 | Strong | ||
| 0.69 to 0.50 | Moderate, | ||
| <0.5 | Weak | ||
| Positive (+) | Uphill linear relationship | ||
| Negative (-) | Downhill linear relationship | ||
The various correlation coefficients (r) for the concentrations of each bioavailable heavy metal with properties of the soil samples during dry and rainy seasons are shown in Tables 12 and 13 respectively. While Table 14 shows the correlation rating.
The concentration of bioavailable heavy metal in soil increases with decrease in soil pH, OM, Clay content and CEC.3,32,37,38 This means that as soil pH, OM, Clay content or CEC decreases, the concentration of bioavailability heavy metals increases (downhill or negative linear relationship). Soil properties (Clay content, OM, pH and CEC) analysed in this study generally favour bioavailable heavy metal concentrations only in downhill linear relationships. Hence, during dry season (Table 12):pH is observed to favour the bioavailability of Zn, Ni and Pb in a weak downhill linear relationship and in a significant downhill relationship with Fe; SOM also favoured the bioavailability of, Cd and Mn and Fe in a downhill weak relationship; Clay favoured the availability of Zn, Ni, Pb, and Fe in a weak downhill relationship and Cd in a strong downhill relationship, while CEC favoured the bioavailability of Cu, Mn, Ni and Fe in a weak downhill relationship and a strong downhill relationship with Zn but had a strong significant uphill relationship with Cd, showing that bioavailability of Cd is highly not influenced by CEC. The downhill linear relationship observed for bioavailable Fe and all the soil properties during dry season (Fe/pH (r = -0.90), Fe/SOM (r = -0.08), Fe/Clay (r = -0.47) and Fe/CEC(r = -0.03) accounts for the high concentration of the bioavailable heavy metal during dry season (Figure 2).
During rainy season the only significant relationships were between Mn/SOM(r = -0.85*), Pb/SOM (r = -0.89), Pb/Clay (r = -0.89*) and Fe/Clay (r = 0.89*). The pH influenced the bioavailability of Mn (r =-0.66) and Pb (r = -0.50), with moderate downhill linear relationship, and Fe with a week linear downward relationship of r = -0.06. The bioavailability of Cd, and Ni were influenced by a weak downhill relationship with clay, a moderate downhill relationship with Mn (r = -0.57) and strong significant downward relationship with Pb (r = - 0.89*). For CEC, bioavailable Cr, Cu, Cd, Zn, Mn and Fe (Table 13) were all influenced by weak downhill relationship with CEC. The reduction in downhill relationship between Fe and the soil properties explains the reduced level of mean bioavailable heavy metal during rainy season compared to that in dry season (Figure 2).
Though concentrations of bioavailable heavy metals were higher in the dry season than in the rainy season, there were more significant correlation coefficients between the soil properties and bioavailable heavy metals. This thus favoured the bioavailability of certain heavy metals - Mn/SOM(r = -0.85*), Pb/SOM (r = -0.89), Pb/Clay (r = -0.89*) -more during rainy season than dry season. Hence, these heavy metals are probably more bioavailable for plant intake during dry season than rainy season.
Conclusion
This study revealed that soil in farms around Durumi rock quarry has heavy metals from both lithogenic and anthropogenic origins. The concentrations of total heavy metals in the soils were at moderate contamination levels and within WHO and FAO maximum allowable limits (mg/kg). This showed that the quarry activities did not lead to heavy metal pollution of the farm soils.
Certain heavy metals were more bioavailable during the rainy season for plant uptake and accumulation taking into account the observed increased significant correlation coefficients between soil properties and bioavailable heavy metals that favoured the bioavailability of certain heavy metals during rainy season than dry season.
It is thus pertinent to note that though heavy metal in the soils did not get to pollution levels, the physical properties of the soil favoured the bioavailability of most of the heavy metals. This can lead to easy mobility and availability of such heavy metals to surface and ground water or/and to be taken up by plants (vegetables and other food crops) planted in the farmlands. It is thus pertinent that periodic heavy metal assessment should be carried out for soils in this site and other farm lands to ensure continuous evaluation and monitoring.
Acknowledgement
The Department of Chemistry, Nasarawa state University, Keffi (NSUK) Nigeria, National Research Institute for Chemical Technology (NARICT) Zaria, Nigeria and National Soil and Water laboratory Kaduna, Nigeria are hereby acknowledged for the use of their facilities. Thanks to Dr Iwegbue C. M. A. of Delta State University, Abraka, Nigeria, for his valuable contribution.
References
- Olufemi J. A., Olubunmi S. S., Temitope B. Heavy metal pollution assessment of granite quarrying operations at Ikole-Ekiti, Nigeria. International Journal of Environmental Monitoring and Analysis. 2014;2(6):333-339.
CrossRef - Tiimub B. M., Sarkodie P. A., Monney I., Maxwell O. Heavy metal contamination of soil by quarry dust at Asonomaso in the Ashanti Region of Ghana. Chemistry & Materials Research. 2015;5(7):42.-50
- Sherene T. Mobility and transport of heavy metals in polluted soil environment. An International Journal. 2010;2(2):112-121.
- Islam E., Xiao-e Y., Zhen-li H., Qaisar M. Assessing potential dietary toxicity of heavy metals in selected vegetables and food crops. Journal Zhejiang University Science Bulletin. 2007;1(8):1-13.
CrossRef - Kim R. Y., Yoon J. K., Kim T. S., Yang J. E., Owens G., Kim, K. R. (2015). Bioavailability of heavy metals in soils: definitions and practical implementation-a critical review. Environ. Environmental Geochemical Health, 37, 1041–1061. DOI: 10.1007/s10653-015-9695-y
- Felix, Z. Evaluate long-term fate of metal contamination after mine spill: Assessing contaminant changes in soil. The Guadiamar Case Study; Southern Spain, MSc Thesis Wageningen University. 2014.
- Jaap S. Heavy Metals. The Netherlands: Centre for Soil Quality Management and Knowledge transfer, SKB Cahiers. 2010.
- Murray K. S., Rogers D. T., Kaufman M., M. (). Heavy metals in an urban watershed in Southeastern Michigan. Journal for Environmental Quality. 2004;33:163–172.
CrossRef - Felix Z. Evaluate long-term fate of metal contamination after mine spill: Assessing contaminant changes in soil. The Guadiamar Case Study; Southern Spain, MSc Thesis Wageningen University. 2014.
- Abdulhamed A. I., Suleiman R., Usman S. U., Kibon A. U., Azare I. M., Mallam I. & Kabiru Shehu. Assessment of heavy metals contamination in some soils used for urban agriculture in Abuja, Nigeria.Dutse Journal of Pure and Applied Sciences. 2017;3(1).
- Ekeocha I., Anunuso C.I. Comparative analysis of index of geoaccumulation of heavy metals in some selected auto mechanic soils in Abuja, Nigeria .Journal of Chemical. Society of. Nigeria. 2017;41(2):96-102
- Satellite Images of Mpape, (2015). Retrieved from www.mapalandia .com/ nigeria/fct/abyamin/mpape Assessed 10th Aug. 2015.
- Mallo I. Y. Y., Mgbanyi L. L. O. Assessment of soil wash and soil erodibility indices on miniature bad lands at Gada Biyu, Abuja, Federal Capital Territory, Nigeria Ethiopian Journal of Environmental Studies and Management. 2013;6(2):135-145.
- Ashraf M. A., Maah M. J., Yusoff I. Chemical speciation and potential mobility of heavy metals in the soil of former tin mining catchment. Chemical Speciation & Bioavailability. 2012;24(1):1- 11.
​​​​​​​CrossRef - Tukura B. W., Kagbu J. A., Gimba C. E. Effects of pH and total organic carbon (TOC) on the distribution of trace metals in Kubanni dam sediments, Zaria, Nigeria. Scienceworld Journal. 2007;2(3):1-6.
- Sikora F. J., Crouse K. K., Heckendorn S., Huluka G., Mitchell C.C., Moore K. P. Cation exchange capacity. In F. J. Sikora& K. P. Moore (Eds.), Soil test methods from the Southeastern United States. Southern Cooperative Series Bulletin. 2014;419:170-179.
- Zhang H., Wang J. J. Loss on ignition method. In F. J. Sikora & K. P. Moore (Eds.), Soil test methods from the Southeastern United States. Southern Cooperative Series Bulletin. 2014;419:155-157.
- Gee G. W., Bauder J. W. Particle-size Analysis. In A. Klute (ed.), Methods of Soil Analysis Part 1. Wisconsin, USA: Soil Science Society of America. 1986;383-411.
- Huluka G., Miller, R. Particle size determination by hydrometer method. In: In F. J. Sikora & K. P. Moore (Eds.), Soil test methods from the Southeastern United States. Southern Cooperative Series Bulletin. 2014;419:183-184.
- Pérez J. E. (2015). How to use the soil texture triangle. Retrieved from http://www.had2know.com/garden/classify-soil-texture-triangle-chart.html Assessed 10th Sept. 2015
- Parizanganeh A., Hajisoltanib P., Zamanic A. Concentration, distribution and comparison of total and bioavailable metals in top soils and plants accumulation in Zanjan Zinc Industrial Town-Iran. Procedia Environmental Sciences. 2010;2:167–174.
​​​​​​​CrossRef - TakáÄ P., Szabová T., Kozáková Ľ., Benková M. Heavy metals and their bioavailability from soils in the long-term polluted Central Spiš region of SR. Plant Soil Environment. 2009;55(4):167–172.
​​​​​​​CrossRef - Thermo Scientific,(2011) Applications Tip of the Week Matrix Spiking – Why Spike and How to Do It, Environmental & Process Instruments Division (EPD). www.thermoscientific.com/waterlibrary Retrieved 16/07/2018.
- Asaah V. A., ABimbola, A. F., Surh G. E. Heavy metal concentrations and distribution in surface soils of the Bassa Industrial zone 1. Dovala Cameroon. Arabian Journal of Science and Engineering. 2005;31(2A):147–158.
- Iwegbue C. M.A., Bassey F. I., Tesi G. O., Nwajei G. E., Tsafe A. I. Assessment of heavy metal contamination in soils around cassava processing mills in sub-urban areas of Delta state, southern Nigeria. Nigerian Journal of Basic and Applied Science. 2013;21(2):96-104.
​​​​​​​CrossRef - Olowookere B. T., Oyibo O., Oyerinde G. T. Heavy metals concentration in dumpsites at Gwagwalada, Abuja: Implications on sustainable environmental management. Greener Journal of Soil Science and Plant Nutrition. 2018;5( 1). 001-004. DOI:10.15580/GJSSPN.2018.1.020718019G5455554555555555545gghhhhhhhhhhhh
- Lacatusu R. Appraising levels of soil contamination and pollution with heavy metals. European Soil Bureau Research Report No 4. 2000.
- DPR (Department of petroleum resources) (2002).Environmental guidelines and standards for the petroleum industry in Nigeria (revised edition).Department of Petroleum Resources. Ministry of Petroleum and Natural Resources, Abuja, Nigeria
- Iwegbue., Chukwujindu M. A., Nwajei G. E., Eguavoen O., Ogala J. E. Chemical fractionation of some heavy metals in soil profiles in vicinity of scrap dumps in Warri, Nigeria, Chemical Speciation & Bioavailability. 2009;21(2):99-110, DOI: 10.3184/095422909X449490
​​​​​​​CrossRef - Effiong U. E., Gilbert U. A. (2012).Assessment of toxic heavy metal loading in topsoil samples within the vicinity of a limestone quarry in South Western Nigeria. African Journal of Environmental Science and Technology Vol. 6(8), 322-330, DOI: 10.5897/AJEST12.041
​​​​​​​CrossRef - Azeh Y., Umar M. T., Sani M. D. The impact of man’s activities on the heavy metals levels in soils in Wuse District, Abuja, Nigeria. Der Chemica Sinica. 2011;2(6):181-188.
- FijaÅ‚kowski K., Kacprzak M., Grobelak A., Placek A. The influence of selected soil parameters on the mobility of heavy metals in soils. Inżynieria i Ochrona Åšrodowiska. 2012;15(1):81–92.
- Oliveira H. (2012). Chromium as an Environmental Pollutant: Insights on Induced Plant Toxicity. Journal of Botany. 2012;1- 8.
​​​​​​​CrossRef - Nagajyoti P. C., Lee K. D., Sreekanth T. V. M. Heavy metals, occurrence and toxicity for plants: a review. Environmental Chemistry Letters. 2010;8:199–216. DOI 10.1007/s10311-010-0297-8
​​​​​​​CrossRef - Olaniran A. O., Balgobind A., Pillay B. Bioavailability of heavy metals in soil: Impact on microbial biodegradation of organic compounds and possible improvement strategies. International Journal of Molecular Sciences. 2013;14:10197- 10228.
​​​​​​​CrossRef - Chiroma T. M., Ebewele R. O., Hymore F. K. Comparative assessment of heavy metal levels in soil, vegetables and urban grey waste water used for irrigation in Yola and Kano. International Refereed Journal of Engineering and Science. 2014;3(2):01-09.
- Porteus A. Hazardous Waste Management Handbook, Butterworths and Co Publishers, UK. 1985;305.
- Krogstad T. I. Effect of liming and decomposition on chemical composition, ion exchange and heavy metal ion selectivity in Sphagnum Peat. Scientific Reports of the Agricultural University of Norway. 983;79.
- Carrilloâ€Gonzalez R., Jirka S., Se´bastien S., Domy A. Mechanisms and pathways of trace element mobility in soils. Advances in Agronomy. 2006;91:111-178.
​​​​​​​CrossRef - Adewuyi G. O., Osobamiro M. T. Chemical Speciation and Potential Mobility of Some Toxic Metals in Tropical Agricultural Soil. Research Journal of Environmental Toxicology. 2016;10:159-165.
CrossRef - Abimbola A. (2 018).Best practices for the remediation of soils impacted by cadmium and other heavy metals. Instituto Interamericano de Cooperation para la Agricultura. http://www.iica.int/sites/default/files/events/presentations/2016-07/cadmium_in_cocoa.pdf Retrieved 02/08/2018
- Katharine Brown & Jeremy Lemon (2018). Soilquality.org.au Fact Sheets: Cations and Cation Exchange Capacity. http://www.soilquality.org.au/factsheets/cation-exchange-capacity Retrieved 02/08/2018
- Cornell University Cooperative Extension (CUCE) (2007) Cation Exchange Capacity (CEC). Agronomy Fact Sheet Series #22. Department of Crop and Soil Sciences, College of Agriculture and Life Sciences, Cornell University.
- Rumsey D. J. Statistics for Dummies, 2nd Edition. John Wiley & Sons, Inc. UK. 2016.


