Assessment of Heavy Metals in Relation to Soil Pollution at Mewat, Haryana, India
Gopal Krishan1
*
 , S.K Chandniha2
*
, A.K Lohani1
, Brijesh Kumar Yadav3
, Naresh Kumar Arora4
, Surjeet Singh1
, C.P. Kumar1
, Lalit Mohan Sharma5
and A.K Bhardwaj4
, S.K Chandniha2
*
, A.K Lohani1
, Brijesh Kumar Yadav3
, Naresh Kumar Arora4
, Surjeet Singh1
, C.P. Kumar1
, Lalit Mohan Sharma5
and A.K Bhardwaj4
1
National Institute of Hydrology,
Roorkee,
India
2
Indira Gandhi Agricultural University,
Raipur,
India
3
Indian Institute of Technology,
Roorkee,
India
4
Central Soil Salinity Research Institute,
Karnal,
India
5
Sehgal Foundation,
Gurgaon,
India
http://dx.doi.org/10.12944/CWE.13.3.04
Assessment of heavy metals in soils is important in context of human health as these may either pollute the agricultural crops or may move deeper into the groundwater. There has been no such work been carried out in the soils of Mewat district. In the present study, to investigate the soil heavy metal pollution characteristics 15 samples and 3 typical soil profiles were collected from 2 blocks of Mewat district, Haryana and were analyzed for contents of Arsenic (As), copper(Cu), cadmium (Cd), zinc(Zn), iron (Fe), manganese (Mn) and nickel(Ni). Concentrations of As, Cd and Ni in soils are less than their toxicity levels while concentrations of Fe, Mn, Zn and Cu are found exceeding the toxicity levels. Based on the results, soil in the study area are polluted by heavy metals viz. Fe, Mn, Zn and Cu. According to principal component analysis, distinct groups of heavy metals were discriminated between natural or anthropogenic sources.
Copy the following to cite this article:
Krishan G, Chandniha S. K, Lohani A. K, Yadav B. K, Arora N. K, Singh S, Kumar C. P, Sharma L. M, Bhardwaj A. K. Assessment of Heavy Metals in Relation to Soil Pollution at Mewat, Haryana, India. Curr World Environ 2018;13(3). DOI:http://dx.doi.org/10.12944/CWE.13.3.04
Copy the following to cite this URL:
Krishan G, Chandniha S. K, Lohani A. K, Yadav B. K, Arora N. K, Singh S, Kumar C. P, Sharma L. M, Bhardwaj A. K. Assessment of Heavy Metals in Relation to Soil Pollution at Mewat, Haryana, India. Curr World Environ 2018;13(3). Available from: https://bit.ly/2GIqkgU
Download article (pdf)
Citation Manager
Publish History

Introduction
Soil heavy metal pollution is worldwide and in terrestrial ecosystems, soils dish up as the most important sink1,2 and generally considered to be originating either from geogenic or natural sources or the anthropogenic sources such as agrochemicals and mineral fertilizers, industrial wastes, sewage sludge etc.3,4,5,6 As a result of increasing population, urbanization, agricultural activities, heavy metal pollution in agricultural soils is the matter of concern causing various health impacts7,8 and their higher concentration in deeper layers can contaminate the groundwater9,10 due to their mobility in soils. Therefore, it has become important to assess heavy metal pollution in soil.
Study Area
Mewat district a semi-arid region in Haryana (Fig. 1) that covers about 1500 sq. km. geographical area with population of 1,089,406 (2011-Census)11 is one of the major agricultural areas with scarce perennial surface water sources and groundwater is the main source of water for irrigation and domestic use. The major crops grown in the area are: wheat, millet and mustard, vegetable crops like onion, tomato, eggplant, chilly, etc. Mewat receives low annual rainfall i.e. 577 mm, limited to a period of 23-35 days in the year.
Methodology
There are problems of excessive salinity in Nagina block and water level is decreasing in Tauru block12 and the problem of salinity is also affecting the water quality in semi-arid regions.13 The salinity zone in Nagina block is expanding into the fresh water zone towards the Aravali ranges.14 Keeping this in view, the agricultural soil samples were collected from 3 places namely Ulheta, Karhera/Ghagas and Tauru covering 2 blocks namely Nagina and Tauru. The samples were collected from 5 different depths as 0-30 cm, 30-60cm, 60-90cm, 90-120 cm, 120-150 cm. The soil samples were air dried, grinded and analysed for As, Fe, Mn. Cd, Ni, Cu and Zn on ICP-OES (make: Shimadzu) at Central Analytical Facility, CSSRI (ICAR), Karnal.
The instrument is based on the emission principle and involves the measurement of the intensity of the characteristic radiations of the element to be determined. Argon serves as sample carrier gas and help in producing plasma by interacting the oscillating magnetic field generated by the radio frequency generator in the coil. The sample is aspirated by nebulizers and injected into the plasma, causing the excited neutral atoms or ions within the sample to emit radiation of specific wavelengths. The emitted radiations are observed by the light tube through the entrance slit of a spectrometer which illuminates the diffraction grating. Radiations are separated into its component wavelengths and are incident on a photo multiplier tube. The photo multiplier tube produces a signal directly proportional to the intensity of the impinged light. This signal is then processed by the measuring system. It used for the estimation of more than 50 elements present in water, soil and plant extract. It measured all the elements selected during calibrating the instrument through the PC in one aspiration.
The soil texture at Ulheta is loamy sand to sandy loam, at Karhera/Ghagas is sandy loam to silty loam and at Tauru is Sandy loam. Principal Component Analysis (PCA), a multivariate assessment technique where large variations are explained but number of variables reduced to group of individuals and this technique has been used to estimate spatial and temporal patterns of heavy metal contamination.15
 |
Figure 1: Study area showing |
Results and Discussion
The mean concentration of all the samples for all 3 sites is shown in Table 1 and Fig. 2. The average contents of As, Cd, Ni, Cu, Fe, Mn and Cu were reported 0.0271 ppm, 0.0272 ppm, 0.1182 ppm, 41.1 ppm, 511.5 ppm, 567.9 ppm and 18.8 ppm, respectively in soils of Mewat. Among all the sites, maximum As, Cd and Ni to the tune of 0.0316 ppm, 0.0306 ppm and 0.1528 ppm, respectively were reported from Ulheta followed by 0.0282 ppm, 0.0288 ppm and 0.1192 ppm, respectively at Karhera and minimum at 0.0216 ppm, 0.0222 ppm and 0.0826 ppm, respectively at Tauru. Generally, it was found that As, Fe, Mn, Cd, Ni, Cu concentrations were found more at the depth range of 30-60cm.
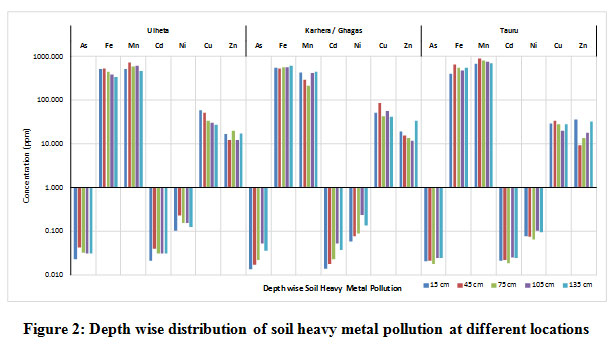 |
Figure 2: Depth wise distribution of soil |
Table 1: Heavy metal concentration in soils of Mewat.
|
Location |
Concentration |
ppm |
||||||
|
As |
Cd |
Ni |
Cu |
Fe |
Mn |
Zn |
||
|
Ulheta |
Minimum |
0.0225 |
0.0212 |
0.1030 |
26.8 |
333.8 |
468.0 |
12.2 |
|
Maximum |
0.0419 |
0.0399 |
0.2260 |
57.7 |
529.8 |
716.0 |
19.6 |
|
|
Average |
0.0316 |
0.0306 |
0.1528 |
39.8 |
441.6 |
580.0 |
15.7 |
|
|
Karhera/Ghagas |
Minimum |
0.0133 |
0.0138 |
0.0587 |
41.8 |
528.8 |
216.0 |
11.7 |
|
Maximum |
0.0526 |
0.0527 |
0.2360 |
85.1 |
613.8 |
442.0 |
33.8 |
|
|
Average |
0.0282 |
0.0288 |
0.1192 |
55.6 |
565.8 |
359.0 |
18.8 |
|
|
Tauru |
Minimum |
0.0178 |
0.0184 |
0.0650 |
20.0 |
403.8 |
667.0 |
9.2 |
|
Maximum |
0.0244 |
0.0250 |
0.1020 |
33.5 |
644.8 |
888.0 |
35.7 |
|
|
Average |
0.0216 |
0.0222 |
0.0826 |
27.8 |
527.2 |
764.8 |
21.8 |
|
|
Overall |
Minimum |
0.0133 |
0.0138 |
0.0587 |
20.0 |
333.8 |
216.0 |
9.2 |
|
|
Maximum |
0.0526 |
0.0527 |
0.2360 |
85.1 |
644.8 |
888.0 |
35.7 |
|
|
Average |
0.0271 |
0.0272 |
0.1182 |
41.1 |
511.5 |
567.9 |
18.8 |
|
Toxic limit (Minhas and Samra, 2004) [16] |
15.000 |
15.000 |
1.000 |
10.000 |
150.0 |
10.0 |
20.0 |
|
Correlation
The correlation matrix of three sampling sites is shown in Tables 2-4. Arsenic (As) has strong/perfect positive correlation with Cd and Ni at all places. At Ulheta strong positive correlation was found between Fe and Cu; Ni and Mn; a high and positive correlation of Mn was also found with As and Cd at Ulheta (Table 2).
At Karhera, good and positive correlation of Fe was observed with As and Cd, while high negative correlation of Fe was found with Cu (Table 3). Fe had a strong positive correlation with Mn at Tauru (Table 4). The variation in correlation may be due to contribution of these heavy metals from different sources.
Table 2: Correlation among heavy metals at Ulheta.
|
|
As |
Cd |
Ni |
Cu |
Fe |
Mn |
Zn |
|
As |
1 |
|
|||||
|
Cd |
0.997 |
1 |
|
||||
|
Ni |
0.964 |
0.946 |
1 |
|
|||
|
Cu |
0.979 |
0.960 |
0.991 |
1 |
|
||
|
Fe |
0.879 |
0.838 |
0.944 |
0.957 |
1 |
|
|
|
Mn |
0.806 |
0.770 |
0.934 |
0.892 |
0.920 |
1 |
|
|
Zn |
-0.545 |
-0.571 |
-0.598 |
-0.499 |
-0.337 |
-0.615 |
1 |
In bold, significant values (except diagonal) at the level of significance alpha=0.050 (two-tailed test)
Table 3: Correlation among heavy metals at Karhera/Ghagas.
|
|
As |
Cd |
Ni |
Cu |
Fe |
Mn |
Zn |
|
As |
1 |
|
|||||
|
Cd |
1.000 |
1 |
|
||||
|
Ni |
0.986 |
0.985 |
1 |
|
|||
|
Cu |
-0.371 |
-0.379 |
-0.246 |
1 |
|
||
|
Fe |
0.500 |
0.508 |
0.352 |
-0.892 |
1 |
|
|
|
Mn |
0.778 |
0.778 |
0.716 |
-0.189 |
0.563 |
1 |
|
|
Zn |
0.019 |
0.024 |
-0.130 |
-0.388 |
0.698 |
0.535 |
1 |
In bold, significant values (except diagonal) at the level of significance alpha=0.050 (two-tailed test).
Table 4: Correlation among heavy metals at Tauru.
|
|
As |
Cd |
Ni |
Cu |
Fe |
Mn |
Zn |
|
As |
1 |
|
|||||
|
Cd |
1.000 |
1 |
|
||||
|
Ni |
0.971 |
0.975 |
1 |
|
|||
|
Cu |
-0.491 |
-0.506 |
-0.685 |
1 |
|
||
|
Fe |
-0.481 |
-0.495 |
-0.663 |
0.958 |
1 |
|
|
|
Mn |
-0.676 |
-0.681 |
-0.740 |
0.650 |
0.811 |
1 |
|
|
Zn |
0.623 |
0.620 |
0.584 |
-0.249 |
-0.469 |
-0.897 |
1 |
In bold, significant values (except diagonal) at the level of significance alpha=0.050 (two-tailed test).
.
Depth Distribution of Heavy Metals
Depth wise distribution of heavy metals at all the 3 sites is shown in figures 3-5. At Ulheta, and Tauru upto 30% of the depth, the heavy metal concentration is increasing sharply but after that gradual increase in observed (fig. 6, 7) while at Karhera/Ghagas, concentration of As, Fe, Mn and Cu is found increasing constantly at all depths but trend is not same for Cd, Ni and Zn.
Principal Component Analysis (PCA)
Tables 5,6,7 represent the statistics of PCA which includes the eigenvalue, percentage of variance and cumulative variance. It is observed that only 1 factor at Ulheta (Table 5) and 2 factors (Tables 6 &7) present with eigenvalue greater than 1. In Ulheta factor 1 explains 84.787 % of variance in the data (Table 3), in Karhera factors 1 & 2 explain variance of 61 and 21.656 %, respectively while at Tauru factors 1 & 2 explain variance of 72.876 and 15.967 %, respectively.
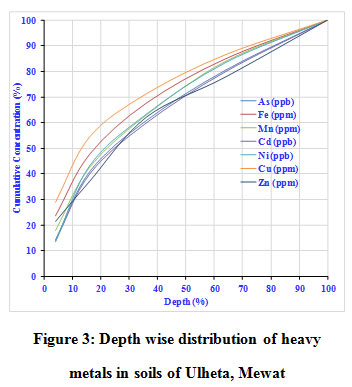 |
Figure 3: Depth wise distribution of heavy metals in soils of Ulheta, Mewat. |
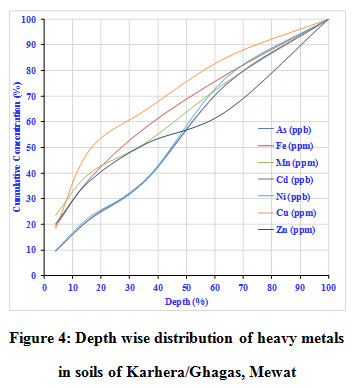 |
Figure 4: Depth wise distribution of heavy metals in soils of Karhera/Ghagas, Mewat. |
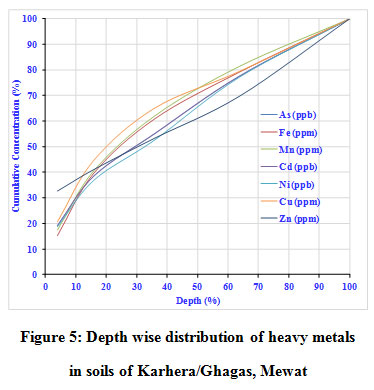 |
Figure 5: Depth wise distribution of heavy metals in soils of Karhera/Ghagas, Mewat. |
Table 5:Total Variance (Ulheta).
|
|
F1 |
F2 |
F3 |
|
Eigenvalue |
5.935 |
0.740 |
0.325 |
|
% variance |
84.787 |
10.575 |
4.638 |
|
Cumulative % |
84.787 |
95.362 |
100.000 |
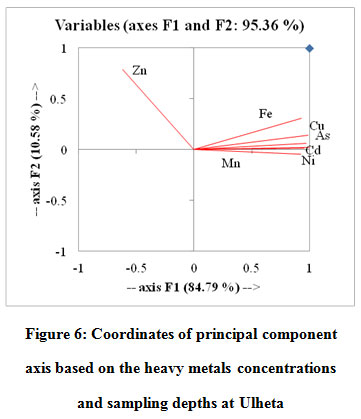 |
Figure 6: Coordinates of principal component axis based on the heavy etals concentrations and sampling depths at Ulheta. |
Figures 3, 4 &5 shown that the ï¬rst two principal components provided a general view on the temporal and spatial variations of soil metal contamination. In Ulheta, PC 1 contributing 84.79% was positively affected by Fe, Cu, As, Cd, Ni and Mn and negatively affected by Zn while PC 2 contributing 10.58 % was positively affected by Zn, Fe, Cu, As, Cd and negatively affected by Ni and Mn (fig. 6).
In Karhera, PC 1 contributing 61% was positively affected by all the heavy metals except for Cu while PC 2 contributing 26.66 % was positively affected by Zn, Fe and negatively affected by Cu, As, Cd, Ni and Mn (Fig. 7).
In Tauru, PC 1 contributing 72.88 % was positively affected by As, Cd, Ni, Zn and negatively affected by Cu, Fe and Mn while PC 2 contributing 15.97 % and was positively affected by all the heavy metals (Fig. 8).
Table 6: Total Variance (Karhera/Ghagas)
|
|
F1 |
F2 |
F3 |
|
Eigenvalue |
4.270 |
1.866 |
0.864 |
|
% variance |
61.004 |
26.656 |
12.341 |
|
Cumulative % |
61.004 |
87.659 |
100.000 |
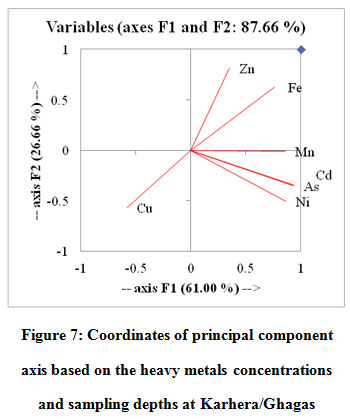 |
Figure 7: Coordinates of principal component axis |
Table 7: Total Variance (Tauru).
|
|
F1 |
F2 |
F3 |
|
Eigenvalue |
5.101 |
1.118 |
0.781 |
|
% variance |
72.876 |
15.967 |
11.157 |
|
Cumulative % |
72.876 |
88.843 |
100.000 |
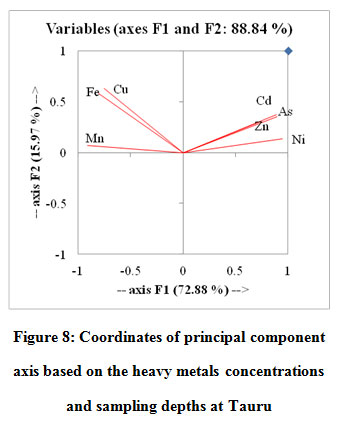 |
Figure 8: Coordinates of principal component |
Conclusion
Analysis of depth wise soil samples in Mewat shows that concentrations of As, Cd and Ni in soils are less than their toxicity levels while concentrations of Fe, Me, Zn and Cu are found exceeding the toxicity levels. Based on the results, soil in the study area could be considered partially polluted by heavy metals. According to principal component analysis, distinct groups of heavy metals were discriminated between natural or anthropogenic sources. Proper soil and crop management methods can help prevent uptake of pollutants by plants, leaving them in the soil and requires appropriate treatment with suitable techniques.
Acknowledgements
Authors acknowledge the support provided by Director, NIH. The funding received from NHP is duly acknowledged. Thanks for the laboratory staff of CSSRI, Karnal for helping in analysis of soil samples.
References
- LiX Y., LiuL J., Wang Y. G., Luo G. P., Chen X., Yang X. L., etal. Heavy metal contamination of urban soil in an old industrial city (Shenyang) in Northeast China. Geoderma. 2013;192:50–58.
CrossRef - Liu X. M., WuJ. J., XuJ. M. Characterizing the risk assessment of heavy metals and sampling uncertainty analysis in paddy field by geostatistics and GIS. Environ Pollut. 2006;141:257–264.
CrossRef - Zhang Ch. Sh. Using multivariate analyses and GIS to identify pollutants and their spatial patterns in urban soils in Galway, Ireland. Environmental Pollution. 2006;142:501–511.
CrossRef - Jiao X., Teng Y., Zhan Y., WuJ, Lin X, Soil Heavy Metal Pollution and Risk Assessment in Shenyang Industrial District, Northeast China. PLoS ONE. 2015;10(5):e0127736.
CrossRef - Nath S., Rai A., Gurung K., Das M., Pradhan M., Burman S., Haldar P. Comparison of heavy metals level in Grasses and Grasshoppers from Darjeeling Hills. Journal of Hill Research. 2008;21(2):67-69.
- Wadia D. N. 1998. Geology of india, 4th edition. Tata McGraw Hill Publication Co. Ltd., New Delhi. 454.
- Sun Y., Zhou Q., XieX., Liu R. Spatial, sources and risk assessment of heavy metal contamination of urban soils in typical regions of Shenyang, China. J Hazard Mater. 2010;174:455–462.
CrossRef - Xie Y.,Chen T. B.,Lei M.,Yang J.,Guo Q. J.,Song B. Spatial distribution of soil heavy metal pollution estimated by different interpolation methods: accuracy and uncertainty analysis. Chemosphere. 2011;82(3):468–476.
CrossRef - Richards B. K., SteenhuisT. S., Peverly J. H., McBride M. B. Metal mobility at an old, heavily loaded sludge application site. Environ Pollut. 1998;99(3):365–377.
CrossRef - Camobreco V. J., Richards B. K., Steenhuis T. S.,Peverly J. H., McBride M. B. Movement of heavy metals through undisturbed and homogenized soil columns. Soil Science. 1996;161:740–750.
CrossRef - Census 2011. Mewat Data Sheet-Census. Available at: www.census2011.co.in/census/district/226-mewat.html. Accessed 18 July, 2018.
- Priyanka., Krishan G., Sharma L. M., Yadav B. K., Ghosh N. C. 2016. Analysis of Water Level Fluctuations and TDS Variations in the Groundwater at Mewat (Nuh) District, Haryana (India). Current World Environment. 11(2): 388-398.
CrossRef - Krishan G., Rao M. S., Kumar C. P., Kumar S., Loyal R. S., Gill G. S., Semwal P. Assessment of Salinity and Fluoride in Groundwater of Semi-Arid Region of Punjab, India. Curr World Environ. 2017;12(1):34-41.
CrossRef - Thomas N., Sheler R., Reith B., Plenner S., Sharma L. M., Saiphy S., Basu N., Muste M. M. (2012). Rapid Assessment of the Fresh-Saline Groundwater Interaction in the Semi-arid Mewat District (India). University of Iowa's Winterim Program Development of Resilient and Sustainable Agricultural Watersheds. https://www.iihr.uiowa.edu/intl-perspectives2011-12/home/outcomes/%e2%80%a2paper-for-international-shallow-water-conference-rapid-assessment-of-the-fresh-saline-groundwater-interaction-in-the-semi-arid-mewat-district-india (Assessed on October 06, 2018).
- Shine J. P., Ika R. V., Ford T. E. Multivariate statistical examination of spatial and temporal patterns of heavy metal contamination in New Bedford Harbor marine sediments. Environmental Science and Technology. 1995;29:1781–1788.
CrossRef - Minhas P. S., Samra J. S. Waste water use in peri-urban agriculture impacts and opportunities. Tech, Bull. 2/2004, Central Soil Research Institute, Karnal, 132001, India. 2004;74.


