Forest Fire Risk Assessment Using Fuzzy Analytic Hierarchy Process
Divya Mehta1
*
 , Parminder Kaur Baweja1
and R. K. Aggarwal1
, Parminder Kaur Baweja1
and R. K. Aggarwal1
1
Department of Environmental Science,,
Dr. Y. S. Parmar University of Horticulture and Forestry Nauni,
College of Forestry,
Solan,
173230
India
http://dx.doi.org/10.12944/CWE.13.3.05
Copy the following to cite this article:
Mehta D, Baweja P. K, Aggarwal R. K. Forest Fire Risk Assessment Using Fuzzy Analytic Hierarchy Process. Curr World Environ 2018;13(3). DOI:http://dx.doi.org/10.12944/CWE.13.3.05
Copy the following to cite this URL:
Mehta D, Baweja P. K, Aggarwal R. K. Forest Fire Risk Assessment Using Fuzzy Analytic Hierarchy Process. Curr World Environ 2018;13(3). Available from: https://bit.ly/2TF0f4r
Download article (pdf)
Citation Manager
Publish History

Introduction
Forest fires are extensive and critical facet of the world. The annual global area burned due to forest fire ranges from 300 and 450 Mha.1 Over 80 percent of the global area burned occurs in grasslands and savannahs, primarily in South Asia, Africa, Australia and South America. Globally fires are frequent over most of the earth except in areas of scant vegetation and near the poles.2
India witnesses most of severe forest fires during the summer season in the hills of Himachal Pradesh.3 Forest fires have caused extensive damage in recent years leading to loss ofwildlife habitat and biodiversity, change in micro-climate, adverse effect on livelihood of people, addition of green-house gases etc.. Average estimated loss due to forest fire in Himachal Pradesh is INR 113 million per annum.4 The forests of Himachal Pradesh are mainly comprised of Chir, Oak, Deodara, Khair, Saal, Bamboo and other broad-leaved tree species. Out of above species area occupied by Chir is highly prone to forest fires due to shedding of highly inflammable chir needles.5 The forests of the Solan district are occupied by pure and mixed stands of chir pine and mostly conform to lower Shiwalik chir pine (9C1a) forest type and covers 7.68 per cent of total area of district 5-6. There was need to generate forest fire risk zone for the study area in order to carry out prevention and management measures.
Common practice of Forest Fire Risk Zones has been delineated by assigning knowledge base weights to the risk factor classes according to their sensitivity to fire. Fuzzy Analytic Hierarchy Process (FAHP) has been used as multi-criteria decision analysis (MCDA) tool for weight estimation.7-9
Study Area
The study was carried out in Solan district of Himachal Pradesh, India. Solan occupied 10 percent area of the state i.e. 1,93,600 hectares. The area was primarily occupied by Pinus roxburghii, Quercus leucotric hophora, Acacia catechu, bamboos and other broad leaved tree species. Average daily mean temperature, relative humidity and annual rainfall were 18.4 °C, 1038.2 mm and 51.2 %, respectively.
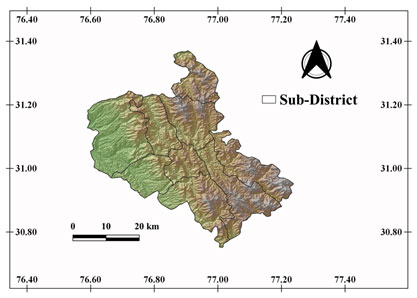 |
Figure 1 click here to view figure |
Materials and Methods
In this investigation Saaty’s (1998)7Fuzzy Analytic Hierarchy Process (FAHP) was used. FAHP is Multi-criteria Decision Making methodology which involves decision-making framework to rank and prioritize the forest fire risk factors. Table 1 summarizes the related work done over the world.
Table 1: Summary of related works.
|
First Author |
Year |
Place of Study |
Title of Research Work |
Variable Studied and Fire Risk Model |
|
Aumedes10 |
2017 |
Global |
Human-caused fire occurrence modelling in perspective: a review |
Distance from roads, railways, urban areas and settlements Model: HCF model (Human Caused Fire) |
|
Ruffault11 |
2017 |
France |
Contribution of human and biophysical factors to the spatial distribution of forest fire ignitions and large wildfires in a French Mediterranean region |
Human activities and settlements |
|
Ajin12 |
2016 |
Kerala, India |
Forest Fire Risk Zone Mapping Using RS and GIS Techniques: A Study in Achankovil Forest Division, Kerala, India |
Distance from roads and distance from settlements Model: FRI (Fire Risk Index) |
|
Baweja13 |
2014 |
Himachal Pradesh, India |
Perceptions of communities exposed to forest fires in western Himalayan region of India |
Family size and literacy rate |
|
Vilar14 |
2014 |
Europe |
Modelling socio-economic drivers of forest fires in the Mediterranean Europe. |
Population density, road networks, wildland-urban interface, railway network, protected area, landscape fragmentation etc. Model: Logistic Regression Model |
|
Spies15 |
2014 |
Oregon |
Examining fire-prone forest landscapes as coupled human and natural systems |
Ownership of land |
|
Ganteaume16 |
2013 |
Europe |
A review of the main driving factors of forest fire ignition over Europe |
Unemployment rate, transport networks and distance to urban areas |
|
Lafragueta17 |
2013 |
Spain |
GIS and MCE-based forest fire assessment and mapping- A case study in Huesca, Aragon,Spain |
Distance from roads, railway track, camping and settlements Model: FRI (Fire Risk Index) |
|
Sharma18 |
2012 |
Himachal Pradesh, India |
Fuzzy AHP for forest fire risk modeling |
Distance from road and distance from settlement Model: CFRISK (Cumulative Fire Risk Index) |
|
Gai19 |
2011 |
China |
GIS-based Forest Fire Risk Assessment and Mapping |
Population density and value of forest resources Model: FRI (Fire Risk Index) |
|
Hoyo20 |
2011 |
Spain |
Logistic regression models for human-caused wildfire risk estimation: analysing the effect of the spatial accuracy in fire occurrence data |
Road infrastructure, recreational and natural protected areas, Cattle-grazing pressure, Buffer of electric lines etc. Model: Logistic Regression Models |
|
Archibald21 |
2010 |
South Africa |
Southern African fire regimes as revealed by remote sensing |
Population density Model: FRP (Fire Radiative Power Index) |
|
Calcerrada22 |
2010 |
Spain |
Spatial modelling of socioeconomic data to understand patterns of human-caused wildfire ignition risk in the SW of Madrid (central Spain) |
Population, secondary housing, cattle, sheep and goats |
|
Vadrevu23 |
2010 |
Andhra Pradesh, India |
Fire Risk Evaluation using multi-criteria analysis- A case study |
Population density, agricultural workers, nutritional density and literacy rate Model: Analytical Hierarchy Process (AHP) |
|
Leone24 |
2009 |
Mediterranean region |
Human factors of fire occurrence in the Mediterranean |
Agricultural burning, bonfires, power line, engines, machines etc. |
|
Martinez25 |
2008 |
Spain |
Human-caused wildfire risk rating for prevention planning in Spain |
Rural exodus, forest lands, rural population aging or declining, fuel accumulation in abandoned agricultural lands, lack of interest in conservation etc. Model: Logistic Regression Model |
|
Maingi26 |
2007 |
United States of America |
Factors influencing wildfire occurrence and distribution in eastern Kentucky, USA |
Unemployment rates, distance to roads and distance to populated places |
|
Yang27 |
2007 |
United States |
Spatial Patterns of Modern Period Human-Caused Fire Occurrence in the Missouri Ozark Highlands |
Roads, municipalities, ownership, and population density |
|
Rawat28 |
2003 |
Uttarakhand, India |
Fire Risk Assessment for Forest Fire Control Management in Chilla Forest Range of Rajaji National Park, Uttaranchal, India |
Road index and settlement index Model: CFRISK (Cumulative Fire Risk Index) |
Hierarchical Structure Development of Fire Risk Criteria
We used population density (PD), agricultural workers (AGRI-W), literacy rate (LR) nutritional density (ND), distance from road (DR), fuel type (FT), aspect (A), slope (S) and elevation (E) for evaluating the fire risk in the study area (Fig. 2).Fuzzy Analytic Hierarchy model was followed in order to construct the hierarchical structure, for reckoning fire risk (Fig. 2).
Relevant socio-economic data for sub-districts of Solan were collected from District Census Handbook. Road maps, Terrain maps and fuel type maps were generated using Shuttle RADAR Topographic Mission (90m), GLOBECOVER (300m) and GLCF, respectively.
 |
Figure 2: Hierarchical data organization for quantifying fire in the study area. click here to view figure |
Forest Fire Risk Index
All factors were classified into five classes, where higher value represented more risk as compared to the lower values (Table 2).
Table 2: Index value and fire rating classes for forest fire risk parameters.
|
Parameter |
Class |
Index Value |
Fire rating class |
|
Population Density (Peoplekm-2) |
0-150 |
1 |
Very low |
|
150-300 |
2 |
Low |
|
|
300-450 |
3 |
Moderate |
|
|
450-600 |
4 |
High |
|
|
≥600 |
5 |
Very high |
|
|
Literacy Rate (%) |
0-20 |
5 |
Very high |
|
20-40 |
4 |
High |
|
|
40-60 |
3 |
Moderate |
|
|
60-80 |
2 |
Low |
|
|
80-100 |
1 |
Very low |
|
|
Agricultural Workers (people) |
0-5000 |
1 |
Very low |
|
5000-10000 |
2 |
Low |
|
|
10000-15000 |
3 |
Moderate |
|
|
15000-20000 |
4 |
High |
|
|
≥20000 |
5 |
Very high |
|
|
Nutritional Density (People km-2) |
0-100 |
1 |
Very low |
|
100-200 |
2 |
Low |
|
|
200-300 |
3 |
Moderate |
|
|
300-400 |
4 |
High |
|
|
≥400 |
5 |
Very high |
|
|
Distance from Road Network (km) |
0-1.00 |
5 |
Very high |
|
1.00-2.00 |
4 |
High |
|
|
2.00-3.00 |
3 |
Moderate |
|
|
3.00-4.00 |
2 |
Low |
|
|
≥ 4.00 |
1 |
Very low |
|
|
Fuel Type |
Conifer Forest |
5 |
Very high |
|
Broad-leaved Forest |
4 |
High |
|
|
Mixed Forest |
3 |
Moderate |
|
|
Scrub Lands |
2 |
Low |
|
|
Cultivated Areas |
2 |
low |
|
|
|
Urban Areas |
1 |
Very low |
|
|
Bare Areas |
1 |
Very low |
|
Aspect |
North |
1 |
Very low |
|
Northeast |
1 |
Very low |
|
|
Northwest |
2 |
Low |
|
|
West |
2 |
Low |
|
|
East |
3 |
Moderate |
|
|
|
Southeast |
4 |
High |
|
|
Southwest |
5 |
Very high |
|
|
South |
5 |
Very high |
|
Elevation (m) |
≤500 |
5 |
Very high |
|
500-1000 |
4 |
High |
|
|
1000-1500 |
3 |
Moderate |
|
|
1500-2000 |
2 |
Low |
|
|
≥2000 |
1 |
Very low |
|
|
Slope |
0-10 |
1 |
Very low |
|
(degree) |
10-20 |
2 |
Low |
|
|
20-30 |
3 |
Moderate |
|
|
30-40 |
4 |
High |
|
|
≥40 |
5 |
Very high |
 |
Figure 3: Index map for socio-economic and bio-physical factors. |
Fuzzy Analytic Hierarchy Process (FAHP)
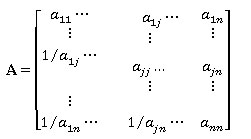
FAHP was used for determining weights for the parameters. A judgmental pair wise comparison matrix ‘A’, was formed using the comparison scales (Table 3). Each entry aij of the matrix ‘A’ was formed comparing the row element ai with the column element aj .29
A=(a_ij ) (i,j…n=1,2…n;n= number of criteria)
The entries a_ij in matrix ‘A’ were done following rules given below:
a_ij>0;a_ij=â–¡(1/a_ji );a_ii=1 for all i
Consistency of comparisons
The value of ÊŽmax was required to calculate the consistency ratio (CR).24
Consistency index (CI) = (ÊŽmax–n) / (n-1).
Where; ÊŽmax = largest eigen value and n = number of criteria.
The final consistency ratio was calculated by dividing the consistency index with the random index.
CR = CI / RI
Where; RI = Random index and CI = Consistency index.
Consistency ratio was designed such a way that shows a reasonable level of consistency in the pair wise comparisons if CR < 0.10 and CR ≥ 0.10 indicated inconsistent.
Table 3: Scale used in Fuzzy Analytical Hierarchy Process30
|
Intensity of scale |
Linguistic variable |
|
1 |
Equally important |
|
3 |
Weakly important |
|
5 |
Essentially important |
|
7 |
Very strongly important |
|
9 |
Absolutely important |
|
2,4,6,8 |
intermediate values between two adjacent judgments |
Results and Discussion
Results pertaining to estimated weights of selected fire risk factors revealed highest weight for fuel type (0.3109) followed by aspect (0.2487), agricultural workers (0.1341), nutritional density (0.1244), population density (0.0622), slope (0.0524), elevation (0.0311), literacy rate (0.0207) and distance from road (0.0155), respectively (Table 4).
Table 4: Estimated weights of forest fire risk parameters
|
Socio-economic Parameter |
Weight |
Bio-physical Parameter |
Weight |
|
Population density (person km-2) |
0.0622 |
Fuel type |
0.3109 |
|
Literacy rate (%) |
0.0207 |
Aspect |
0.2487 |
|
Agricultural workers (person) |
0.1341 |
Slope (degree) |
0.0524 |
|
Nutritional density (person km-2) |
0.1244 |
Elevation (m) |
0.0311 |
|
Distance from road (m) |
0.0155 |
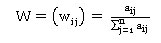
The resulting weights from Fuzzy Analytic Hierarchy Process were applied in the Cumulative Forest Fire Risk Index model. Table 5 demonstrated the fire risk for five classes of CFRISK index value. CFRISK model had been shown in the following equation:-
CFRISK = 0.0622*PDI +0.0207*LRI + 0.1341*AWI + 0.1244*NDI + 0.0155*DRI+ 0.3109*FTI + 0.0524*SI+ 0.2487*AI + 0.0311*EI.
Where;
CFRISK = Cumulative Fire Risk Index
PDI = Population density index
LRI = Literacy rate index
AWI = Agricultural worker index
NDI = Nutritional density index
DRI = Distance from road index
FTI = Fuel type index
SI = Slope index
AI = Aspect index
EI = Elevation Index
Table 5: Cumulative Forest Fire Risk (CFRISK) Index potential scale 24.
|
Index |
Forest Fire Risk |
|
0-1 |
Very low |
|
1-2 |
Low |
|
2-3 |
Moderate |
|
3-4 |
High |
|
4-5 |
Very high |
Out of total geographical area of Solan district, 4.15% area was classified under very high risk, 40.63% area under high risk, 54.00% area under moderate risk, 0.84% area under low risk and 0.37% under very low risk (Fig. 4a).Accuracy of the Forest Fire Risk map was tested using NASA FIRMS forest fire dataset for the year 2018 (Fig. 4b). The Forest Fire Risk map for the three classes alone viz. moderate, high and very high predicted 99.4% of the total fire pixels (1012).The moderate class predictive capability was highest (60.77%), followed by high (33.99%) and very high (4.64%) fire risk class.
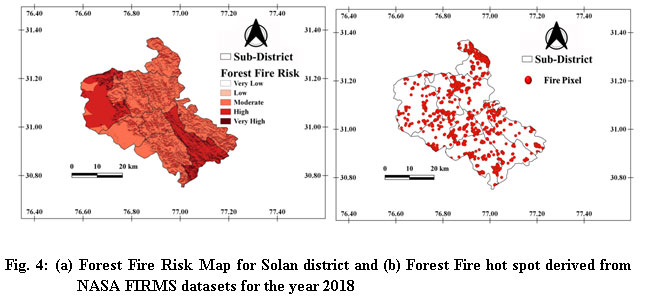 |
Figure 4: (a) Forest Fire Risk Map for Solan district and (b) Forest Fire hot spot derived from NASA FIRMS datasets for the year 2018. |
Abbreviations
|
Mha |
million hectares |
|
% |
Percent |
|
°C |
degree Celsius |
|
CFRISK |
cumulative fire risk index |
|
FAHP |
Fuzzy Analytic Hierarchy Process |
|
FFRZ |
forest fire risk zone |
|
GIS |
geographical information system |
|
km2 |
kilometer square |
|
MCDA |
multi-criteria decision analysis |
|
m |
meter |
|
mm |
Millimeter |
|
PCM |
pairwise comparison matrix |
|
ÊŽmax |
lambda maximum |
|
α |
Alpha |
|
β |
Beta |
|
γ |
Gamma |
|
δ |
Delta |


Acknowledgements
The assistance provided by Dr SK Bhardwaj Prof. &Head, Department of Environmental Science, and Dr IK Thakur, Principal Scientist, Department of Tree Improvement and Genetic Resources, Dr YS Parmar University of Horticulture and Forestry, Nauni, HP-India in the present study is highly acknowledged.
References
- Van der Werf G.R., Randerson J.T., Giglio L., Collatz G. J., Kasibhatla P. S., Arellano Jr. A. F. Interannual variability in global biomass burning emissions from 1997 to 2004. Atmosphere Chemistry Physics. 2006;6(11):3423–3441.
CrossRef - Mouillot F., Field C.B. Fire history and the global carbon budget: A fire history reconstruction for the 20th century. Global Change Biology. 2005;11(3):398-420.
CrossRef - Forest Survey of India. State forest report, Dehradun, Uttarakhand. 2003.
- Anonymous. Forest fires and its effect on environment, forests, bio-diversity and remedial/preventive measures. Directory of Forest Fire Control and Management, Himachal Pradesh. 2016.
- Shah S., Sharma D. P. Land use change detection in Solan Forest Division, Himachal Pradesh, India. Forest Ecosystems. 2015;2:26-38.
CrossRef - Champion H. G., Seth S. K. A Revised Survey of Forest Types of India. Management of Publications, Govt. of India, Delhi. 1968;34.
- Saaty L. T. Multicriteria Decision Making: The Analytic Hierarchy Process, RWS Publications, Pittsburgh, PA. 1988.
- Vaidya O. S., Kumar S. Analytic hierarchy process: An overview of applications. European Journal of Operational Research. 2006;169(1):1-29.
CrossRef - Vahidniaa M. H., Alesheikhb A., Alimohammadic A., Bassirid A. Fuzzy Analytical Hierarchy Process in GIS application.The International Archives of the Photogrammetry, Remote Sensing and Spatial Information Sciences. 2008;37:593-596.
- Aumedes S.C., Comas C., Garcia V.C. Human-caused fire occurrence modelling in perspective: a review. International Journal of Wildland Fire. 2018;26(12):983-998.
CrossRef - Ruffault J., Mouillot F. Contribution of human and biophysical factors to the spatial distribution of forest fire ignitions and large wildfires in a French Mediterranean region. International Journal of Wildland Fire. 2017;26(6):498-508.
CrossRef - Ajin R. S., Loghin A. M., Vinod P. G., Jacob M. K. Forest Fire Risk Zone Mapping Using RS and GIS Techniques: A Study in Achankovil Forest Division, Kerala, India. Journal of Earth, Environment and Health Sciences. 2016;2(3):109.
CrossRef - Baweja P. K., Kundu S. Perceptions of communities exposed to forest fires in western Himalayan region of India. Online International Journal of Biosolution. 2014;2(4):94-99.
- Vilar L., Camia A., Ayanz J. S. M. Modelling socio-economic drivers of forest fires in the Mediterranean Europe. In: Social and Economic issues, Coimbra University Press, Spain. 2014;1874-1882.
CrossRef - Spies T. A., White E. M., Kline J. D., Fischer A. P., Ager A., Bailey J., Bolte J., Koch J., Platt E., Olsen C. S., Jacobs D. Examining fire-prone forest landscapes as coupled human and natural systems. Ecology and Society. 2014;19(3):9.
CrossRef - Ganteaume A., Camia A., Jappiot M., San-Miguel-Ayanz J., Long-Fournel M., Lampin C. A review of the main driving factors of forest fire ignition over Europe. Environmental management. 2013;51(3):651-662.
CrossRef - Lafragueta J. F. GIS and MCE-based forest fire risk assessment and Mapping:A case study in Huesca, Aragon, Spain. M Sc Thesis. School of Engineering and the Built Environment, Spain. 2013.
- Sharma L. K., Kanga S., Singh M. N., Sinha S., Chandra P. P. Fuzzy AHP for forest fire risk modeling. Disaster Prevention and Management: An International Journal. 2012;21(2):160-171.
CrossRef - Gai C., Weng W., Yuan H. GIS-based forest fire risk assessment and mapping. Paper presented at: Computational Sciences and Optimization (CSO), 2011 Fourth International Joint Conference. 2011;1240-1244.
CrossRef - Hoyo L. V., Isabel M. P. M., Vega F. J. M. Logistic regression models for human-caused wildfire risk estimation: analysing the effect of the spatial accuracy in fire occurrence data. European Journal of Forest Research. 2011;130:983-996.
CrossRef - Archibald S., Scholes R. J., Roy D. P., Roberts G., Boschetti L. Southern African fire regimes as revealed by remote sensing. International Journal of Wildland Fire. 2010;19(7):861-878.
CrossRef - Calcerrada R., Barrio-Parra F., Millington J. D. A., Novillo C. J. Spatial modelling of socioeconomic data to understand patterns of human-caused wildfire ignition risk in the SW of Madrid (central Spain). Ecological Modelling. 2010;221(1):34-45.
CrossRef - Vadrevu K. P., Eaturu A., Badrinath K. V. S. Fire Risk Evaluation using multicritiria analysis- A case study. Environmental monitoring and assessment. 2010;166:223-239.
CrossRef - Leone V., Lovreglio R., Martín M.P., Martínez J., Vilar L. Human factors of fire occurrence in the Mediterranean. In: Earth observation of wildland fires in Mediterranean ecosystems. 2009;149-170.
CrossRef - Martinez J., Garcia C. V., Chuvieco E. Human-caused wildfire risk rating for prevention planning in Spain. Journal of environmental management. 2009;90(2):1241-1252.
CrossRef - Maingi J. K., Henry M. C. Factors influencing wildfire occurrence and distribution in eastern Kentucky, USA. International Journal of Wildland Fire. 2007;16(1):23-33.
CrossRef - Yang J., He H.S., Shifley S.R., Gustafson E. J. Spatial patterns of modern period human-caused fire occurrence in the Missouri Ozark Highlands. Forest science. 2007;53(1):1-15.
- Rawat G.S. Fire Risk Assessment for Forest Fire Control Management in Chilla Forest Range of Rajaji National Park, Uttaranchal, India. M Sc Thesis. International Institute for Geo-information Science and Earth Observation Enscheda. 2003.
- Ramanathan A. A note on the use of the analytic hierarchy process for environmental impact assessment. Journal of Environmental Management. 2001;63(1):27–35.
CrossRef


