Seasonal Abundance of Cladocerans and Their Relation to Physico-Chemical Parameters of Pond Ecosystem in Palampur, Dist. Kangra, (H.P.)
Kalyani Supriya1
*
 , Ramesh C. Chauhan2
and Balwinder Singh3
, Ramesh C. Chauhan2
and Balwinder Singh3
1
Dr. Y.S. Paramar University of Horticulture and Forestry,
Nauni,
Solan,
India
2
CSK,
HPKV,
Palampur,
India
3
GADVASU,
Ludhiana,
India
http://dx.doi.org/10.12944/CWE.13.3.17
Copy the following to cite this article:
Supriya K, Chauhan R, Singh B. Seasonal Abundance of Cladocerans and Their Relation to Physico-Chemical Parameters of Pond Ecosystem in Palampur, Dist. Kangra, (H.P.). Curr World Environ 2018;13(3). DOI:http://dx.doi.org/10.12944/CWE.13.3.17
Copy the following to cite this URL:
Supriya K, Chauhan R, Singh B. Seasonal Abundance of Cladocerans and Their Relation to Physico-Chemical Parameters of Pond Ecosystem in Palampur, Dist. Kangra, (H.P.). Curr World Environ 2018;13(3).Available from: https://bit.ly/2SHV6Ik
Download article (pdf) Citation Manager Publish History

A pond is a shallow body of water with a muddy bottom that has rooted plants growing from shore-to-shore. Because the depth is so shallow, water temperatures are fairly uniform from top to bottom but will change as air temperature fluctuates. Increasing urbanisation, industrialisation and excessive use of fertilizers , pesticides in the field windling the quality of water both qualitatively and quantitatively and depleting the aquatic fauna.1 Furthermore, there is a very close associationamong the metabolism of aquatic organisms and hydro biological parameters in a freshwater body.2 The water quality parameters such as temperature, pH, total solids, electrical conductivity, dissolved oxygen, free carbon dioxide, chlorides, nitrates-nitrogen, total phosphate-phosphorus determines the presence, abundance and distribution of organisms in fresh water ecosystem. The variations in water quality parameters due to human activities influence the abundance and composition of biota in an aquatic system.
Among aquatic biota, the planktons play very significant role in the structural functioning of pond ecosystem. They can act as biomarker for water quality estimation for fish production.3 These are mainly of two types, phytoplankton and zooplankton. Zooplankton plays an significant role in demonstrating the quality of water, eutrophication position and freshwater body output.4 The freshwater zooplanktonscomprises of protozoan, rotifers, cladocerans, copepods and ostracods of which cladocerans form a crucial group for bio-monitoring studies. Cladocerans are an important part of trophic cascades of the aquatic systems interlinking primary producers and secondary consumers. These are small crustaceans commonly found in the most fresh-water habitats, including lakes, ponds, and rivers. The cladocerans are an order of the class Branchiopoda which, along with classes Ostracoda and Copepod, comprise the microcrustacea.5 They are commonly known as ‘water fleas’ because of their jerky swimming movements through water facilitated by their large, paired second antennae.6 The composition of these microcrustacean communities is affected by a range of physico-chemical and biotic variables. The most significant of these are pH, temperature, dissolved oxygen, pH and free carbon dioxide levels etc. Thus, the presence abundance and distribution of cladocerans play a very significant role in the food chain and biological productivity of aquatic ecosystem. The dominance of cladocerans is an index of eutrophic conditions in pond ecosystem. Cladocerans are very sensitive to the physico-chemical regime of pond ecosystem. Thus, their seasonal presence, abundance and species diversity or community composition indicates the pollution status of the aquatic ecosystem. The investigation is an attempt to study the seasonal abundance of cladocerans in freshwater pond , Palampur in district Kangra, Himachal Pradesh.
Material and Methods
Study Area
The freshwater pond situated near Experimental Fish Farm of CSKHPKV, Palampur, H.P. was selected to study its seasonal physico-chemical regime and the presence and abundance of cladocerans at the monthly interval over a period of one year from April, 2014 to March, 2015 (Figure 1). The dairy, poultry units wastes of the College of Veterinary and Animal Sciences and agricultural wastes like pesticides, insecticides used in nearby fields of nearby fields enter into the study pond during rainy season as the water of pond was in the beginning used by animals for drinking use, for washing, irrigation purposes and several domestic works.
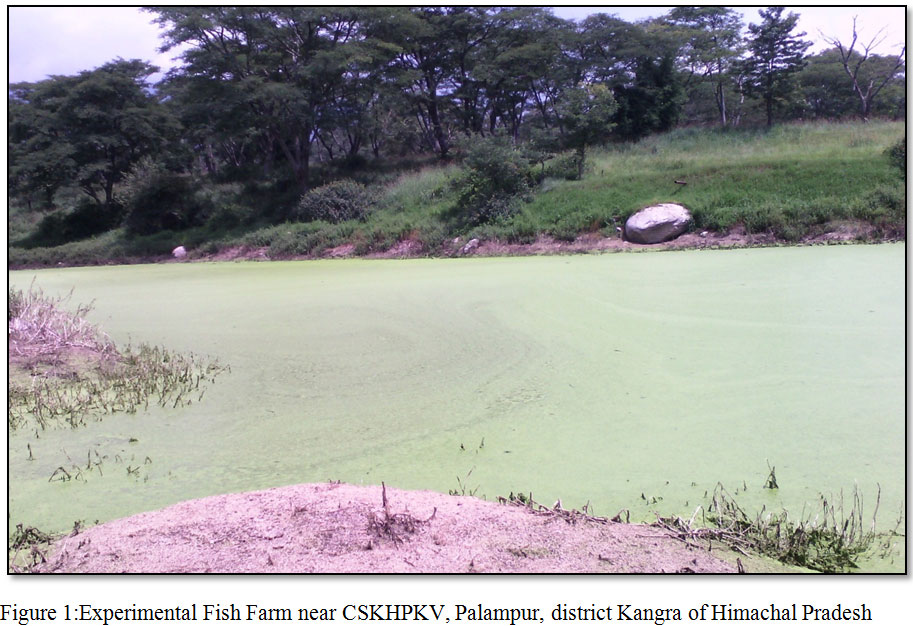 |
Figure 1: Experimental Fish Farm near CSKHPKV, Palampur, district Kangra of Himachal Pradesh. |
Materials and Methods
At the monthly interval over a period of one year from April, 2014 to March, 2015, surface water samples of pond were collected in plastic bottles for the estimation of physico-chemical parameters and transported instantly to the laboratory to avoid unpredictable changes in different physico-chemical parameters. The samples were tested in the laboratory of Department of Biology & Environmental Sciences, College of Basic Sciences, CSKHPKV, Palampur to find out some physico-chemical parameters. And the selected parameters including temperature, Secchi disk transparency, pH, (EC) electrical conductivity, (TS) total solids, (TDS) total dissolved solids, (TSS) total suspended solids, (DO) dissolved oxygen, free carbon dioxide, alkalinities, chlorides, nitrate-nitrogen, total phosphate-phosphorous, sodium and potassium. Physio-chemical analysis of water samples were done following standard methods.7
For qualitative and quantitative enumeration of cladocerans, the samples were collected with help of water sampler of 1 litre capacity at an interval of months over a period of one year from March, 2014 to April 2015. 500 ml. of water samples were filtered through nylo-bolt silk cloth plankton net of small mesh size (150 micron/mm2) for the enumeration. The filterd samples were fixed with 4% neutralized formalin, lugol’s solution and a few drops of glycerine. Samples were allowed to settle over night. After uniform stirring, 1ml. of final volume was counted in zooplanktons counting chamber under planktonic microscope. The number of cladocerans per litre was calculated by following the APHA, 2000 as under:
Cladocerans (org/ l) = C×V1×1000
V2×V3
Results and discussion
Air and Water temperature
In the present investigation maximum air temperature was (36°C) in the month of May, 2014 during summer season and minimum (8°C) during winter season in the month of January, 2015. The air temperature showed highly significant and positive relationship with water temperature (r = 0.972, p< 0.01), chlorides (r = 0.74, p< 0.01), total phosphate-phosphorus (r = 0.72, p< 0.01) and significant and negative relationship with Secchi transparency (r = -0.932, p< 0.01) dissolved oxygen (r = -0.635, p<0.05). The water temperature also showed highly significant and positive relationship with total phosphate-phosphorus (r = 0.71, p< 0.01) like that of air temperature but also showed highly significant and negative relationship with transparency (r = -0.90, p< 0.01), dissolved oxygen (r = -0.59, p<0.05). Similar results observed by Jayabhaye (2006), Salve and Hiware in 2008 during summers due to low water level, water temperature was high In
context of water temperature.8,9
Transparency
Secchi transparency showed highly significant and positive relationship with DO (r = 0.70, p<0.01) and, highly significant and negative relationship with TPP (r = -0.84, p< 0.01). The significant and negative relationship of air and water temperature with transparency may be ascribed to the planktonic population and total suspended particles, as at high temperature there is more formation of planktons which reduces light intensity. Similar finding have been reported by Chauhan while working on the fresh water ecosystem of Rewalsar lake, Himachal Pradesh.10 In 2007,Kadam, et al; also reported similar observations and found higher values of transparency occurred in winter and low in rainy season due runoff, flood water as well as gradual settling of suspended particles to water bodies.11
pH
The pH values varied from 7.0 – 8.2 showing basic nature of the pond water during the study period. In 1979, Boyd reported that pH fluctuates when phytoplankton utilizes carbon dioxide for photosynthesis and rises but it drops when respiration takes place at night.12 The best pH is when it is ranging from 6.5 to 8.0. During summers Jakher and Rawat observed maximum pH and explained this by correlating temperature rise with increase in rate of photosynthesis which results in higher utilization of carbon dioxide in 2003.13 In 2013, Dhanalakshmi et al., found the excessive microbial decomposition that increased CO2 production which in turn decreases the pH of water mainly during monsoon season.14
Conductivity
The electrical conductivity measures the water capacity to carry out an electric current, and usually related to the concentration of ionized substances in water it was recorded minimum (167µmhos/cm) in the month of April, 2014 and maximum (198 µmhos/cm) in May, 2015 (Table 1). The conductivity showed significant and positive correlation (r =0.55, p<0.05) with air temperature and negative relationship with transparency (-0.56, p<0.05) shown in (Table2). There was a fluctuating trend in electrical conductivity due to fluctuation of dissolved solids and salinity. Higher values during the summer season can be credited to the liberation of ions from the decayed organic stuff and also due to more leaching of ions from the bottom sediments. Narayana et al;recorded the maximum conductivity during the summer season in Basavanbole tank at Sagar taluk of Shimoga district.15
Total Solids (TS)
The low levels of total solids indicate the good quality of water. In the present study the total solids valid from 72.2 to 102.1 mg/l. The maximum value of total solids was obtained in the month of August, 2014 and minimum in the month of December, 2014. It showed highly significant and positive relationship with nitrates-nitrogen (r = 0.77, p<0.01), total phosphate-phosphorus (0.81, p<0.01) and with total dissolved solids (r = 0.88, p<0.01). Such type of relationship indicated that total dissolved solids are regulated by the total solids in an aquatic environment.
Total Dissolved Solids (TDS)
The values of TDS ranged from 67.2 to 47.2 mg/l where maximum value was found in July, 2014 and minima found in February, 2015. Same results are also founded by Jena et al;in 2013.16 It showed highly significant and positive correlation (r= 0.87, p<0.01) with total phosphate-phosphorus, nitrates-nitrogen (r = 0.85, p<0.01) and chlorides (r = 0.74, p<0.01). It showed significant and negative correlation (r = -0.58, p<0.05) with total alkalinity and positive relationship with number of cladocerans per litre (r = 0.82, p<0.01). Such an association of total dissolved solids and its higher values indicated deterioration of the water quality in pond ecosystem.
Total Suspended Solids (TSS)
TSS of the water are probably the most criterion of its quality. The values of total suspended solids ranged from 21.6 to 33.8 mg/l where maxima was in March, 2014 and minima in December, 2015 (Table 1). It showed negative correlation (r = -0.52, p<0.05) with potassium shown in Table 2.
Free carbon dioxide
It was varied from 22.7mg/l to 24.7mg/l. Maximum value was recorded in the month of August, 2014 and minimum in the month of April, 2014. Similar results were obtained by Rao and Govind.17 It showed significant and negative relationship (r= -0.53, p<0.05) with dissolved oxygen. It showed significant and positive relationship with nitrate-nitrogen(r = 0.50, p<0.05) and total phosphate-phosphorus (r = 0.50, p<0.05) (Table1). The high concentration of free carbon dioxide in August may be due to the rise in the temperature, which enhances the microbial activities and increases bio-chemical demand. In 1973, Ganapati also reported more carbon dioxide due to rise in temperature.Ganapati S. V. Ecological problems of man-made lakes of South India. Hydrobiologia. 1973;71:363-356.18
Dissolved oxygen (DO)
Dissolved oxygen (DO) values ranged from 2.9 (August,2014) to 4.0 mg/l (January, 2015) (Table 1). The lowest concentration of dissolved oxygen during rainy season and low in summer may be due to the low rate diffusion at increased temperature and higher biochemical oxygen demand at higher rate of decomposition. Similar findings have been reported by Welch in 1952 and Adkins in 1970.19,20 There is a strong correlation between temperature and DO. The warmer water has less oxygen amount so in summer season the concentration level of DO is low because of increased oxygen demands by aquatic biota according to Gandhi in 2012.21 In Deoria Tal, Rawat and Sharma also found high values of dissolved oxygen during winters and low values during summer months.22
Alkalinity
The maximum concentration of alkalinity was observed in December, 2014 during winter season and minimum was found in April, 2014 during summer season. The values of alkalinity varied from 116 mg/l to 127 mg/l. Same results were also in close conformity with the conclusion of Mishra et al., and Arya et al.,23,24
Total phosphate-phosphorus (TPP)
TPP contents were highest during rainy season. In winter season it decreased and again increased in summer season. The minimum values of TPP was recorded during winter season in the month of January, 2015 (1480 µg/l), whereas its maximum values were obtained in the month of July, 2014 (3115µg/l) (Table 1) during rainy season. TPP showed highly significant and positive relationship with water temperature (r = 0.71, p<0.01), air temperature (r = 0.72, p< 0.01), significant and positive relationship with chloride (r= 0.54, p<0.05) and (0.50, p< 0.05) with free carbon dioxide. It showed highly significant and negative correlation (r = -0.84, p< 0.01) with dissolved oxygen and (r= -0.80, p<0.01) with transparency and (Table 2). Maximum values of TPP in rainy season may be ascribed to the inflows from the catchment area consisting of poultry, animal’s husbandry unit and agricultural fields.
Nitrate nitrogen
Nitrate-nitrogen showed significant variation during the course of research. The concentration of nitrate nitrogen varied between 512 µg/l to 995 µg/l (Table 1). Minimum values were recorded during summer season in the month of April, 2014 and maximum in the month of July, 2014 during rainy season. It showed significant and positive relationship with free carbon dioxide (r = 0.51, p< 0.05). Nitrates- nitrogen also showed highly significant and negative correlation with(r = -0.83, p<0.01) dissolved oxygen and with transparency (r = -0.76, p<0.01) respectively. Such an association indicated nutrient enrichment of pond ecosystem. High value of nitrate- nitrogen during rainy season may be ascribed to the inflows of waste from catchment area into the pond ecosystem. Same results have been recorded by Schindler in1974 for the maximum values of nitrate-nitrogen in rainy season.25
Chlorides
The chloride ion had no definite pattern of variations throughout the course of present investigation. The chloride values varied from 28.8 mg/l to 39.0 mg/l shown in Table 1. It was recorded more than 28.8 mg/l throughout the study period.Thus, it can be said the pond ecosystem is at an advanced stage of eutrophication. This can be strengthened by the findings of (Hickel,1973)26
 |
Table 1: Monthly variations in Physico-chemical parameters and abundance of cladocerans in pond ecosystem during April 2014 to |
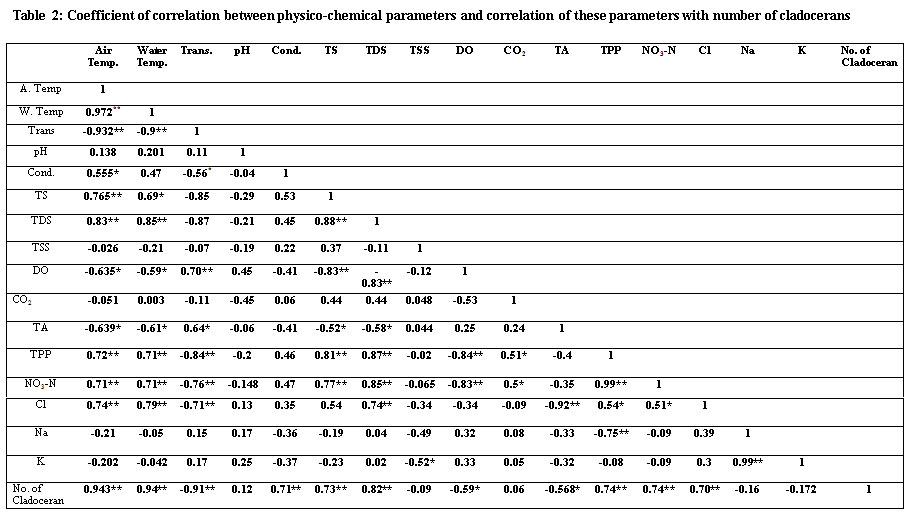 |
Table 2: Coefficient of correlation between physico-chemical parameters and correlation |
**p<0.01; *p<0.05
They reported chloride contents (18.0 mg/l to 28.0 mg/l) as an integral part of eutrophication. In the present investigation the higher chloride content might be attributed to the pollutants of animal source probably entering into the pond ecosystem from poultry and animal husbandry units.
Sodium
Sodium ranged from 9.0 mg/l to 11.7mg/l. The maximum concentration was observed in the month of May, 2014 and minimum in the months of January and February, 2015 (Table 1). The low concentration of sodium can be explained on the basis of pooreractivities of microbes whereas the higher concentration of sodium might be due to high rate of mineralization in the sediments, and risingthe sodium amount into the nutrient pool thus making additional sodium to solubilise. However, the concentration of sodium was recorded always higher than that of potassium during the study period. It showed highly significant and positive relationship (r = 0.99, p<0.01) with potassium showing that it also determines the water quality (Table 2).
Potassium
Sodium and potassium are closely related to each other. The occurrence of potassium is less widespread in nature and in an aquatic environment. It is found always in lower concentration than sodium due to more chloride values. The potassium concentration varied from 6.1 mg/l to 8.4 mg/l where maxima was found in the month of April, 2014 and minima in the month of February, 2015. It showed highly significant and positive relationship (r = 0.99, p<0.01) with sodium (Table 2).
Seasonal variations in cladoceran species and their abundance in relation to physico-chemical regime
During the course of present investigation the cladocerans fauna was found to be composed of 7 species viz; Moinamucronata, Bosminalongirostris, Daphnia pulex, Daphnia magna, Sida crystalline, Simocephallusexpinosus, andDiaphanosomabrachyurum(Table 3). During summer season in the month of April and May, 2014 seven species in total were recorded. Among these species Daphnia pulex (26%) dominated and Moinamucronata (18%) co-dominated the population. Sidacrystallina (7%) and Diaphanosomabrachyurum (9%) (Figure 3) were recorded as species with the lowest population. However in rainy season 6 species were recorded and Daphnia pulex (23%) co-dominated along with Moinamucronata (21%) whereas Sidacrystallina (1%) and Diaphanosomabrachyurum (9%) (Figure 4) were least abundant during the month of July and August, 2014. In winter season 7 species were present. The Daphnia pulex (24%) dominated the cladocerans population and Moinamucronata(17%), Daphnia magna (15%) co-dominated the population whereas Sida crystalline (2%) and Diaphanosomabrachyurum(11%) (Figure 5)were lowest in abundance. The population dominance of Daphnia pulex, Moinamucronata, and Daphnia magnaand reduction in number of species and an enhancement in their population can be treated as an effect due to physico-chemical regime of the pond ecosystem. The ecology of cladocerans in the present investigation revealed that among the 7 species Daphnia pulex dominated the population followed by Daphnia magna and Moinamucronata. Such a pattern of dominance and co-dominance of these species indicated deterioration or nutrient enrichment of water quality in an aquatic ecosystem.These species were highly significant and positively correlated with total phosphate-phosphorus (r = 0.74, p<0.01), air temperature (r = 0.943, p<0.01), water temperature (r = 0.94, p<0.01), and significantly and positively correlated with nitrate- nitrogen (r = 0.74, p<0.01) (Table 2). Further these species were found highly significant and negatively correlated with transparency (r = -0.91, p<0.01), dissolved oxygen (r = -0.59, p<0.05) and positively correlated (r = 0.70, p<0.01) with chlorides. Similar findings have also been reported by (Chauhan, 1998) while working on Rewalsar and Renuka lakes of Himachal Pradesh. The negative relationship was obtained in between cladocerans species and transparency and dissolved oxygen. The negative relationship in the present investigation may be ascribed to the less species biodiversity of cladocerans and presence and abundance of pollution indicator species like Daphnia pulex, Daphnia magna, and Moinamucronata. Thus, physico-chemical regime of aquatic environment greatly influences the species biodiversity, abundance, and distribution.
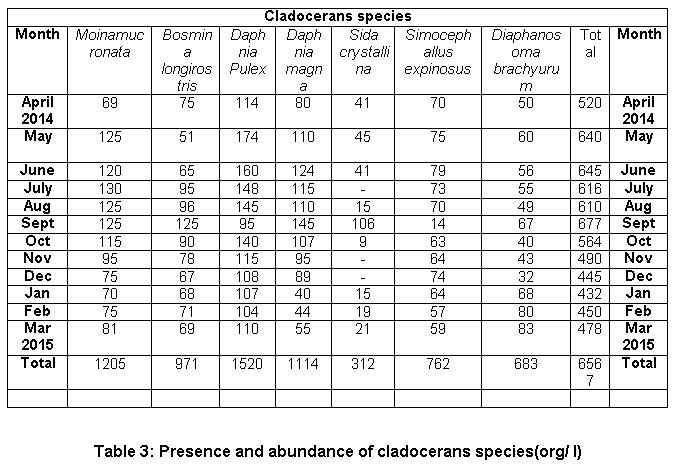 |
Table 3: Presence and abundance of cladocerans species(org/ l) Cladocerans species Click here to view table |
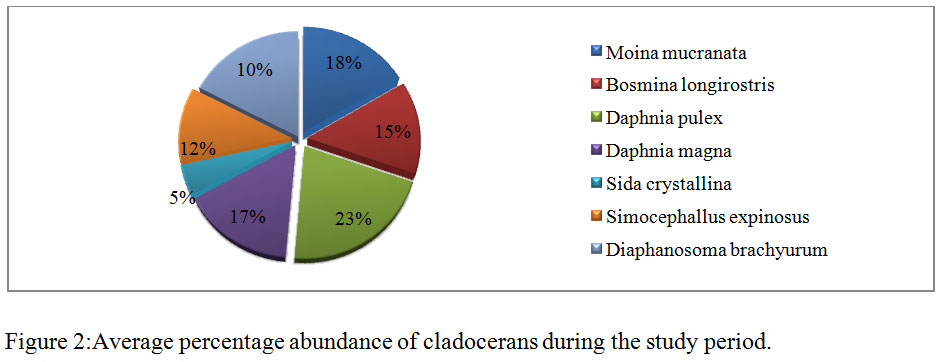 |
Figure 2: Average percentage abundance of cladocerans during the study period |
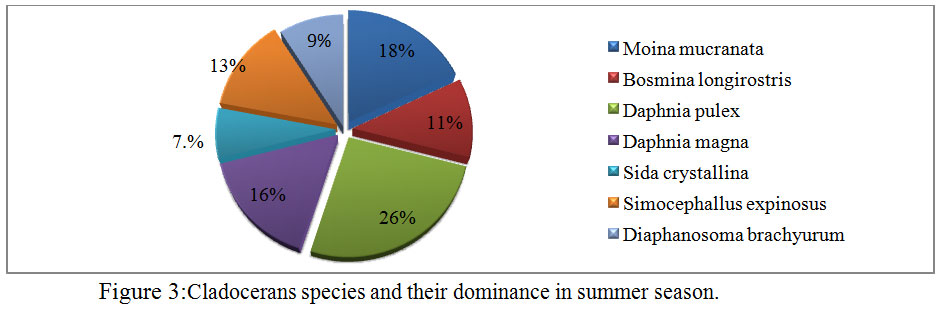 |
Figure 3: Cladocerans species and |
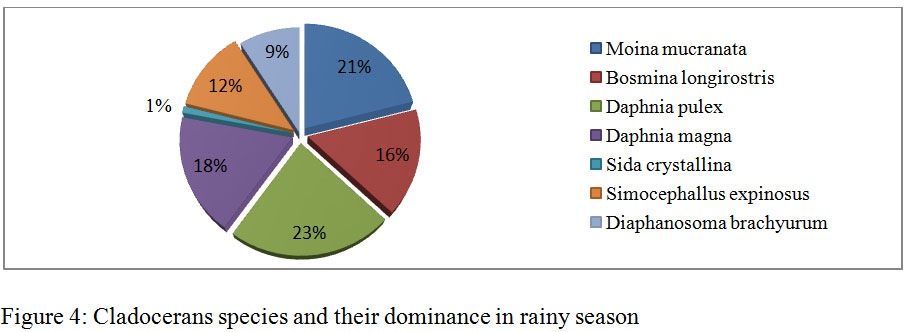 |
Figure 4: Cladocerans species and their dominance in rainy season |
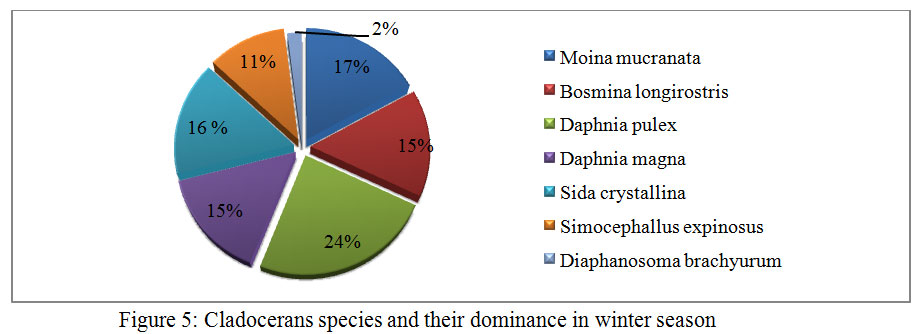 |
Figure 5: Cladocerans species and |
Conclusion
Higher concentrations of physico-chemical parameters like free CO2, chlorides, nitrate-nitrogen, phosphate-phosphorus and low values of Secchi transparency, dissolved oxygen and the dominance of Daphnia pulexpresence and abundance of Moinamucronata and Daphnia magna during the investigation indicated the highly deteriorated water quality of pond ecosystem. Different anthropogenic activities like inflows of waste water to pond from the poultry and animal husbandry units, entry of agricultural run offs like pesticides from nearby agricultural fields seems to be the major cause of eutrophication. From the above study we concluded that a strict attention and general alertness is necessary so that proper conservation of this aquatic body can be done, which support a rich biodiversity of flora and fauna.
Acknowledgements
Kalyani Supriya thankful to the Head, Department of Environmental Sciences and Biology, College of Basic Sciences, CSKHPKV Palampur (H. P.) for providing the necessary laboratory facilities for the research work. I am also thankful to Dr. Nageswer Singh for their help in work of laboratory, and to complete the present study
References
- Sati S. C., Paliwal P. C. Physicochemical and bacteriological analysis of Kosi river in Central Himalaya. Pollution Research. 2008;27(1):79- 183.
- Deshmukh J. U., Ambore N. E. Seasonal variations in physical aspects of pollution in Godavari river at Nanded, Maharashtra. Indian Journal of Aquatic Bioogy. 2006;21(2):93-96.
- Pradhan A., Bhaumik P., Das S., Mishra M., Khanam S., Hoque B. A. Phytoplankton Diversity as Indicator of Water Quality for Fish Cultivation. American Journal of Environmental Sciences. 2008;4(4):406-411.
CrossRef - Mikschi E. Rotifer distribution in relation to temperature and oxygen content. Hydrobiologia. 1989;186:209-214.
CrossRef - Fitter R., Manuel R. A. Collins fields guide to the freshwater life of Britain and North-West Europe.WilliamCollins:London, UK. 1986
- Bronmark C., L Anders Hansen., The Biology of Lakes and Ponds. Oxford UniversityPress, UK. 1998;178-182.
- APHA. Standard method of examination of water and waste water. 21st Edition, American Public Health Association, New York, USA. 2000
- Jayabhaye U. M., Pentewar M S and Hiware C J. A Study on Physico-Chemical Parameters of a Minor Reservoir, Sawana, Hingoli District, Maharashtra.2006
- Salve V. B., Hiware C. J., Study on water quality of Wanparakalpa reservoir Nagpur, Near ParliVaijnath, District Beed. Marathwada region. Journal of Aquaculture Biology. 2008;21(2):113-117.
- Chauhan R. Seasonal Abundance of zooplanktons in Rewalsar lake, Himachal Pradesh. Geo-bios News Reports.1998;7:117-121.
- Kadam M. S., Pampatwar D. V., Mali R. P. Seasonal variations in different physico-chemical characteristics in Masoli reservoir of Parbhani district, Maharashtra.Journal of Aquaculture Biology. 2007;22(1):110-112.
- Boyd C. E. Water quality in warm water fish pond Auburn Univ.,Agric. Experimental Station. Craftmaster Printers, Inc. Opelika, Alabama. 1979;359.
- Jakher G. R., Rawat M. Studies on physico-chemical parameters of a tropical lake, Jodhpur, Rajasthan, India. Journal of Aquatic Biology. 2003;18(2):79-83.
- Dhanalakshmi V., Shanthi K., Remia K. M. Physicochemical study of eutrophic pond in Pollachi town, Tamilnadu, India. Int. J Curr. Microbiol. Applied Science. 2013; 2(12):219-227.
- Narayana J., Purushothama R., Kiran B. R., Ravindrakumar K. P., Puttah E. T. Investigation of drinking water quality of Basavanahole Tank with reference to physical chemical characteristics. Fundamental of limnology. 2005;201-206.
- Jena V., Dixit S., Shrivastava R., Gupta S. Study of Pond water quality by the assessment of physico-chemical parameters and water quality index. International Journal of Applied Biology and Pharmaceutical Technology. 2013;4(1):47-52.
- Rao S. D., Govind B. V. Hydrology of Tungabhadra reservoir. Indian Journal of Fishery. 1964;321.
- Ganapati S. V. Ecological problems of man-made lakes of South India. Hydrobiologia. 1973;71:363-356.
- Welch P. S. Limnology, 2nd Edition Mc Grow Hill Cooperation, New York. 1952;588.
- Adkins P. F. Biological waste water treatment Process In “Water Pollution Ecology” Engineering Centre United State Department of Health, Education and Welefare. Occasional Paper No.2. 1970.
- Gandhi T K.. Study of water quality parameters to better manage our ponds or lakes.International. Journal of Latest Research in Science and Technology. 2012;1(4): 359-363.
- Rawat M. S., Sharma R. C. Phytoplankton population of Garhwal Himalayam Lake Deoria Tal, Uttranchal. Journal of Ecophysiology and Occupational Health. 2005;5:73-76.
- Mishra M. K., Mishra N.,. Pandey D. N. An assessment of physico-chemical characteristics of Bhamka pond, Hanumana, Rewa District, India. International Journal of Innovative Research in Science, Engineering and Technology. 2013;2(5):1781-1788
- Arya S, Kumar V, Raikwar M, Dhaka A and Minakshi. Physico-chemical Analysis of Selected Surface Water Samples of Laxmi Tal (Pond) in Jhansi City, UP, Bundelkhand Region, Central India. Journal of Experimental Sciences. 2011;2(8):1-6.
- Schindler D. N. Eutrophication and recovery in experimental lakes Implication for the management. Science. 1974;184:897-899.
CrossRef - Hickel B. Phytoplanktons in two ponds at Kathmandu Valley (Nepal) International Review of Gasamtan. Hydrobiologia. 1973;58:835-842.


