Suitability Assessment of Sirsa River Water for Irrigation in Shiwalik Foothills of North Western Himalaya
S.K. Bhardwaj1
, R. Sharma1
and R.K. Aggarwal1
*

http://dx.doi.org/10.12944/CWE.14.1.15
Copy the following to cite this article:
Bhardwaj S. K, Sharma R, Aggarwal R. K. Suitability Assessment of Sirsa River Water for Irrigation in Shiwalik Foothills of North Western Himalaya. Curr World Environ 2019;14(1). DOI:http://dx.doi.org/10.12944/CWE.14.1.15
Copy the following to cite this URL:
Bhardwaj S. K, Sharma R, Aggarwal R. K. Suitability Assessment of Sirsa River Water for Irrigation in Shiwalik Foothills of North Western Himalaya. Curr World Environ 2019;14(1). Available from: https://bit.ly/2XPJF3r
Download article (pdf) Citation Manager Publish History

Introduction
Rivers are a much-valued feature of the natural ecosystem as these perform numerous vital functions. However, owing to its indiscriminate utilization due to the population explosion and various developmental activities, this vital resource is now under tremendous pressure. Additionally, a meeting of diverse water necessities for irrigation, human and industrial consumption has become a challenge. Further, the rapidly expanding industrialization and urbanization have also exhausted the accessible water resources and the water quality has also degraded.1,2 The factors like basin lithology, atmospheric and climatic conditions and anthropogenic activities have also been reported to influence water quality.3,4 Generally, industrial wastewaters both non-treated or ill-treated often get mixed with household sewage enter into the surface water bodies where they get dissolved or lie suspended in water deteriorating its quality and causing pollution.5,6,7
Irrigation is one of the most vital uses of river water for agrarian resolves and its suitability is determined by estimating the concentration and constitution of dissolved components. In developing countries, wastewater is usually used for irrigation as an alternative to the limited freshwater resources because of its accessibility and availability of nutrients.8,9 However, such water may contain many contaminants and can obstruct the basic purpose of irrigation. These contaminants may be further taken up by the crops and other biotic forms which can eventually harm human health and the environment creating a greater threat to bio-cycle.10 Therefore, it has now become essential to evaluate the water quality before applying it for irrigation.
Nalagarh valley representing the southernmost expanse of Solan district in Himachal Pradesh (HP); comprisesBaddi, Barotiwala and Nalagarh (BBN) region has witnessed reckless industrial development in the recent past.11 Sirsa river is the main river that originates near Kalka, enters HP in district Solan flowing through sub - Shivalik hills before, it unites with river Sutlej at Chak Dehra near Ghanauli. Currently, It is facing tremendous pressure due to the random development of numerous large and small scale industries besides profuse urban areas all over its catchment area.12,13Additionally, there are several streams namely Chikninadi, Phulanadi, Rattanadi, Baladnadi and Surajpurchao; heavily loaded industrial and domestic effluents which join Sirsa river further contributing towards the water quality deterioration.14,15 The composition of the discharge in all the streams joining Sirsa river has been noticed to vary seasonally and has reported containing a heavy load of effluents during the rainy season.16 The water of the river is primarily used for irrigation by the local inhabitants; along with other domestic and industrial applications. Therefore, the present investigation was conducted to assess the suitability of Sirsa river water for irrigation purposes.
Material and Methods
Baddi, Barotiwala, Nalagarh (BBN) area is a rapidly growing industrial township which has developed as a major industrial hub in Solan district of HP. It lies within 30º 57′N; 76º22′E and the geological structure of the region embraces Shiwalik formations. The soils of this hilly terrain are majorly neutral whereas its texture varies from sandy loam to clay loam. Except for the areas having vegetation cover, soil depth is usually shallow. The major part of the Sirsa river basin is covered by alluvium soil varying from 10-20 cm in thickness and is mostly granular with Holocene and Pre-Holocene deposits. In the upper and middle parts of the river basin; alternate beds of clay, pebbles, gravel are dominating whereas in the downstream part of basin sediments get finer to become clay.16 The area which is irrigated with the river water is majorly used for the cultivation of vegetable crops (pea, tomato, brinjal, capsicum, beans, cabbage, cauliflower, bhindi), sub-tropical fruits, cereals (maize, rice, wheat, barley), pulses and oilseed crops.17
Sirsa river is one of the major perennial tributaries of Sutlej and it flows south-westerly in the area to join Sutlej 10 km before the commencement of Ropar (Fig. 1a, b and c). Since Sirsa river is flowing through various urban and industrial areas and its water is used for irrigation in the region, therefore, in order to evaluate the water quality for irrigation purposes; detailed survey of the river catchment area was conducted and the entire river stretch of 29 km flowing along the BBN region was divided into six parts (Fig. 1c). The entry point of the river into the industrial hub was considered as control. At each stretch, six water samples were taken from the centre of the river which was considered as replications. Accordingly, seven sampling sites were considered as treatments which were replicated six times. In total, 42 water samples were collected across the flow of the Sirsa river in January 2018 and were further subjected to physicochemical analysis using standard methods. All the analytical chemicals, reagents and glassware used in this study were purchased from CHD Pvt. Ltd. (New Delhi), Merck Life Sciences Pvt. Ltd., Fisher Scientific, Hi-Media laboratories Pvt Ltd.and Borosil laboratories Pvt. Ltd. (Mumbai).
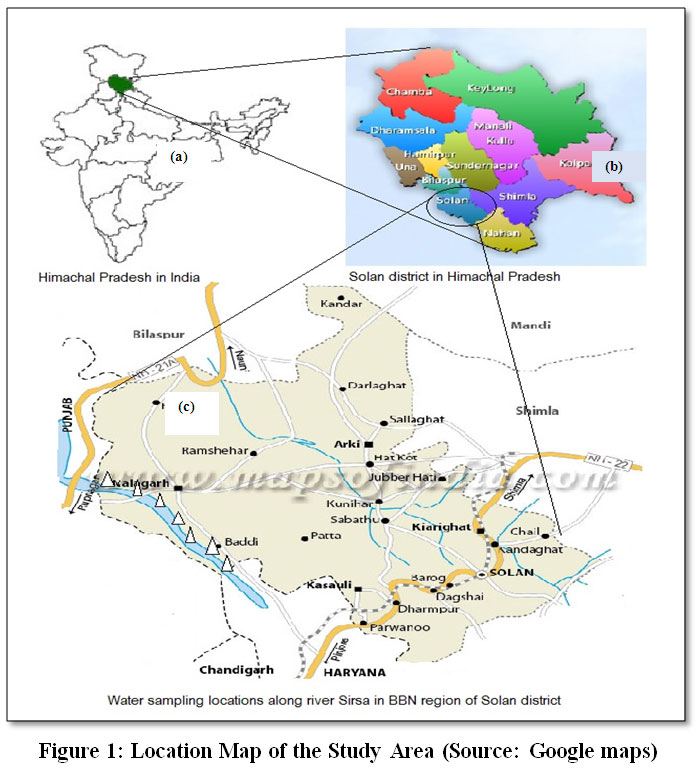 |
Figure 1: Location Map of the Study Area (Source: Google maps) Click here to view Figure |
Water Sampling and Laboratory Analysis
Bulk samples were collected in pre-washed plastic bottles at depths ranging from 15-30 cm in the water body. At the time of sampling, bottles were carefully rinsed two to three times with water to be sampled. The samples were stored in an ice box, transported to the laboratory and analysed for parameters within 24 h using standard methods (APHA, 2012). Water pH and Electrical Conductivity were estimated using pH meter (ESICO Model-1013) and EC meter (ESICO Model-160), respectively. Water samples were passed through Whatman No. 42 filter paper and further used for the estimation of ions namely Na+, K+, Mg2+, Ca2+, CO32-, HCO3-, Cl-. The elements like Na+ and K+were estimated using Flame Photometer (ESICO Model-1382).To estimate Ca2+ in water, an alcoholic-alkaline solution was made to react with calcium ions which further modifiedglyoxal-bis(2-hydroxy anil) to form a red-violet complex. In case of determination of Cl- ions, these were made to react with mercury(II) thiocyanate to form slightly dissociated mercury(II) chloride and the thiocyanate released in the process, in turn, reacted with iron(III) thiocyanate. For estimation of Mg2+ ions, these ions were made to react with phthalein purple in neutral solution to form a violet dye. All the coloured complex formations were determined photometrically by using Spectroquant® Pharo 300(Merc make). CO32- and HCO3- were estimated by titration method using standard H2SO4 with phenolphthalein and methyl orange as an indicator.18, 19
On the basis of estimated concentrations of the abovementioned ions, irrigation suitability of Sirsa river water was determined by evaluating critical parameters such as Residual Sodium carbonate (RSC), Sodium Adsorption Ratio (SAR), Soluble Sodium Percentage (SSP), Permeability Index (PI), Kelley’s Ratio (KR), Magnesium Hazard (Mg Haz.) and Chloro-alkaline index (CAI) using the standard formulae given in Table 1.In order to determine the utility of river water for irrigation based on various parameters was ascertained according to the classifications suggested by several authors as given in Table 3. Ionic concentrations were expressed as mg/l and further conversion into milli equivalent/l (meq/l) was followed afterwards. The quality of the data obtained in the study was verified through careful standardization, blank measurements in the respective procedure and samples in triplicates. The data obtained from the analysis of water samples were subjected to statistical analysis using one-way SPSS 11.0 software. Microsoft Excel 2010 was used for calculations and data analysis.
Table1: Standard formulae to calculate the water quality parameters
|
Sr. No. |
Parameter |
Calculation |
Reference |
|
1 |
RSC |
(HCO3- + CO32- ) – (Ca2+ + Mg2+) |
[19] |
|
2 |
SSP |
[Na++ K+/(Ca2+ + Mg2+ + Na++ K+)] *100 |
[20] |
|
3 |
SAR |
Na+/(Ca2+ + Mg2+/2)1/2 |
[21] |
|
4 |
PI |
[Na+ +(HCO3-)1/2/ (Ca2+ + Mg2+ + Na+)] *100 |
[22] |
|
5 |
KR |
Na+ / (Ca2+ + Mg2+) |
[23] |
|
6 |
Mg. Haz. |
(Mg2+ *100)/( Ca2+ + Mg2+) |
[24] |
|
7 |
CAI-I |
[Cl- - (Na+ + K+)]/Cl- |
[25] |
Results and Discussion
pH
The Sirsa river water pH values were found to be in the range of 6.64-7.55 with a mean ± SD of 7.15±0.05 (Table 2)indicating that the water was in the normal range. The water pHwaswithin the prescribed standard limits of 6.5-8.5.26 However, significant variations were noticed in river water pH values which followed an increasing trend as the river flows down from control site towards the last point along-side the industrial activities (Table 2).The addition of industrial and domestic effluents resulting in increased photosynthetic algal activities that consume all the dissolved carbon dioxide leading to decrease in the concentration of free CO2 thereby decreasing the acid formation which might have ultimately increased the water pH.27, 28 The results are in line with Rana et al., (2016)29 who have also described river water pHvaryingfrom 6.01-7.53 in Solan district in HP while studying the various land uses in the region. A similar range of the pH values for river water has also been recorded by various authors affirming it safe for use in agriculture.30, 7
Table 2: Status of Sirsa river water quality parameters assigned for irrigation usage
|
Treatments |
pH |
EC (µS/cm) |
RSC (meq/l) |
SSP (%) |
SAR (meq/l) |
KR (%) |
Mg Haz. (%) |
|
T1 |
6.64 |
129.5 |
-2.61 |
13.49 |
0.41 |
3.26 |
14.97 |
|
T2 |
6.78 |
179.83 |
-3.21 |
13.53 |
0.46 |
3.17 |
25.59 |
|
T3 |
6.8 |
283.83 |
-3.52 |
15.14 |
0.48 |
2.94 |
25.98 |
|
T4 |
7.33 |
420.5 |
-5.27 |
32.73 |
2.01 |
10.35 |
37.83 |
|
T5 |
7.33 |
508.67 |
-3.65 |
43.24 |
3.08 |
16.4 |
26.03 |
|
T6 |
7.51 |
612.5 |
-4.13 |
45.49 |
3.61 |
18.14 |
30.19 |
|
T7 |
7.55 |
719.67 |
-2.18 |
49.44 |
4 |
21.24 |
17.65 |
|
Range |
6.64-7.55 |
129.50-719.67 |
(-)5.27-(-)2.18 |
13.49-49.44 |
0.41-4.00 |
2.94-21.24 |
14.97-37.83 |
|
CD |
0.11 |
3 |
0.15 |
0.62 |
0.04 |
0.22 |
0.21 |
|
Mean ± SD |
7.15 ± 0.05 |
407.79 ± 1.03 |
-3.51 ± 0.05 |
30.44 ± 0.05 |
2.01 ± 0.02 |
10.79 ± 0.08 |
25.46 ± 0.07 |
|
Min |
6.75 |
132.5 |
-8.79 |
14.12 |
0.45 |
3.48 |
15.17 |
|
Max |
7.44 |
716.67 |
1.33 |
50.07 |
3.97 |
21.02 |
37.63 |
Electrical Conductivity (EC)
Electrical conductivity evaluates the electric current carrying capacity of water based on the concentration of dissolved ions and has been assigned as an important criterion for assessing the appropriateness of water for its use in irrigation. The river water EC values ranged between 129-720 µS/cm (Table 2) which were well below the standards permissible limits of 1500µS/cm prescribed by BIS.All the river water samples were found to be under safe and moderately safe class, thus may be considered fit for irrigation purposes (Table 3). Although significant variations were observed in water EC values which followed an accumulative trend towards the last point of the river along-side the industrial activities signifying the greater impacts of direct disposal of untreated industrial and domestic effluents in the river.The increase in the EC values towards the lower section of the river along-side the industrial hub can be ascertained to the addition of the inorganic dissolved solids such as calcium, chloride, aluminium, nitrate, sulphate, iron, magnesium, and sodium ions and organic compounds such as oils, alcohols, phenols, and sugars from the domestic and industrial wastes into the river.31 According to the classification of water based on EC for irrigation purposes given by CGWB and CPCB (2000),32 river water samples were under saline to moderate saline class (Table 3). Generally, water with an EC value below 750 µS/cm is regarded as suitable for irrigation.33 High EC reduces the plants osmotic activityand thus hinderswater and nutrients absorption from the soil. Hence, irrigation water with high EC values can affect crop yield potential as the amount of water present in the soil for its use by the plant decreases dramatically with increased EC.34 Herojeet et al.,(2016)15 have also reported EC values in the range of 250-2000 µS/cm for Sirsa river water samples classifying them under good and permissible class reflecting their use as safe for irrigation purposes.Sharma et al.,(2014)3 have stated EC values in the range of 283-760 µS/cm for river water samples in limestone mining areas of district Solan in HP and all samples were reported to be well within permissible limits therefore suitable for irrigational purposes. Haritash et al.,(2016)5 have described EC values ranging from 38-170 µS/cmin thewater samples gathered from river Gangalocated at Rishikesh in Uttarakhand asserting its secure use in irrigation for agriculture. A similar range of EC values for the surface water 455.00-618.50µS/cmhave also reported in the Solan district of HP as an impact of various land uses in the region.29
Table 3: Water Classification for Irrigation Suitability Based on Several Parameters
|
Class |
Range |
Suitability for irrigation |
|
A.EC (µS/cm) (Source: CGWB and CPCB, 2000)32 |
||
|
1 |
Below 250 |
Safe |
|
2 |
250-750 (moderately saline) |
Moderately Safe |
|
3 |
750-2250 (medium to highly saline) |
Permissible |
|
4 |
2250-4000 (high salinity) |
Safe with permeable soils and moderate leaching |
|
5 |
4000-6000 (very high salinity) |
Doubtful |
|
6 |
Above 6000 (excessive salinity) |
Unsuitable |
|
B.RSC (Source: Eaton, 1950; USDA, 2008)19, 35 |
||
|
1 |
<1.25 |
Safe |
|
2 |
1.25-2.5 |
Moderate |
|
3 |
>2.5 |
Unsuitable |
|
C.SSP (Source: Wilcox, 1955)36 |
||
|
1 |
<20 |
Excellent |
|
2 |
20-40 |
Good |
|
3 |
40-60 |
Permissible |
|
4 |
60-80 |
Doubtful |
|
5 |
80-100 |
Unsuitable |
|
D.SAR (Source: USSL, 1954)37 |
||
|
1 |
<10 |
Excellent |
|
2 |
Oct-18 |
Good |
|
3 |
18-26 |
Doubtful |
|
4 |
>26 |
Unsuitable |
|
E.PI (Source: Doneen, 1962)22 |
||
|
1 |
>75% |
Very Good |
|
2 |
25-75% |
Good |
|
3 |
<25% |
Unsuitable |
|
F.KR (Kelly, 1963)23 |
||
|
1 |
<1 |
Very Good |
|
2 |
01-Feb |
Marginal |
|
3 |
>2 |
Poor |
Residual Sodium Carbonate (RSC)
Residual Sodium Carbonate is an index to assess the quality of irrigation by comparing the concentrations of Ca2+ and Mg2+ to HCO3- and CO32-. It also determines the precipitation of Ca2+ and Mg2+as carbonates in the soil leading toa relative upsurge in Na+. Consequently, fixation of Na+in the soil causes the dissolution of organic matter to leave a black spot on the surface post-drying.15The RSC values of Sirsa river water ranged between (-)5.27-(-)2.18 meq/l exhibiting significant variations as the river passes through the industrial region, however; no specific trend was observed (Table 2). Sirsa river water was found to have RSC values below1.25 meq/l(Table 3) and according to the recognized guidelines for water quality classification19,35 it was under safe category for its use in irrigation (Table 3). The negative RSC values observed in the river water can be ascribed to the addition of the various inorganic dissolved solids such as calcium, chloride, aluminium, nitrate, sulphate, iron, magnesium, and sodium ions etc. from the domestic and industrial wastes into the water body. Many authors have also reported negative RSC values for surface water to consider it safe use in agriculture through irrigation.5, 15, 38, 39
Soluble Sodium percentage (SSP)
The permeability of agricultural soils irrigated with water containing excessive amounts of Na+ ions may reduce drastically and eventually causing deficient inner drainage in the soil. Thus, the water being used for irrigational purposes should have a lower Na+ concentration. The SSP values of Sirsa river water varied between 13.49-49.44% with a mean ± SD of 30.44±0.05 (Table 2) which was in lower range with a less pronounced effect on water quality for irrigation. The lower SSP values in the study can be credited to the heavy load of various inorganic dissolved solids coming from the domestic and industrial wastes into the water body. According to the standard classification, all the samples were found to be under the excellent category for irrigation (Table 3). Haritash et al., (2016)5 have observed SSP values in the range of 9.71–25.54% for Ganga river water in Rishikesh, Uttarakhand depicting it suitable for irrigation. Herojeet et al. (2016)15 have estimated SSP values in the range of 5.36- 68.33% for Sirsa river water in Solan district of HP whereas Sharma et al. (2016)3 have noted SSP values between3.33-8.88% for surface water samples in limestone mining areas of district Solan showing its suitability for irrigation commitments.
Sodium Adsorption Ratio (SAR)
Sodium adsorption ratio is a commonly used a criterion for estimating the sodium hazard associated with an irrigation water supply.39 Water infiltration lessens due to high sodium relative to the calcium and magnesium contents and this condition is referred to as “sodicity”. Sodicity furthercauses swelling and dissemination of soil clays, surface crusting and pore chokingalong-with a decrease in the downward movement of water through the soil. Consequently, in spite of pooling of water on the soil surface after irrigation, actively growing plants roots do not get sufficient water.34 Higher values can affect the soil overall permeability by causing damages to its structure resulting in compact and impervious nature.20, 40, 41, 15 SAR quantifiessodicity in terms of the relative concentration of Na+to the sum of Ca2+ and Mg2+ ions in water. The SAR values of Sirsa river water ranged between 0.41-4.01 meq/l (Table 2).
The U.S. Salinity Laboratory, (1954)37 has givenwater classification on the basis of SAR values in relation to irrigation and all the samples were found to be excellent for the same target(Table 3). However, uninterrupted use of water having low SAR levels from 1 to10 inirrigationmay cause sodium hazard to sensitive crops.42 Herojeet et al., (2016)15 reported SAR values in the range of 0.27-4.02 meq/l for Sirsa river water samples which have been classified as excellent for irrigation purposes. Haritash et al., (2016)5 estimated SAR values between 0.24-0.43 meq/l in the water samples collected from Ganga river in flowing through Rishikesh in Uttarakhand stating its safe use in irrigation for agriculture. The sheriff and Hussain (2017)39 have reported water samples collected from Noyyal River at Tiruppur, Tamilnadu, India under excellent category based on SAR classification, which can be used for irrigation purposes.
Kelley’s Ratio (KR)
Kelly’s ratio is an important parameter used in the assessment of water quality for irrigation based on the Na+, Ca2+ and Mg2+ion concentrations in the water. As per standard classification, water with a KR value higher than unity is considered non-suitable for irrigation.23 During the present investigation, KR ranged from 2.94-21.24 with mean ± SD value of 10.79±0.08 (Table 2). All samples fell under Class III as shown in Table 3 which indicated the unsuitability of water for irrigation. Such higher values of KR can be ascribed to the presence of excessive Na+ ions in the river water due to the addition of wastewaters from several industries. This may be credited to the direct disposal of domestic and industrial wastewaters into the river leading to increased concentrations of the different ions in the water. Higher KR values for the surface water have also been reported in the literature suggesting the unsafe nature of water for irrigation.38, 5, 25
Magnesium Hazard (Mg Haz.)
It is well-established fact that the higher levels of Mg2+ in water support an advanced production of transferrable Na+ in irrigated soils which not only deteriorates soil structure but also has an adverse effect on the crop yield-affecting overall production.24, 43 Water with Mg Haz.less than 50% is appraised it for irrigation.44The Mg Haz. values of Sirsa river water ranged from 14.97-37.83% with mean ± SD value of 25.46±0.07 (Table 2) and thus, river water was considered safe for its use in agriculture through irrigation. Several authors have described Mg Haz. values well below standard accepted limits of 50% suggesting safe use of water in irrigation.5, 25, 45 In a recent study, all shallow tube well and pond water samples exceeded Mg Haz. value of 50% whereas river water samples (71.42%) had shown lower MAR values within 50%.38
Permeability Index (PI)
The capability of the soil to transmit water and air is one of the most important qualities to consider water outflow depending on its texture and structure and is described as“soil permeability”.Permeability index (PI) has been developed as a standard for examining the aptness of water for irrigation. According to the standard classification, water belonging to class I and II with 75% or more of permeability is rendered good for irrigation whereas Class III water with 25% of maximum permeability is contemplated as unfit as presented in Table 3. The PI values of Sirsa river water ranged between 28.20-57.89% with mean ± SD value of 42.47± 0.28 (Table 4). The river water belonged to Class II as shown in Table 3, which indicated its suitability for irrigation. Herojeet et al. (2016)15 have also reported PI values in the range of 22.15-77.15% for Sirsa river water sample under Class I and II and were found to be suitable for irrigation purposes. Haritash et al., (2016)5describedPI values between 25-75% for the Ganga river collected from Rishikesh in Uttarakhand stating its safe use in irrigation for agriculture. Salifu et al., (2017)25 stated that 96.65 and 4.35% of groundwater samples collected from the Upper West region of Ghana were under Class I and II, respectively based on PI values which made the water non-suitable for irrigation.
Table 4: Status of Sirsa river water quality indices assigned for irrigation purposes
|
Treatments |
PI (%) |
CAI (%) |
|
T1 |
34.22 |
0.58 |
|
T2 |
30.26 |
0.5 |
|
T3 |
28.2 |
0.49 |
|
T4 |
41.46 |
0.28 |
|
T5 |
51.9 |
0.14 |
|
T6 |
53.35 |
0.04 |
|
T7 |
57.89 |
0.19 |
|
Range |
28.20-57.89 |
0.04-0.58 |
|
CD |
0.82 |
0.03 |
|
Mean±SD |
42.47±0.28 |
0.32±0.02 |
|
Min |
29.02 |
0.06 |
|
Max |
57.07 |
0.55 |
Chloro-Alkaline Index (CAI)
The CAI is based on Cl- ion concentration in water and is commonly used to evaluate the ion exchange reactions occurring between groundwater and its host rock.46, 47 Chloride is a vital micronutrient which acts as a cofactor in the water oxidation during photosynthesis. In order to sustain a charge balance during cation transport, it is readily taken up by plants contributing towards cell hydration and turgor maintenance. Chloride also serves to maintain a balance of the positive charge of the soluble cations Na+, Ca+, Mg+, and K+in the soil.48However, at high concentrations, it can cause toxicity and problems in plants such as marginal leaf burn and interveinal chlorosis, reduced yields etc. Positive CAI values indicate the occurrence of base-exchange reactions, wherein Ca2+ and Mg2+ ions existing in water react with clay minerals to discharge Na+and K+whereas negative CAI values depict chloro-alkaline imbalance or absence.49, 50, 25 The CAI values for Sirsa river water ranged between 0.04-0.58% and therefore found suitable for irrigation (Table 4). The sheriff and Hussain (2017)38 have reported CAI values in the range of -0.153 to 0.726 meq/L for Noyyal river water situated at Tiruppur in Tamilnadu to evaluate its fittingness for irrigation. Kumar et al. (2014)50 quantified positive CAI values in 70% water samples collected from the south Chennai coastal aquifers in Tamil Nadu, India.
Conclusions
Most of the water quality parameters likeSAR, SSP, RSC, PI, Mg. Haz. and CAI were within the acceptable standard limits for its use in irrigationexceptKelly’s Ratio (KR) values. The study inferred that the industrial activities have started impacting the Sirsa river water quality as indicated by high Kelly’s Ratio values. The high KR values pointed out the sodicity hazard of water which makes it non-suitable to irrigation. However, the continuous disposal of untreated municipal and industrial effluents in the Sirsa river may pose environmental risks and health hazards to the inhabitants and the adjoining agricultural fields. Therefore, before using river water for irrigation, it's quality monitoring is necessary as its regular and continuous use for irrigation may influence the soil and plant health. Moreover, the regulatory standards for emission and discharges from different industries should be strictly followed and regular/proper implementation of clean technology and environmental measures by industries should be employed to achieve sustainable management of water resources.
Conflict of Interest
There is no conflict of interest for this manuscript.
Acknowledgements
The authors acknowledge the Ministry of Environment Forest and Climate Change (MoEF&CC), Government of India for providing the necessary funding to facilitate the research work.
References
- Kannj I., Achi O. Industrial effluents and their impact on water quality of receiving rivers in Nigeria.J. Appl. Technol. Env. Sanit. 2011; 1(1):75-86.
- Arfanuzzaman M., Rahman A.A. Sustainable water demand management in the face of rapid urbanization and groundwater depletion for social-ecological resilience building.Global Eco. Conserv. 2017; 10:9-22.
CrossRef - Sharma R., Rishi M.S., Lata R., Herojeet R. Evaluation of surface water quality for irrigation purposes in limestone mining areas of district Solan, Himachal Pradesh, India. Int. J. Innov. Sci. Eng. Technol.2014; 1(8):368-375.
- Reza R., Singh G. Assessment of heavy metal contamination and its indexing approach for river water. Int. J. Env. Sci. Technol.2010; 7(4):785-792.
CrossRef - Haritash A.K., Gaur S., Garg S. Assessment of water quality and suitability analysis of river Ganga in Rishikesh, India. Appl. Water. Sci.2016; 6:383-392.
CrossRef - Tiwari P. Water quality assessment for drinking and irrigation purpose. Ind. J.Sci.Res.2017; 13(2):140-142.
- Bhutiani R., Faheem A., Tyagi V., Ram K. Evaluation of water quality of river Malin using water quality index at Najibabad, Bijnor (UP) India. Environ. Conserv. J.2018; 19(1&2):191-201.
- Keraita B.N., Drechsel P. Agricultural use of untreated urban wastewater in Ghana. In: Scott C.A., Faruqui N.I., Raschid-Sally L. (Eds.). Wastewater use in irrigated agriculture.2004; CABI Publishing, Wallingford, UK, pp. 101–112.
CrossRef - Scott C.A., Faruqui N.I., Raschid-Sally L. Wastewater use in irrigated agriculture: management challenges in developing countries. In: Scott C.A., Faruqui N.I., Raschid-Sally L. (Eds.). Wastewater Use in Irrigated Agriculture.2004; CABI Publishing, UK.
- Qadir M., Wichelns D., Raschid-Sally L., McCornick P.G., Drechsel P., Bahri A., Minhas P.S. The challenges of wastewater irrigation in developing countries.Agric. WaterManag. 2010; 97:561-568.
CrossRef - Herojeet R.K., Rishi M., Tuli N. Impact of industrialization on groundwater quality: A case study of Nalagarh valley, Himachal Pradesh, India. In: Proceeding of International Conference on Integrated Water, Wastewater & Isotope Hydrology2013; 3:69-75.
- Government of Himachal Pradesh (GoHP) Economic survey 2010–11. Himachal Pradesh Finance Department, Shimla. http://himachalservices.nic.in/economics/pdf/EconSurveyEng2012_A1b.pdf.
- Government of India (GoI) Himachal Pradesh development report, state plan division, planning commission. Government of India, 2012; pp 1–18. http://planningcommission.nic.in/plans/stateplan/sdr_hp/sdr_hpch16.pdf.
- CGWB. Report on the groundwater exploration in the parts of intermontane Sirsa valley, Nalagarh Teshil, Solan District, Himachal Pradesh, Unpub.(1975) pp.1-42.
- Herojeet R., Rishi M.S., Lata R., Tenzin T., Konchok D. Hydrochemical classification and quality characterization of surface water for irrigation purposes in parts of Sirsa watershed, Nalagarh Valley, Himachal Pradesh, India. SOPAAN-II 2016; 1(1): 37-48.
- Herojeet R.K., Rishi M.S., Lata R., Konchok D. Quality characterization and pollution source identification of surface water using multivariate statistical techniques, Nalagarh Valley, Himachal Pradesh, India. Appl Water Sci.2017; doi: 10.1007/s13201-017-0600-y.
CrossRef - DOA. District Agriculture Plan, Solan H.P. 2009; Vol 11 http://hillagricrepository.co.in/1024/1/87676.pdf
- Crompton T.R. Carbonate, Bicarbonate and Total Alkalinity. In: Determination of Anions. 1996; Springer, Berlin, Heidelberg.doi: 10.1007/978-3-642-61419-4_8.
CrossRef - Eaton E.M. Significance of carbonate in irrigation water. Soil Sci.1950;69:123-133.
CrossRef - Eaton A.D., Clesceri L.S., Greenberg A.E. Standard methods for the examination of water and wastewater, 19th edn. 1995; APHA, New York.
- Richards L.A. Diagnosis and improvement of saline alkali soils. In: agriculture, handbook no 60. 1995; US Department of Agriculture, Washington, pp-160.
- Doneen L.D. The influence of crop and soil on percolating water. In: Proceedings of the Biennial conference on groundwater recharge. 1962; pp 156-163.
- Kelly W.P. Use of saline irrigation water. Soil Sci.1963; 95:355-391.
CrossRef - Paliwal K.V. Irrigation with saline water.IARI Monograph no 2 (New series), 1972; New Delhi, pp -198.
- Salifu M., Aidoo F., Hayford M.S., Adomako D., Asare E. Evaluating the suitability of groundwater for irrigational purposes in some selected districts of the Upper West region of Ghana. Appl. Water Sci. 2017; 7:653–662.doi: 10.1007/s13201-015-0277-z.
CrossRef - Bureau of Indian Standards (BIS). Indian standard drinking water specification (second revision) BIS 10500:2012, New Delhi.
- Gandaseca S., Rosli N., Ngayop J., Arianto C.I. Status of water quality based on the physicochemical assessment on river water at wildlife sanctuary Sibuti Mangrove forest, Miri Sarawak. American J. Environ. Sci. 2011; 7(3) : 269-275.
CrossRef - Gupta N., Pandeya P., Hussain J. Effect of physicochemical and biological parameters on the quality of river water of Narmada, Madhya Pradesh, India. Water Sci. 2017; 31 (1): 11-23.
CrossRef - Rana A., Bhardwaj S.K., Thakur M. Surface water quality and associated aquatic insect fauna under different land-uses in Solan (District Solan), Himachal Pradesh. Indian J. Ecol.2016; 43 (1): 58-64.
- Bora M., Goswami D.C. Water quality assessment in terms of water quality index (WQI): a case study of the Kolong River, Assam, India. Appl. Water Sci.2017; 7:3125-3135.doi:10.1007/s13201-016-0451-y.
CrossRef - Al-Badaii F., Othman M.S., Gasim M.B. Water-quality assessment of the Semenyih River, Selangor, Malaysia. J. Chem. 2013; Article ID 871056, 1-10, http://dx.doi.org/10.1155/2013/871056
CrossRef - CGWB and CPCB. Status of groundwater quality and pollution aspects in Delhi, India.2003; http://cpcb.nic.in/gwq-standards.pdf
- Richards L.A. Diagnosis and improvement of saline-alkali soils. In: agriculture, handbook no 60. US Department of Agriculture, Washington,1954, pp 160.
- Tak H.I., Bakhtiyar Y., Ahmad F., Inam A. Effluent quality parameters for safe use in agriculture. In: Water quality, soil and managing irrigation of crops. Lee TS (Ed.), 2012; ISBN: 978- 953-51-0426-1, InTech, http://www.intechopen.com/books/water-quality-soil-and-managingirrigation-of crops/effluent-quality-parameters-for-safe-use-in-agriculture
- United States Department of Agriculture (USDA).Assessing water quality for human consumption, agriculture, and aquatic Life Uses, Natural Resources Conservation Service, 2008; Environment Technical Note No. MT1 (Rev. 1).
- Wilcox L.V. Classification and use of irrigation water. Washington, United States Department of agriculture, 1955; Circ. 969.
- USSL Salinity Laboratory. Diagnosis and improvement of saline and alkaline soils.1954; US Department of Agriculture Handbook, No. 60, 160 p.
- Shammi M., Karmakar B., Rahman M.M., Islam M.S., Rahman R., Uddin, M.K. Assessment of salinity hazard of irrigation water quality in the monsoon season of BatiaghataUpazila, Khulna District, Bangladesh and adaptation strategies. Pollut.2016; 2(2):183-197.
CrossRef - Sheriff K.M.M., Hussain A.Z. Evaluation of groundwater quality and its suitability for irrigation use on the bank of Noyyal river at Tiruppur, Tamilnadu, India. Env.Poll. Prot. 2017; 2(3):100-111. doi.org/10.22606/epp.2017.2300.
CrossRef - Gholami S., Srikantaswamy S. Analysis of agricultural impact on the Cauvery river water around KRS Dam. World Appl. Sci. J.2009; 6(8):1157-1169.
- Dash A., Das H.K., Mishra B. Hydrogeochemistry and groundwater quality in and around Joda of Keonjhar district, Odisha, India. Int. J. Env. Sci. Technol.2014; 12(2):409-419.
- Sakthivel R. TDS levels for traditional crops, TDS – resistant crops submitted by India: Water Portal. 2007; International Land Development Consultants, WES, Net India, New Delhi.
- Joshi D.M., Kumar A., Agrawal N. Assessment of the irrigation water quality of river Ganga in Haridwar district India. J. Chem. 2009; 2(2):285-292.
- Ayers R.S., Wescot D.V. Water quality for agriculture. FAO Irrigation and Drainage, 1985; Paper. 29. FAO, Roma.,174 p.
- Laze P., Smajl R., Alban I. Assessment of irrigation water quality of Dukagjin basin in Kosvo. J. Int. Sci. Pub.Agric. Food2016; 4:544-551.
- Schoeller H. Geochemistry of groundwater. An international guide for research and practice UNESCO, 1967; chapter 15, pp 1–18.
- Sastri J.C.V. Groundwater chemical quality in the river basin. Hydrogeochemicalfacies and hydrogeochemical modelling.1994; Lecture notes-Refresher course conducted by the School of Earth Science.BharathidasanUniversity.Trichirapalli, Tamilnadu, India.
- Kafkafi U. Effects of chlorides in effluents used for irrigation on the irrigated crops. Israel J. Plant Sci.2011; 59(2-4):139-146. doi: 10.1560/IJPS.59.2-4.139.
CrossRef - Ahamed J.A., Ananthakrishnan S., Loganathan K., Manikandan K. Assessment of groundwater quality for irrigation use in Alathur block, Perambalur district, Tamilnadu, South India. Appl. Water Sci. 2013; 33(4):763-771.
CrossRef - Kumar K.K., Bharani R., Magesh N.S., Godson P.S., Chandrasekar N.Hydrogeochemistry and groundwater quality appraisal of part of south Chennai coastal aquifers, Tamil Nadu, India using WQI and fuzzy logic method. Appl. Water Sci. 2014; 4:341-350.Doi: 10.1007/s13201-013-0148-4.
CrossRef


