Impact Appraisal of Industrialization on Heavy Metal Contamination of Sirsa River Located in the Shivalik Foothills of North Western Himalayas
S K Bhardwaj1 , R Sharma1 and R K Aggarwal1 *
1
Department of Environmental Science,
University of Horticulture and Forestry,
Nauni-173230,
Solan,
India
http://dx.doi.org/10.12944/CWE.14.2.09
In the era of industrialization, deterioration in the quality of aquatic systems has necessitated the monitoring of the environmental contaminants amongst which heavy metals are one of the dangerous pollutants owing to their high toxicity and bioaccumulation. Therefore, heavy metal status of Sirsa river flowing through Baddi Barotiwala Nalagarh (BBN) industrial region was assessed dividing it into six equal stretches and taking river’s entry point to this region as control. In total there were seven treatments which were replicated six times. The nine heavy metals namely As, Cd, Cr, Cu, Fe, Pb, Ni, Zn and Mn were in the range of 0-0.02, 0-0.07, 0.02-0.10, 0.04-0.29, 0.09-1.20, 0.03-0.55, 0.03-0.27, 0.30-0.25 and 0.02-0.32 mg/l, respectively. All the metals were within the permissible limit prescribed by Bureau of Indian Standards (BIS) except Ni and Pb. The mean value of Heavy metal pollution index (HPI) and Metal index (MI) was 999 and 13, respectively and waster was rated under poor to very poor category for drinking purposes. A strong positive correlation was observed between Cr, Fe, Cd, Mn, Ni, Pb and Zn representing corresponding increase in their concentrations specifying thereby the common origin of these metals from industrial activities. Therefore, the strict compliance of regulatory standards enacted for emission and discharges from industrial areas is needed to maintain the homeostasis of these riverine ecosystems as well as to aid in designing strategies for long-term management of valuable water resources.
Copy the following to cite this article:
Bhardwaj S. K, Sharma R, Aggarwal R. K. Impact Appraisal of Industrialization on Heavy Metal Contamination of Sirsa River Located in the Shivalik Foothills of North Western Himalayas. Curr World Environ 2018;14(2). DOI:http://dx.doi.org/10.12944/CWE.14.2.09
Copy the following to cite this URL:
Bhardwaj S. K, Sharma R, Aggarwal R. K. Impact Appraisal of Industrialization on Heavy Metal Contamination of Sirsa River Located in the Shivalik Foothills of North Western Himalayas. Curr World Environ 2018;14(2) Available from: https://bit.ly/2Rm3q0n
Download article (pdf)
Citation Manager
Publish History


Introduction
Water is the essential resource vital to support all life forms on this planet. Rivers due to their function to transport the domestic, industrial wastewater and run-off from cultivated lands in their huge drainage basins are amongst the most susceptible aquatic forms to pollution. The surface water quality of any area is mainly dependent on both the natural processes and anthropogenic influences viz. municipal, industrial and agrarian activities, consequently leading to a huge upsurge in the amount of effluents in the water bodies.1 In the recent times, population explosion and increased human interventions have enforced a huge burden on the river ecosystems negatively affecting their natural productive capacity and ecosystem homeostasis.2 Surface water pollution rising from point as well as non-point sources is being noticed as a serious and emerging problem.3 Since, rivers act as a major resource for meeting municipal, industrial and irrigation requirements, therefore it is imperious to avert and regulate their contamination for sustainable management.4
Sirsa river, a tributary of the Sutlej, flows through the BBN area of Solan district of Himachal Pradesh (H.P.) which has been rated as rapidly growing “industrial hub”.5 A total number of 5677 Micro, Small and Medium Enterprises (MSMEs) registered with the State Industries Department have been set up in the BBN area of the district as on 31/12/2014 and were in the group of mechanical, chemicals, pharmaceuticals, chemical, cement and glass, paper and pulp, iron and steel, battery, textiles, electrical and electronics etc.6,7 The major type of pollutants severely impacting local atmosphere in the BBN province due to haphazard industrial development are heavy metals, particulate matter, volatile organic compounds, cations and anions and microbial pathogens.5 Multiple scale expansion of industrialized region along with urban sprawl has occurred haphazardly along the Sirsa catchment leading to an enormous waste load in the river water. Presently this region has a total of 2063 operational industrial units and out of these 176, 779 and 1108 units have been reported under red, orange and green category, respectively.8 It has been documented that around 72% of the industrial units in Nalagarh are running without wastewater treatment plants which has additionally intensified the surface water and groundwater pollution.8 Sirsa river act as a major source of irrigation for the cultivation of vegetable crops (pea, tomato, brinjal, capsicum, beans, cabbage, cauliflower, bhindi), sub-tropical fruits, cereals (maize, rice, wheat, barley), pulses and oil seed crops in the region. Consequently, the complaints regarding industrial pollution and its influence on crops and human health are being frequently raised by the residents which prompted the authors to conduct the studies on the major contaminants responsible for the river pollution.
Amongst the various water pollutants, heavy metals generate serious environmental distresses because their non-biodegradable and persistent nature. At higher concentrations, these can lead to the formation of detrimental complex compounds which critically affect the various functions in the living beings.9 Heavy metals due to their conservative nature have maximum probability of bio-magnification in the food chain and thus, their presence in the untreated or allegedly treated industrial or municipal effluents exhibit several possible hazards to aquatic ecosystem, animal, plant and human health.10, 11, 3 The quantification of heavy metals by using heavy metal pollution index (HPI) and metal index (MI) provides aid in ascertaining water quality trends and can also provide the necessary information to assess its suitability for various purposes and water resource management.12, 13, 14, 15, 16, 17, 18 Thus, the present investigation was conducted to evaluate the impact of rapid industrialization on heavy metal status in Sirsa river to ascertain their concentration with respect to international and national standards and to work out its suitability for various purposes and sustainable management.
Material and Methods
Study area and sampling
The water quality of Sirsa river was assessed along 29 km stretch falling in BBN region. It is situated between Northern latitudes and Eastern longitudes of 30°52ʹ–31°04ʹ and 76°40ʹ–76°55ʹ, respectively. This region shares border with Haryana in the south-east direction, i.e., Kalka-Pinjor area and with Punjab in the direction of south-west, i.e., Ropar district. Sirsa River a tributary of Satluj, enters in the Solan District near Baddi and flows straight into Punjab. To assess the industrial impact detailed survey of the Sirsa river catchment was conducted. Considering the industrial activities in the catchment and effluent disposal, the river was divided into six stretches (Fig. 1). The entry point of river into the industrial hub was considered as control. At each stretch, six water samples were taken from the centre of the river which were considered as replications. Six sampling locations and control site were considered as treatments. Accordingly, there were seven treatments namely Lahorandi (T1), Thapal (T2), Sitalpur (T3), Kaindawal (T4), Karathi (T5), Bagwaniyan (T6) and Jugatkhana (T7) which were replicated six times. Total 42 water samples were gathered across the flow of Sirsa river in January 2018.
 |
Figure 1: Sampling locations along Sirsa river Click here to view Figure |
Laboratory Analysis
Samples collection was done with the help of pre-washed bottles at depths varying from 15 - 30 cm. Water samples were immediately acidified with 2 ml HNO3 and 2 ml HCl to lower the pH to ≤2. The samples were kept at 4°C in an ice box, transported to the laboratory for further investigations. For determination of heavy metals, samples were filtered through Whatman No. 42 filter paper and were further used for Spectroquant® Pharo 300 using standard Merc reagent kits. The nine heavy metals namely Arsenic (As), Cadmium (Cd), Chromium (Cr), Copper (Cu), Iron (Fe), Lead (Pb), Nickel (Ni), Zinc (Zn) and Manganese (Mn) were quantified as mg/l using the standard procedures suggested by American Public Health Association.19 The data quality during analysis was confirmed by taking triplicate samples and through standardization and blank measurements. The data obtained from the analysis of water samples was subjected to statistical analysis using one-way SPSS 11.0 software. Microsoft Excel 2010 was adopted for the estimations and data analysis.
Interpretation of water quality
The results were compared with the standards framed by BIS20 and World Health Organization21 (Table 1).
Table 1: Drinking water standard values for heavy metals
|
Toxic metal |
WHO 2008 Health based guideline (mg/l) |
BIS-10500-2012 |
Detrimental effects of heavy metals present beyond maximum permissible limit (MPL) on human health |
|
|
Requirement limit)
|
Permissible limit In the absence of alternative source
|
|||
|
(mg /l)
|
(mg /l) | |||
|
Arsenic |
0.01 |
0.01 |
0.05 |
Oncogenesis in skin, lungs and kidneys. It can also cause skin thickening and pigmentation. |
|
Cadmium |
0.003 |
0.003 |
- |
Excessive exposures may impair lung function and increase the risk of lung cancer |
|
Chromium |
0.05 |
0.05 |
- |
Respiratory tract irritant and can cause pulmonary sensitization. Increases the risk of lung, nasal, and sinus cancer |
|
Copper |
2.0 |
0.05 |
1.5 |
Nausea, vomiting, stomach cramps, or diarrhoea. High intakes leads to liver and kidney damage and even death |
|
Iron |
- |
0.3 |
- |
Hemochromatosis with the accumulation of iron in tissues and organs increasing the risk of arthritis, cancer, liver problems, diabetes and even heart failure |
|
Lead |
0.01 |
0.01 |
- |
Affects the development of the brain and nervous system. Lead also causes long-term damage in adults, including increased risk of high blood pressure and kidney impairment. |
|
Nickel |
0.02 |
0.02 |
- |
Chronic bronchitis, reduced lung function, allergies, carcinogenesis and cancer of the lung and nasal sinus |
|
Zinc |
3.0 |
5 |
15 |
Damaging impacts on growth, neuron system development, and immunity |
|
Manganese |
- |
0.1 |
0.3 |
Majorly affects the respiratory tract and the brain. Manganese poisoning can cause hallucinations, absent-mindedness, nerve damage, lung embolism and bronchitis. |
Indicates NOT AVAILABLE
Heavy Metal Pollution Index (HPI)
It is a method that delivers the compound impact of each heavy metal on the total water quality.22 The relative importance of HPI in defining quality of water and its appropriateness for consumption resolves have been advocated by several authors.12, 15, 17, 18, 22, 23 The HPI was calculated by using the following equation (1) given by Majhi and Biswal (2016)22 –
HPI = 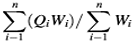 ………..(1)
where Qi is the ith parameter’s sub-index, Wi is the ith parameter unit weightage and n is the number of parameters measured. According to HPI values, water quality has been categorized into four dissimilar water quality statuses (Table 2).
Table 2: Heavy metal status of Sirsa river water
|
Treatments (location) |
Iron |
Nickel |
Chromium |
Cadmium |
Copper |
Manganese
(mg/l) |
Lead |
Zinc |
Arsenic |
|
T1 (Lahorandi) |
0.09 |
0.03 |
0.02 |
0.00 |
0.04 |
0.02 |
0.03 |
0.03 |
0.000 |
|
T2 (Thapal) |
0.32 |
0.04 |
0.03 |
0.00 |
0.07 |
0.05 |
0.04 |
0.03 |
0.001 |
|
T3 (Sitalpur) |
0.56 |
0.11 |
0.05 |
0.01 |
0.14 |
0.15 |
0.11 |
0.06 |
0.002 |
|
T4 (Kaindawal) |
1.09 |
0.20 |
0.10 |
0.02 |
0.21 |
0.22 |
0.21 |
0.09 |
0.002 |
|
T5 (Karathi) |
1.21 |
0.22 |
0.10 |
0.04 |
0.29 |
0.22 |
0.32 |
0.12 |
0.010 |
|
T6 (Bagwaniyan) |
1.21 |
0.27 |
0.10 |
0.06 |
0.28 |
0.30 |
0.48 |
0.13 |
0.012 |
|
T7 (Jugatkhana) |
1.20 |
0.23 |
0.07 |
0.07 |
0.26 |
0.32 |
0.55 |
0.25 |
0.022 |
|
Range |
0.09-1.20 |
0.03-0.27 |
0.02-0.10 |
0.00-0.07 |
0.04-0.29 |
0.02-0.32 |
0.03-0.55 |
0.03-0.25 |
0.000-0.022 |
|
CD |
0.03 |
0.01 |
0.02 |
0.01 |
0.02 |
0.02 |
0.02 |
0.02 |
0.001 |
|
Mean±SD |
0.81±0.02 |
0.16±0.10 |
0.07±0.03 |
0.03±0.03 |
0.18±0.01 |
0.18±0.02 |
0.25±0.20 |
0.10±0.08 |
0.01±0.01 |
|
Min |
0.11 |
0.04 |
0.03 |
0.01 |
0.05 |
0.04 |
0.05 |
0.05 |
0.00 |
|
Max |
1.20 |
0.26 |
0.09 |
0.06 |
0.28 |
0.30 |
0.52 |
0.23 |
0.02 |
Metal Index (MI)
Metal Index is another index to assess the additive effect of heavy metals on the complete water quality. Higher concentration of metals in comparison to MAC (Maximum Allowed Concentration) value indicates the poor water quality.24, 25 The MI was calculated by using the following equation (2) given by Tamasi and Cini (2004)26
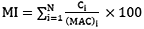 ………..(2)
where MI is the metal index, C is the element concentration in solution, MAC is the maximum allowed concentration of each element, and the subscript i is the ith sample. To study the relationship among heavy metals, the correlation was worked out using Karl Pearson’s correlation coefficient at probability of p<0.05.
Results and Discussion
Heavy metals status in river water
Iron (Fe)
Iron is the most ample heavy metal on the earth and chiefly exists in the environment as Fe2+ or Fe3+. Iron is a crucial element of human diet owing to its ability to form fundamental components of cytochromes, porphyrins and metallo-enzymes. But its excessive intake results in hemochromatosis affecting the normal metabolism.27, 11 Sirsa river water was found to have Fe in the range of 0.09-1.20 mg/l (Table 2). The Sirsa river was noticed to vary significantly with respect to Fe concentration as it flows down from control site along-side the industrial activities (Table 2). Although there was not a specific trend, however at each passing point the river water contained Fe content higher than the permissible limits prescribed by BIS indicating thereby that the industrial activities have impacted water quality. It is well recognized aspect that Fe contamination of water can either be geogenic or via anthropogenic sources. Although Fe contamination from groundwater is possible but in the investigation it was exaggerated possibly due to the direct disposal of untreated industrial and domestic sewage from corroded iron pipes into the river and wastes from vehicle repairing workshops in the region. 6, 7 Many authors have reported the high Fe concentrations in the different Indian rivers due to various anthropogenic activities including leachates coming from the near-by landfills (Table 10).
Nickel (Ni)
Nickel is an essential metal for different biotic forms and its presence in either high or low concentrations can cause metabolic disfunctions.28 The long term exposure to high concentrations of Ni can cause various human health concerns such as reduced body bulk, heart and liver injury, nickel-induced carcinogenesis and skin allergies.29 Its concentration has been reported to rise in environment due to various human activities like mining activities, emission of smelters, coal and oil burning, sewage disposal, phosphate fertilizers and pesticides.30, 11 River water Ni was found to range from 0.03-0.27 mg/l (Table 2) and varied significantly throughout the stretch from control to the end point. However, no specific trend in its distribution in river water was noticed. At each passing point, all the samples of the river water contained Ni content above the permissible standard limits demonstrating significant impact of the industrial activities on the water quality (Table 2). The apparent reason for Ni concentration on higher side in the river water could be the establishment of excessive industrial units and addition of their waste along-with untreated sewage, burning of oil in factories, mining activities and vehicular traffic in the river catchment area. Singh et al. (2017)66 determined such higher concentrations of Ni in the river Ghaghara, a main stream of the Ganga river in Northern India from the anthropogenic input in relation to the natural background values. Similar studies have also been conducted by several researchers (Table 9).
Chromium (Cr)
Chromium can be either useful or lethal to biotic forms subjecting to its concentration and oxidation state. Cr (III) is an indispensable component of a balanced diet at lesser concentrations as it helps in averting contrary effects on the glucose and lipids metabolic rate.31, 32, 33 Owing to its affinity towards various organic compounds, at higher concentrations it can inhibit enzyme systems resulting in interference with several metabolic processes.11 Different industries, such as electroplating, paint and pigment manufacturing, textile, fertilizer and leather tanning, discharge Cr in two forms as trivalent Cr (III) and hexavalent Cr (VI) in waste effluents. Out of which Cr (VI) due to high mobility and soluble nature, is highly lethal, mutagenic, and oncogenic.34 Bureau of Indian Standards has recommended an acceptable limit of 0.05 mg/l for Cr in drinking water (Table 1). The study revealed that Cr in river water varied from 0.02-0.10 mg/l (Table 2). The river passing through the industrial region exhibited significant variations in its Cr content however, no specific trend was observed. After the control site, with each passing point of flowing river the Cr content above the permissible standard limits demonstrating substantial impact of the industrial activities on the water quality (Table 2). The probable reason for the presence of Cr in the river water could be direct discharge of waste from electro-coating, paint and dye, fabric manufacturing and pharmaceutical industries or by addition of sewage. Moreover, diffusion of Cr from the soil contaminated with the leachates from the industries could be one of the factors responsible for its presence in river water. Bhattacharya et al (2015)64 and Singh et al. (2017)66 reported Cr quantities higher than the assessed in the study during the heavy metal contamination evaluation of Yamuna and associated drains and Ganga and its tributary river Ghaghara in rural and peri-urban settings of Delhi NCR and in Northern India, respectively. The results were in the line of quantifications done by many other investigators (Table 9).
Cadmium (Cd)
Cadmium is homogeneously dispersed in the earth’s crust. It occurs at comparatively low levels in the aquatic atmosphere as inorganic complexes such as carbonates, hydroxides, chlorides or sulphates.35 Cadmium is efficiently retained and accumulated in the human body after absorption, throughout life where it is mainly toxic to the kidneys and can also cause bone demineralization.36, 37 Cadmium is exploited in numerous industrial applications including Ni-Cd batteries, Cd corrosion-resistant coatings on iron, steel, aluminium and titanium; Cd pigments in plastics, glasses, ceramics, enamels and colours, as an alloying element in soldering, brazing or electrical contacts, in electronic compounds such as cadmium telluride and cadmium sulphide used in solar cells, detectors, electronic gates, switches, sensors and in phosphate fertilizers.38, 39 In the present study, Cd showed deviations in the range of 0.01- 0.07 mg/l (Table 2). Significant variations were found in its concentrations which followed an increasing trend as river flows down from control site towards the last point along-side the industrial activities. In all the samples Cd content was found to be above the standard desirable limits of 0.003 mg/l. The feasible reason for such high concentrations of Cd in the river water may be the addition of wastes from different industries, Cd-stabilized plastics, or Ni-Cd batteries, or unprocessed effluents from sewage treatment plants as corroborated by many other authors.2, 39, 40, 66
Copper (Cu)
Copper occurs widely in the nature and is commonly used by humans. It is an essential trace element vital in different metabolic pathways of living beings, as it is incorporated into a large number of proteins for both catalytic and structural purposes.11 However, at high concentrations, it interferes with a number of cellular processes, and therefore, it is considered hazardous for the environment, especially the aquatic ecosystem.41 The Cu stocks in vehicles (brakes, tyres, protective paint on boats, petrol, car washing), building materials (roofing, electrical earthing, drinking water pipes), infrastructure (aerial lines and road surfacing) copper mining and smelting activities, chemical weathering, steel fabrication processes and from agricultural activities and sewer sludge have been reported to be the major sources.42, 43 During the course of study, Cu was observed be in the range of 0.04-0.29 mg/l (Table 2). Significant variations were noticed in its concentrations which followed a growing trend towards the last point of the river along-side the industrial activities. In all the samples Cu content was below the standard permissible limits of 1.5 mg/l. The possible reason for such high concentrations of Cu in the river water may be the addition of wastes from different industries, textile operations, mining and smelting activities, chemical weathering, from vehicular and building materials or untreated effluents from sewage treatment plants and landfill leachates. Similar variations in the Cu concentrations of surface water to various man-made activities have been stated by several authors. 12, 40, 37, 44, 11
Manganese (Mn)
Manganese is found in abundance in the earth’s crust and is one of the essential element found in all living organisms. It acts as a cofactor in number of metabolic reactions involved in phosphorylation, cholesterol and fatty acid synthesis.45, 46 At higher concentrations, due to its accumulation inside intracellular compartments, it causes a distinctive syndrome linked with neurotoxicity which is known as ‘manganese madness’. The symptoms of syndrome include postural instability, mood disorders and other psychiatric changes.47 The potential emerging environmental contamination of Mn in recent times is due to the substantial production of Mn-containing compounds (metallurgic and chemical products, domestic wastewater releases, sewage sludge, alloys, ceramics, fungicides) and agricultural practices (such as tobacco farming, pesticides, weedicides). Consequently, due to the increased bioavailability, its entry into living entities arises chiefly via the route of water with fast-regulated process of accumulation.45 The Sirsa water was found to contain Mn in the range of 0.02-0.32 mg/l (Table 2). Significant variations were observed in its concentrations which trailed an increasing trend towards the last point of the river along-side the industrial activities. The Mn content in river water was found within the permissible limits prescribed by the BIS except the last point of the river wherein its content (0.32 mg/l) was in the harmful range. Higher Mn concentrations in the water from the lower stretch of the river along-side industrial set ups, can be accredited to the disposal of effluents from various iron and steel manufacturing industries or untreated sewage and the burning of diesel fuel in the motor cars and further its high accumulation at lower point due to less flow and stagnancy of water which has also been validated by several authors.1, 40, 12, 2
Lead (Pb)
Lead is a toxic heavy metal generally dispersed in the environment. The inorganic forms of Pb are absorbed through food and water. Lead poisoning has been reported to cause teratogenic effect, inhibits haemoglobin synthesis, dysfunctioning of the kidneys, damages gastrointestinal and urinary tract and central and peripheral nervous system.48, 49 Lead is used in the manufacture of rechargeable storage batteries, pipes and reaction tanks in the chemical industries, in metal products, plumbing paints, colorants and ceramic glazes, auto-waste (lead acid batteries), sport implements, water pipes, house and building roofs, various alloys, fuse wires, bearings, and lead crystal glassware.49, 50 Additionally, burning of leaded gasoline in the automobiles is the main cause of Pb emissions to the air and finally deposition in the soil and water. Due to its non-biodegradable nature, it persists in the atmosphere and stockpiles in soils, aquatic systems and sediments through deposition, leaching and erosion.51 In the river water, Pb was found to be in the range of 0.03-0.55 mg/l (Table 2) which was above the standard permissible limits. The concentrations of Pb showed significant variations with an increasing trend towards the last point of the river flowing down the industrial hub in the area. The excessive industrialization/urbanization and disposal of effluents from profusely existing metal, plastic and glass industries in the selected area, landfill leachates, also auto-waste (lead acid batteries), which leads to high concentrations of Pb in soil, and ultimately diffusing through the soil solution into groundwater and surface water can be ascribed to the higher concentrations of Pb in the water.7 Similar Pb contamination has been observed by Nair et al. (2010)40 in the water of Meenachil river at Kottayam, Kerala (India) by principal component analysis technique.
Zinc (Zn)
Zinc acts as a co-factor for several proteins and enzymes required to carry out replication and translation of genetic material in all living beings.52 Incorporation of excess amount of Zn can cause system dysfunctions such as yellowing of mucus membrane, liver and kidney damage leading to impairment of growth and reproduction.53, 54 Zinc is a very common atmospheric pollutant and due to its easy adsorption on water-borne suspended particles, its occurrence in the water bodies intimidates the homeostasis of water ecosystems.52 The major Zn pollution sources includes untreated domestic and industrial wastewater discharge (e.g. paint and dye, chemical production, metal processing, electronic industry) and agricultural and surface runoff. In the river water, Zn was found to be in the range of 0.03-0.25 mg/l (Table 2) which was well below the standards limits of 5.0 mg/l approved by BIS. Although significant variations were observed in Zn concentrations which followed an accumulative trend towards the last point of the river along-side the industrial activities but still less concentrations reported in the study can be attributed to its less and slow transportation. The aggregative effect in Zn concentration along the lower stretch of the river could be probably due to the addition of ill-treated wastes from the rapidly expanding regions with dense population and industrial establishments and landfill leachates.7 Bhattacharya et al. (2015)64 and Kashyap et al. (2015)55 reported Zn magnitudes higher than the assessed in the study during the heavy metal pollution evaluation of Yamuna and associated drains in rural and peri-urban settings of Delhi NCR (0.21- 2.22 mg/l) and in Rewalsar lake of HP (0.11-0.325 mg/l), respectively due to over population and urban sprawl. Similar results have been reported by many other scientists (Table 9).
Arsenic (As)
Arsenic exists in the atmosphere both in organic and inorganic forms. It is organized in the environment with a combination of several geogenic events such as weathering reactions and volcanic emissions as well as through a range of man-made sources such as mining activities, combustion of fossil fuels, usage of arsenical pesticides, herbicides and crop desiccants, arsenal products in wood preservation and as an additive in livestock feed, particularly for poultry.11, 56, 57, 59, 60 Due to burning of fossil fuels, emission take place in the environment with volatilization of As4O6 which condenses in the flue system and ultimately transferred into water reservoirs. The widespread environmental contamination of the inorganic toxic form of As is an alarming problem due to its non-biodegradable nature, perseverance in the environment; and consequently access to the food chain. Arsenic is a known human carcinogen even at low concentrations (0.002 mg/l) and its acute toxic exposure can cause intestinal distress.58 BIS has endorsed 0.05 mg/l as permissible concentration of As in drinking water. In the river water samples, As concentration varied from 0.00-0.02 mg/l (Table 2) which was well within the standard limits. Significant variations were observed in its concentrations which followed a cumulative trend towards the last point of the river along-side the industrial accomplishments. Arsenic contamination of the river water in the study area can be ascribed to various anthropogenic activities like mining, fossil fuels combustion, addition of industrial effluents, use of As as an additive in livestock feed and for wood preservation, from where it is diffused into soil and finally reaches the river. Hussain et al. (2017)11 have also reported variable presence of As in the river water due to numerous human activities.
Table 3: HPI calculations for Sirsa river water
|
Sr. No. |
Heavy metal |
Mean Concentration |
Highest permitted value for drinking water (Si) |
Constant of proportionality (k = 1/∑Sn) |
Unit weightage Wi= k/Si |
Sub index (Qi) |
Wi*Qi |
|
1 |
Fe |
0.71 |
0.3 |
0.78 |
0.002 |
236 |
0.61 |
|
2 |
Ni |
0.16 |
0.02 |
0.78 |
0.039 |
800 |
2.08 |
|
3 |
Cr |
0.07 |
0.05 |
0.78 |
0.015 |
140 |
2.18 |
|
4 |
Cd |
0.03 |
0.003 |
0.78 |
0.260 |
1000 |
260.00 |
|
5 |
Cu |
0.18 |
0.05 |
0.78 |
0.015 |
360 |
5.61 |
|
6 |
Mn |
0.18 |
0.1 |
0.78 |
0.007 |
180 |
1.40 |
|
7 |
Pb |
0.25 |
0.01 |
0.78 |
0.078 |
2500 |
195.21 |
|
8 |
Zn |
0.10 |
5 |
0.78 |
0.000 |
2 |
0.00 |
|
9 |
As |
0.01 |
0.01 |
0.78 |
0.078 |
100 |
7.80 |
∑Wi = 0.496 , ∑Qi.Wi = 474.90 , HPI= 957.45
Heavy metal pollution index
The HPI calculations for Sirsa river water have been represented in Table 3 and HPI values for individual treatment have been presented in Table 4. The mean HPI value was calculated to be 999, which was above the critical index value 75 (Table 5). Scrutiny of the HPI values shown in Table 4 it could be concluded that the heavy metal pollution load at sampling sites 2, 3, 4, 5, 6 and 7 was most significant and the Sirsa river was categorised into poor to very poor class of water quality. It was observed that Cd, Ni, Pb and As were contributing more to the heavy metal contamination based on HPI values more than the critical pollution index. The increasing trend of HPI values towards the last point of the river along-side the industrial activities clearly indicated towards a significant cumulative effect of anthropogenic activities such as addition of untreated wastes from the rapidly expanding enormous and dense human habitations and industrial establishments. The study area has been reported to be a hub for several industrial set-ups situated adjoining the Sirsa river that discharge their effluents/wastes directly into it.6, 7 Apart from it, many other tributaries carrying effluents from other industries also join Sirsa river indirectly enhancing the heavy metals load.6 Additionally, vehicular pollution leading to atmospheric depositions, lesser soil filter media due to erosion, landfill leachates and lack of proper drainage systems also contributed to the metal burden. In order to evaluate the heavy metal pollution and its impact on the water quality, higher HPI values have been reported by several authors.61, 13, 23, 16, 17, 18 The occurrence of such persistent heavy metals beyond the recommended limits in water is harmful to all biotic forms. Thus, it is imperious to eliminate or lessen environmental heavy metal contamination. The well-known conventional physical and chemical procedures for the heavy metal removal or recapture exhibit disadvantages such as high cost, non-specificity, noxious waste generation and high chemical requirements etc. Alternatively, bioremediation is a novel technique for the conversion of toxic heavy metal ions into less harmful forms involving use of living organisms. In phytoremediation, plants use phytostabilization, phytoextraction and rhizofiltration to clear-out heavy metals. Similarly, microorganisms employ biosorption, bioaccumulation, biotransformation, and biomineralization for the remediation of metal polluted environment. Bioremediation is a less cost intensive, sustainable and eco-friendly alternative to physical and chemical techniques that helps in restoration of the usual state of the contaminated environment. Further investigation and implementation of such environmental friendly technology and measures should be embraced by industries and state agencies in the region to explore its applications in industrial wastewater management.
Table 4: HPI values for Sirsa river water
|
Treatment |
HPI value |
|
T1 |
64 |
|
T2 |
88 |
|
T3 |
416 |
|
T4 |
800 |
|
T5 |
1356 |
|
T6 |
1992 |
|
T7 |
2274 |
*Mean HPI = 999
Table 5: HPI based status categories of water quality
|
Sr. No. |
HPI |
Water Quality |
|
1 |
0-25 |
Very good |
|
2 |
26-50 |
Good |
|
3 |
51-75 |
Poor |
|
4 |
Above 75 |
Very poor (unfit for drinking) |
Metal index
The MI values for Sirsa river water was found to be in the range of 0.02- 25.00 with mean value of 13.68 (Table 6) indicating that the water has been seriously affected due to industrial activities in the region. Further river water was classified according to the MI values and it was suggested that most of the river water was moderately to seriously affected with respect to metal pollution (Table 7). This can be ascribed to the direct discharge of untreated sewage and industrial effluents from large number of industries including chemical and mineral processing plants, plastic and glass industry, textile mills and other small scale industries located this study area.6,7 Pal et al. (2017)18 have also reported the MI values in the range of 3.44-23.15 for Yamuna river water in Agra region in India demonstrating that the water was highly affected owed to industrial pollution.
Table 6: MI calculations for Sirsa river water
|
Sr. No. |
Heavy metal |
Mean Concentration (mg/l) |
Maximum Allowable Conc. (MAC) (mg/l) |
MI |
|
1 |
Fe |
0.71 |
0.3 |
2.37 |
|
2 |
Ni |
0.16 |
0.02 |
8.00 |
|
3 |
Cr |
0.07 |
0.05 |
1.40 |
|
4 |
Cd |
0.03 |
0.003 |
10.00 |
|
5 |
Cu |
0.18 |
0.05 |
3.60 |
|
6 |
Mn |
0.18 |
0.1 |
1.80 |
|
7 |
Pb |
0.25 |
0.01 |
25.00 |
|
8 |
Zn |
0.10 |
5 |
0.02 |
|
9 |
As |
0.01 |
0.01 |
1.00 |
*Mean MI = 13.68
Table 7: MI based status category of the Sirsa river water
|
Sr. No. |
MI |
Characteristics |
Class |
|
1 |
≤0.3 |
Very pure |
I |
|
2 |
0.3-1.0 |
Pure |
II |
|
3 |
1.0-2.0 |
Slightly affected |
III |
|
4 |
2.0-4.0 |
Moderately affected |
IV |
|
5 |
4.0-6.0 |
Strongly affected |
V |
|
6 |
>6.0 |
Seriously affected |
VI |
Correlation coefficients matrix represents a relationship amid variables to show the overall consistency of the data set and specify the contribution of the each parameter amongst several contributing factors. Correlation analysis matrix among the heavy metals showed positive correlation with among each other (Table 8). A strong positive correlation among Cr, Fe, Cd, Mn, Ni, Pb and Zn was observed indicating common source and parallel increase in their concentrations i.e. if there is increase in one metal concentration than the other metal concentration also increases. This can be ascertained to the existence of heavy industrial units releasing untreated effluents in the river basin, showing mixed sources of these heavy metals into the river water. Several authors have also reported strong positive correlation among heavy metals for the assessment of river water quality.16, 22, 17, 18
Table 8: Correlation coefficient matrix for heavy metals
|
|
Fe |
Ni |
Cr |
Cd |
Cu |
Mn |
Pb |
Zn |
As |
|
Fe |
1 |
|
|
|
|
|
|
|
|
|
Ni |
0.82 |
1 |
|
|
|
|
|
|
|
|
Cr |
0.96* |
0.93 |
1 |
|
|
|
|
|
|
|
Cd |
0.50 |
0.89 |
0.67 |
1 |
|
|
|
|
|
|
Cu |
0.92 |
0.95* |
0.96* |
0.77 |
1 |
|
|
|
|
|
Mn |
0.67 |
0.97* |
0.83 |
0.93 |
0.86 |
1 |
|
|
|
|
Pb |
0.52 |
0.91 |
0.69 |
0.99* |
0.78 |
0.95* |
1 |
|
|
|
Zn |
0.28 |
0.77 |
0.52 |
0.93 |
0.61 |
0.87 |
0.99* |
1 |
|
|
As |
0.26 |
0.74 |
0.46 |
0.95* |
0.60 |
0.83 |
0.94 |
0.97* |
1 |
|
*Correlation is significant at the 0.05 level (2-tailed) |
|
||||||||
Table 9: Studies on toxic heavy metals distribution in river water samples
|
Sr. No. |
Locations |
Heavy metal concentration (mg/l) |
References |
||||||||
|
Fe |
Ni |
Cu |
Cr |
As |
Pb |
Zn |
Mn |
Cd |
|||
|
1 |
Ghaghara river, Uttar Pradesh and Bihar |
- |
0.018 |
0.032 |
0.007 |
- |
0.019 |
0.031 |
- |
0.0430 |
[2] |
|
2 |
Subarnarekha river, Jharkhand |
3.352 |
- |
0.105 |
- |
- |
0.023 |
0.029 |
0.076 |
0.0048 |
[5] |
|
3 |
Gomti river, Uttar Pradesh and Bihar |
0.176 |
- |
0.0002 |
- |
- |
0.0211 |
0.022 |
0.0153 |
0.0002 |
[1] |
|
4 |
Meenachi river, Kerala |
1.320 |
- |
0.120 |
- |
- |
0.550 |
0.160 |
0.310 |
0.0900 |
[40] |
|
5 |
Godavari basin, Maharashtra, Andhra Pradesh, Chhattisgarh and Odisha |
0.240 |
0.075 |
0.114 |
0.0136 |
0.0093 |
0.0074 |
0.094 |
- |
0.0016 |
[11] |
|
6 |
Khunti river, Jharkhand |
0.259 |
0.026 |
0.005 |
- |
- |
0.017 |
0.045 |
0.090 |
- |
[62] |
|
7 |
Ramganga river, Northern India |
5.217 |
- |
- |
- |
- |
0.0024 |
0.1058 |
- |
0.0129 |
[63] |
|
8 |
Yamuna river, Delhi region |
- |
0.130 |
0.640 |
0.420 |
- |
0.270 |
2.220 |
- |
0.070 |
[64] |
|
9 |
Damodar river, West Bengal |
- |
- |
0.0124 |
- |
- |
0.0065 |
0.0263 |
- |
0.0013 |
[65] |
|
10 |
Ghaghara river, Northern India |
- |
0.380 |
0.260 |
0.970 |
- |
0.710 |
0.190 |
- |
0.930 |
[66] |
|
11 |
Yamuna river, Northern India |
- |
0.570 |
1.764 |
- |
- |
1.526 |
7.920 |
- |
- |
[44] |
|
12 |
Sirsa river, Nalagarh, Solan HP |
1.210 |
0.270 |
0.290 |
0.100 |
0.022 |
0.550 |
0.250 |
0.320 |
0.070 |
Present study |
Indicates - not reported
Conclusion
The study indicated significant deviations in the heavy metals distribution in the river water. The Sirsa river water contained toxic elements viz. Cr, Fe, Cd, Cu, Mn, As and Zn which were found within the acceptable limits except Ni and Pb which were above the maximum permissible limits. River exhibited increasing levels of toxic metals with increasing level of industrial activities as indicated by high mean HPI and MI values 999 and 13, respectively. Interestingly, heavy metals such as Cr, Fe, Cd, Mn, Ni, Pb and Zn exhibited strong positive correlation which further noticed to deteriorate the water quality by corresponding increase in their concentrations indicating common origin source. The results indicated that the river water quality may deteriorate in the upcoming times due to growing anthropogenic contributions in the river basin which clearly demonstrate that there is an urgent need of taking strong steps to provide clean and safe water to the local people. The creation of awareness among the masses and concerned government bodies through science communication for necessary policies is therefore urgently required. Cost effective and eco-friendly alternatives such as bioremediation for restoration of the normal state of the contaminated environment must be adopted. Further investigation and implementation of such environmental friendly technology and measures should be embraced by industries and state agencies in the region to explore its applications in achieving sustainable industrial wastewater management.
Acknowledgments
The authors acknowledge National Mission on Himalayan Studies (NMHS) scheme of Ministry of Environment Forest and Climate Change (MoEF&CC), Government of India for providing necessary funding to facilitate the research work.
References
- Singh V.K., Singh K.P., Mohan D. Status of heavy metals in water and bed sediments of river Gomti – a tributary of the Ganga river, India. Environ. Monit. Assess. 2005; 105(1):43-67.
CrossRef - Singh H., Raghuvanshi D., Pandey R., Yadav A., Tripathi B., Kumar P., Shukla D.N. Assessment of seven heavy metals in water of the river Ghaghara, a major tributary of the Ganga in Northern India. Adv. Appl. Sci. Res. 2016; 7(5):34-45.
- Paul D. Research on heavy metal pollution of river Ganga: a review. Ann. Agrar. Sci. 2017; 15:278-286.
CrossRef - Sankhla M.S., Kumari M., Sharma K., Kushwah R.S., Kumar, R. Heavy metal pollution of holy river Ganga: a review. Int. J. Res. 2018; 5(1): 421-436.
- Herojeet R.K., Rishi, M., Tuli, N. Impact of industrialization on groundwater quality: a case study of Nalagarh valley, Himachal Pradesh, India. Proceedings of International Conference on Integration, Water Wastewater Isothermal Hydrology. 2013; 3:69-7
- Govt. of India, Ministry of MSME. Brief industrial profile of Solan district. 2014-15. Micro, Small and Medium Enterprises Development Institute, Solan. Pp:1-13.
- Devi, M. Inventory and estimation of greenhouse gases from waste in Baddi Barotiwala Nalagarh (BBN) region of district Solan. M.Sc. Thesis. Dr. Yashwant Singh Parmar University of Horticulture and Forestry, Nauni, Solan, India. 2011; Pp 54-69.
- Sharma N. Impact of industrial pollution on BBN area of Himachal Pradesh: a case study of BBN. Int. J. Socio-legal Anal. Rural Dev. 2012; 3(2):24-30.
- Kamaldeep R., Kochhar M.S.N., Ghosh N. Impact of industrialization on groundwater quality—a case study of Baddi-Barotiwala industrial belt, district Solan, Himachal Pradesh, India. J. Indus. Pollut. Contr. 2011; 27(2):153-5
- Singh, J., Kalamdhad A.S. Effects of heavy metals on soil, plants, human health and aquatic life. Int. J. Res. Chem. Environ. 2011; 1(2):15-21.
- Hussain J., Husain I., Arif M., Gupta N. Studies on heavy metal contamination in Godavari river basin. Appl. Water Sci. 2017; 7:4539-4548.
CrossRef - Kumar M., Padhy P.K., Chaudhury, S. Study of heavy metal contamination of the river water through index analysis approach and environmetrics. Bullet. Environ. Pharm. Life Sci. 2012; 1(10): 7-15.
- Prasad B., Kumari S. Heavy metal pollution index of ground water of an abandoned open cast mine filled with fly ash: a case study. Mine Water Environ. 2008; 27(4):265-267.
CrossRef - Singh G., Reza R. Heavy metal contamination and its indexing approach for river water. Int. J. Environ. Sci. Technol. 2010; 7(4):785-792.
CrossRef - Giri S., Singh A.K. Assessment of surface water quality using heavy metal pollution index in Subarnarekha River, India. Water Qual. Expo. Health 2014; 5:173–182.
CrossRef - Capangpangan R.Y., Pagapong N.K., Pineda C.P., Sanchez P.B. Evaluation of potential ecological risk and contamination assessment of heavy metals in sediment samples using different environmental quality indices: a case study in Agusan river, Caraga Philippines. J. Biodivers. Environ. Sci. 2016; 8:1-
- Pal R., Dubey R.K., Dubey S.K., Singh A.K. Assessment of heavy metal pollution through index analysis for Yamuna water in Agra region, India. Int. J. Curr. Microbiol. App. Sci. 2017; 6(12):1491-149
CrossRef - Pal R., Dubey R.K., Dubey S.K., Singh A.K., Sharma T.C. Assessment of heavy metal pollution of Yamuna water in Mathura region through index analysis approach. Int. J. Chem. Stud. 2017; 5(6):1286-1289.
CrossRef - APHA, AWWA, WPCF. Standard methods for the examination of water and waste waters, Report 21st Edn., 2005; American Public Health Association, American Water Works Association and Water Environment Federation, New York, USA.
- Bureau of Indian Standards (BIS) 10500. Specification for drinking water, Report Indian Standards Institution, New Delhi, 2012; pp 1-5.
- World Health Organization (WHO, 2008). Guidelines for Drinking-water Quality. 3rd (ed.) ISBN 978 92 4 154761 1
- Majhi A., Biswal, S.K. Application of heavy metal pollution index (HPI) and correlation coefficient for the assessment of ground water quality near ash ponds of thermal power plants. Int. J. Sci. Eng. Adv. Technol. 2016; 4(8):395-405.
- Milivojevic J., Krstic D., Smit B., Djekic V. Assessment of heavy metal contamination and calculation of its pollution index for Ugljesnica River, Serbia. Bullet. Environ. Cont. Toxicol. 2016; 97:737-742.
CrossRef - Abdullah J.E. Quality assessment for Shatt Al – Arab river using heavy metal pollution index and metal index. J. Environ. Earth Sci. 2013; 3(5):114-120.
- Balakrishnan A., Ramu, A. Evaluation of heavy metal pollution index (HPI) of ground water in and around the coastal area of Gulf of Mannar Biosphere and Palk Strait. J. Adv. Chem. Sci. 2016; 2(3):331-333.
- Tamasi G., Cini, R. Heavy metals in drinking waters from Mount Amiata (Tuscany, Italy) possible risks from arsenic for public health in the province of Siena. Sci. Tot. Environ. 2004; 327:41-5
CrossRef - Mesias M., Seiquer I., Pilar N.M. Iron nutrition in adolescence. Critic. Rev. Food Sci. Nutr. 2013; 53(11):1226-1237.
CrossRef - Cempel M., Nikel, G. Nickel: a review of its sources and environmental toxicology. Polish J. Environ. Stud. 2005; 15(3): 375-382.
- Zambelli B., Uversky V.N., Ciurli, S. Nickel impact on human health: an intrinsic disorder perspective. Biochem. Biophy. Acta 2016; 1864(12):1714-1731.
CrossRef - Gimeno-Garcia E., Andreu V., Boluda, R. Heavy metals incidence in the application of inorganic fertilizers and pesticides to rice farming soils. Environ. Pollut. 1996; 92:19-25.
CrossRef - Zayed A.M., Terry, N. Chromium in the environment: factors affecting biological remediation. Plant Soil 2003; 249:139-156.
CrossRef - Wang Y., Xu W., Luo Y., Ma L., Li Y., Yang S., Huang K. Bioeffects of chromium (III) on the growth of Spirulina platensis and its biotransformation. J. Sci. Food Agric. 2009; 89(6):947-952.
CrossRef - Achmad R.T., Budiawan P., Auerkari E.I. Effects of chromium on human body. Ann. Res. Rev. Biol. 2017; 13(2):1-8.
CrossRef - Lee S.E., Lee J.U., Chon H.T., Lee, J.S. Microbiological reduction of hexavalent chromium by indigenous chromium-resistant bacteria in sand column experiments. Environ. Geochem. Health 2008; 30:141-145.
CrossRef - Hiatt, V., Huff, J.E. The environmental impact of cadmium: an overview. Int. J. Environ. Stud. 1975; 7:277-285.
CrossRef - Bernard, P. 2008. Cadmium and its adverse effects on human health review article. Ind. J. Med. Res. 128 : 557-64
- Rani, A., Kumar, A., Lal, A. and Pant, M. 2014. Cellular mechanisms of cadmium-induced toxicity: a review. Int. J. Environ. Health Res. 24(4) : 378-99
CrossRef - Morrow H. Release of Cd to the environment due to corrosion from anthropogenic sources. International Cadmium Association UNECE Workshop, Munich, Germany 2003; 12-14 May. Pp 1-28.
- Yu C., Linga Q., Yan S., Li J., Chend Z., Peng Z. Cadmium contamination in various environmental materials in an industrial area, Hangzhou, China. Chem. Spec. Bioavail. 2010; 2(1):35-42.
CrossRef - Nair I.V., Singh K., Arumugam M., Gangadhar K., Clarson, D. Trace metal quality of Meenachil River at Kottayam, Kerala (India) by principal component analysis. World J. Appl. Sci. 2010; 9(10):1100-1107.
- Flemming C.A., Trevors J.T. Copper toxicity and chemistry in the environment: a review. Water, Air Soil Pollut. 1989; 44:143-158.
CrossRef - Haque M.D., Subramanian V., Gibbs R.J. Copper, lead, and zinc pollution of soil environment. Critic. Rev. Environ. Contr. 1982; 12(1):13-68.
CrossRef - Cui Q. Tracing Copper from society to the aquatic environment Model development and case studies in Stockholm. Licentiate thesis, Industrial Ecology, Royal Institute of Technology School of Industrial Engineering and Management, Stockholm, Sweden. 2009; ISSN 1402-7615.
- Kumar R., Gupta A.K., Tripathi R.M., Chattree A. Monitoring heavy metals contamination in Yamuna river for its toxicity level in water, sediments and fish. J. Environ. Sci. Toxicol. Food Technol. 2013; 5(5):113-118.
CrossRef - Pinsino A., Matranga V., Roccheri M.R. Manganese: A new emerging contaminant in the environment. In: Environmental Contamination. Srivastava J. (Ed.) 2012; pp 17-36. ISBN 978-953-51-0120-8.
- Hermes N., Schneider R.C.S., Molin D.D., Adilson G.Z., Costa A.B., Corbellini V.A., Torres J.P.M., Malm, O. Environmental pathways and human exposure to manganese in southern Brazil. Ann. Brazilian Acad. Sci. 2013; 85(4):1275-1288.
CrossRef - Perl D.P., Olanow C.W. The neuropathology of manganese-induced parkinsonism. J. Neuropathol. Exp. Neurol. 2007; 66(8):675-682.
CrossRef - Ogwuegbu M.O.C., Muhanga W.. Investigation of lead concentration in the blood of people in the copper belt province of Zambia. J. Environ. Sci. 2005; 1:66–75.
- Zhang R., Wilson V.L., Hou A., Meng G. Source of lead pollution, its influence on public health and the countermeasures. Int. J. Health Animal Sci. Food Safety 2015; 2: 18-31.
- Zietz B.P., Lass J., Dunkelberg H., Suchenwirth R. Lead pollution of drinking water from corrosion of pipe materials. Gesundheitswesen 2009; 71(5):265-274.
CrossRef - Chatterjee S., Mukherjee A., Sarkar A., Roy P. Bioremediation of lead by lead-resistant microorganisms, isolated from industrial sample. Adv. Biosci. Biotechnol. 2012; 3:290-295.
CrossRef - Dong C.D., Chen C.F., Chen C.W. Contamination of Zinc in sediments at river mouths and channel in Northern Kaohsiung Harbor, Taiwan. Int. J. Environ. Sci Dev. 2012; 3(6):517-521.
CrossRef - Fosmire G.J. Zinc toxicity. Americ. J. Clinic. Nutr. 2001; 51(2):225-227.
CrossRef - Plum L.M., Rink L., Haase H. Review the essential toxin: Impact of zinc on human health. Int. J. Environ. Res. Pub. Health 2001; 7:1342-1365.
CrossRef - Kashyap R., Verma K.S., Chand H. Heavy metal contamination and their seasonal variations in Rewalsar lake of Himachal Pradesh. Ecoscan 2015; 9(1&2):31-36.
- Kapaj S., Peterson H., Liber K., Bhattacharya P. Human health effects from chronic arsenic poisoning. J. Environ. Sci. Health 2006; 41(10):2399-2328.
CrossRef - Jang Y.C., Somanna Y., Kim H. Source, distribution, toxicity and remediation of arsenic in the environment – a review. Int. J. Appl. Environ. Sci. 2016; 11:559-581.
- Liu Y., Zheng B.H., Fu Q., Meng W., Wang Y.Y. Risk assessment and management of arsenic in source water in China. J. Hazard. Mat. 2009; 170:729-734.
CrossRef - Karthikeyan S., Hirata S. Arsenic speciation in environmental samples. Anal. Lett. 2003; 36(11):2355-2366.
CrossRef - Welch A.H. Arsenic in groundwater. Kluwer, Dordrecht. Toxicol. Environ. Health 2003; 46(4):399-409.
- Mohan S.V., Nithila P., Reddy S.J. Estimation of heavy metal in drinking water and development of heavy metal pollution index. J. Environ. Sci. Health 1996; 31:283-289.
CrossRef - Kumar A., Denre M., Prasad R. Appraisal of quality of irrigation water around Khunti district of Jharkhand, India. J. Pharmacol. Phytochem. 2017; 6(6):442-447.
- Khan M.Y., Gani K.M., Chakrapani G.J. Spatial and temporal variations of physicochemical and heavy metal pollution in Ramganga river a tributary of river Ganges, India. Environ. Earth Sci. 2017; 76:231-242.
CrossRef - Bhattacharya A., Dey P., Gola D., Mishra A., Malik A., Patel N. Assessment of Yamuna and associated drains used for irrigation in rural and peri-urban settings of Delhi NCR. Environ. Monit. Assess. 2015; 187:4146-4159.
CrossRef - Bhattacharyay G., Sadhu A.K., Mazumdar A., Chaudhary P.K. Antennal deformities of chironomid larvae and their use in biomonitoring of heavy metal pollutants in the river Damodar of West Bengal, India. . Environ. Monit. Assess. 2005; 108:67-84.
CrossRef - Singh H., Pandey R., Singh S.K., Shukla D.N. Assessment of heavy metal contamination in the sediment of the River Ghaghara, a major tributary of the River Ganga in Northern India. Appl. Water Sci. 2017.; 7(7): 4133-4149.
CrossRef


