Quantitative Vulnerability Assessment: An Approach to Reduce Biases in Disaster Vulnerability Assessment
Shikha Karmokar1
, Md. Mintu Mohin1
, Molla Karimul Islam2
, Md. Rezaul Alam3
and Mohammad Mahfuzur Rahman1
*

1
Bangladesh Infrastructure Finance Fund Limited,
Dhaka,
1217
Bangladesh
2
Ministry of Public Administration,
Peoples Republic of Bangladesh,
Dhaka,
1000
Bangladesh
http://dx.doi.org/10.12944/CWE.14.3.07
The cyclone vulnerability of women is much higher than men due to their poverty, social norms and marginal position in the social structure. Reducing women’s vulnerability is, therefore, imperative to improve the situation. However, the present practices of vulnerability assessment have several limitations. As an alternative, this study proposed and tested a weighted framework to assess the vulnerability in a quantitative form. The proposed framework considers 18 indicators carefully adapted from vulnerability literature. The indicator statuses were defined based on their vulnerability potentials and assigned an integer value. The higher the status value the greater the vulnerability potentials. The indicator’s status values were standardized, and their weights were estimated. The vulnerability scores for every indicator thereafter estimated by multiplying its status value by its weight. Finally, an individual’s vulnerability score was calculated by taking the average vulnerability scores of all the indicators. The framework was tested on 140 randomly selected cyclone-affected women from ten coastal villages of Bangladesh. The proposed scores-based vulnerability expresses the vulnerability status with an integer value easier to understand and allows spatial comparability. This framework could be improved further preferably through stakeholder consultations about the appropriateness of the indicators, indicator statuses, and their weights. An improved and well-agreed framework would assist in integrative policy formulation to reduce women’s vulnerability to cyclone disaster. Moreover, this approach could be adopted in vulnerability ranking/mapping for other disasters.
Copy the following to cite this article:
Karmokar S, Mohin M. M, Islam M. K, Alam M. R, Rahman M. M. Quantitative Vulnerability Assessment: An Approach to Reduce Biases in Disaster Vulnerability Assessment. Curr World Environ 2019; 14(3).
DOI:http://dx.doi.org/10.12944/CWE.14.3.07Copy the following to cite this URL:
Karmokar S, Mohin M. M, Islam M. K, Alam M. R, Rahman M. M. Quantitative Vulnerability Assessment: An Approach to Reduce Biases in Disaster Vulnerability Assessment. Curr World Environ 2019; 14(3). Available from: https://bit.ly/2MoOkXc
Download article (pdf)
Citation Manager
Publish History

Introduction
Vulnerability is the condition that increases the susceptibility of an individual or community to the impact of any disaster. Bangladesh is considered as the most vulnerable country to natural disasters due to its geographical location, fragile economic strength, and high population density.1,2 Almost every year, the country experiences various natural disasters like cyclones, storm surges, coastal erosion, floods, landslides, and droughts.3 The geographical location and geomorphological conditions of Bangladesh have made the country susceptible to natural disaster.2,4-5 Although the country is very small, the vulnerability to a disaster varies spatially. The southern part of Bangladesh is most vulnerable to cyclonic disaster. About 46 million people live with high cyclone vulnerability in the coastal areas of Bangladesh. Statistical data suggests that about 78.31 percent of households of Barisal division (mostly coastal) had been affected by cyclone during 2009 and 2014.6 Once in every three years, a severe cyclone affects the coastal areas of Bangladesh7-8 and claimed thousands of lives, out of which more than half were women.9
The government of Bangladesh (GoB) along with non-governmental organizations (NGOs) and international development partners had initiated several measures to reduce the effect of cyclone damages. The initiatives range from improvement of the cyclone warning system, building cyclone shelters and coastal embankments, planting trees along the coastline (active windbreak) and organizing volunteer groups dedicated to cyclone warning dissemination and rescue operation.10 Literature reported the success of these activities in reducing cyclonic damage.10-15 A good number of articles also reported about the ineffectiveness of these activities during-disaster rescue operation, post-disaster relief operation, and long-term rehabilitation processes. Due to the top-down approach of the government, asymmetric prioritization, political interference in selecting relief recipients and building infrastructures like cyclone shelter, the benefits of disaster reduction measures are not equally accrued to all members of the societies.3,11,16-18
Several literature2,18-22 documented that cyclone damages are gender-differentiated as women are more vulnerable during a cyclone as compared to men due to several physical, social, economic and environmental factors. For example, the 1991 cyclone in Bangladesh killed 138,000 people, many of whom were women older than 40 years.18 The women’s vulnerabilities are many times different from men due to socially constructed gender roles and power relations.22 Since women comprised almost half of the population of Bangladesh, it is necessary to understand their degree of vulnerability and the factors that influence their vulnerabilities.
Many studies have been conducted on cyclone vulnerability across the globe covering economic status,23-25 housing condition and settlement pattern,26 alternative livelihood options26 and few other factors to determine the degree of vulnerabilities. Few studies16,27 have linked disaster vulnerability with climatic changes. Numerous studies5,13,28-31 have investigated the underlying factors of cyclonic vulnerability. Additionally, some studies3,16 have focused on community responses and mitigation measures.26,28 A good number of studies2,17,32-34 used satellite images and modeling tools to identify disaster hotspot areas. Likewise, several studies26,35 adopted vulnerability indices to explain the degree of spatial vulnerability. Although those studies were on cyclones, community and regional vulnerability mitigation measures, gender or community-specific identification of vulnerable groups is very limited.
Available vulnerability literature followed diversified methods and indicators for vulnerability assessment with a limited scope of up-scaling. Moreover, most of these literature lacks integrated approach and often consider only a few important indicators. These processes of vulnerability assessment could produce biased outcomes due to the assessor’s sectoral or objective biases and not considering the interrelationship between/among the vulnerability indicators. For example, a woman from an area with poor economic and housing conditions could be considered as highly vulnerable to a cyclonic disaster by the traditional assessment. However, in case a woman lives nearer to a cyclone shelter; the vulnerability scores might be less due to the proximity factor. In contrast, a woman with stronger economic strength and improved housing could become vulnerable against a cyclone if she lives away from a market, medical facility36 or a cyclone shelter in case of storm surge.26,28 These factors are poorly addressed in the available vulnerability assessment methods. Moreover, there are certain factors, particularly related to women, like the physical condition,36-38 age,18 education level for building personal and group awareness and capability to understand the forecast,39-40 age of the children during the disaster, access to emergency facility, status of her parents (a wealthy or active parent could be in help in case of emergency or disaster recovery), roles (caregivers to elderly family member who are unable to move to safer place) in the family,40 social norms (women wear Sharees- a traditional dress that hinders movement while trying to swim in tidal waves) could act as the key determinants of cyclonic vulnerability.41-43 Furthermore, several other factors that negatively affect the disaster recovery of women headed family. An increase in the number of female-headed households because of male outmigration also increases women’s responsibilities and vulnerabilities during natural disasters. After a disaster, there are commonly inadequate facilities for women to meet their household needs or to find shelter. The disaster mitigation approach covers women’s reproductive health needs inadequately, in turn, women’s health suffers disproportionately.
On the other hand, the vulnerability status of an individual or area is often expressed in qualitative form i.e. highly vulnerable, medium vulnerable, etc.,37,44-45 which limits the possibility of vulnerability ranking among the individuals or regions. Ranking vulnerable people is highly essential under the resource-constrained situation. GoB, NGOs, donor agencies, corporate houses as well as the voluntary groups offer donations/relief after any disaster. Vulnerable people are often supported by regular social safety program i.e. Vulnerable Group Feeding (VGF) program in Bangladesh as a part of the long-term rehabilitation process. In most cases, VGF or relief recipients are not selected in a systematic process which is often criticized for personal or political influences. A systematic pre-defined/assessed ranking of vulnerable people could solve many of these issues in setting or selecting aid recipients. Few studies26,35,39 adopted index-based ranking of coastal administrative units and thus characterized certain areas based on the degree of vulnerability. However, identifying the most vulnerable or least vulnerable areas does not necessarily solve the entire problem. Still, we need to identify the extreme to least vulnerable people for setting a priority or systematic plan what can be considered as one step ahead. Moreover, the outcomes of these studies are not widely applicable, better suitable for a region and hardly comparable to another area. The indicators could have spatially varying importance and magnitude to the overall vulnerability. At the same time, importance and magnitudes could have spatial variations. As a result, vulnerability estimation for one region is hardly comparable with that of others. Therefore, it is essential to standardize the vulnerability outcomes so that a degree of vulnerability conveys the same meaning throughout the region or country.
To overcome these limitations, this study proposes and testifies a composite framework to determine the overall vulnerability of women. The proposed score-based vulnerability assessment has several advantages over traditional vulnerability studies. Firstly, it includes not only traditional vulnerability indicators but also incorporates gender-specific indicators with varying weight on the overall vulnerability score. Secondly, it expresses the vulnerability score with an integer value that is easy to understand, allows wide spatial comparability and enables ranking among the vulnerable communities. Thirdly, the incorporation of area-specific information and standardization empowers spatial comparisons among the vulnerable communities from different regions. Individuals with a certain degree of vulnerability will convey the same meaning irrespective of region, which allows ranking the regions based on the vulnerability of the residents.
Study Area
This study has tested the proposed vulnerability framework on 140 randomly selected cyclone-affected women from ten villages of four coastal districts of Bangladesh (Patuakhali, Bagerhat, Khulna, and Satkhira) where Fig. 1 shows the locations of the study. The socio-demographic features of the studied villages are provided in Table 1.
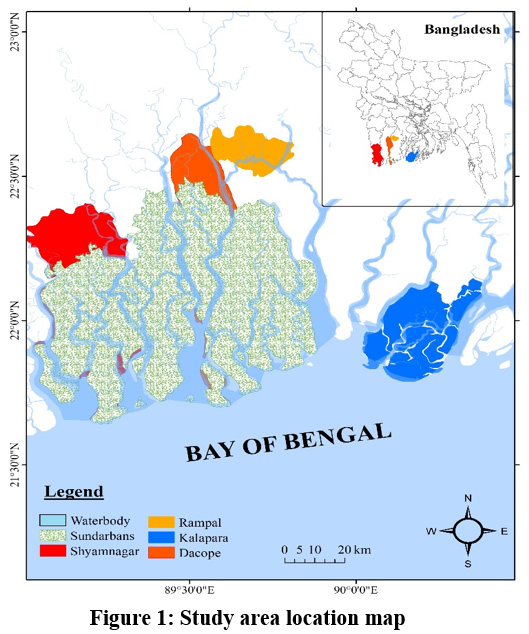 |
Figure 1: Study area location map Click here to view Figure |
Table 1: Socio-demographic features of the studied villages.
|
District |
Satkhira |
Khulna |
Bagerhat |
Patuakhali |
|
Upazila |
Shyamnagar |
Dacope |
Rampal |
Kalapara |
|
Village (s) studied |
Datinakhali, Burigoalini, Chokbara |
Pankhali, Hoglabone, Katabonia |
Hurka |
Kachimkhali Newapara Nishanbaria |
|
Area (km2)6 |
1968.23 |
991.56 |
335.45 |
491.89 |
|
Population(million) 6 |
0.32 |
0.15 |
0.16 |
0.24 |
|
Male/Female ratio6 |
93 |
100 |
112 |
103 |
|
Number of total household (thousand) in the upazila 6 |
72.28 |
36.60 |
38.17 |
57.53 |
|
Number of studied household (this study) |
45 |
30 |
30 |
35 |
|
Major land use |
Agriculture |
Agriculture |
Agriculture |
Agriculture |
|
Average household size (person/household) 6 |
4.39 |
4.13 |
4.04 |
4.10 |
|
Average household income (USD/year) 6 |
2218.75 |
2739.22 |
1722.38 |
2073.64 |
|
Overall literacy rate (%)6 |
49 |
56 |
58 |
52 |
|
Female literacy rate (%)6 |
17.4 |
39.8 |
56.4 |
51.5 |
|
Number of cyclone shelters |
8 |
15 |
9 |
116 |
|
Number of hospitals and clinics6 |
22 |
11 |
10 |
10 |
|
Number of market/bazars |
45 |
13 |
23 |
27 |
|
Distance from the sea (km) |
83 |
60 |
75 |
20 |
|
Mean elevation (m) |
5 |
5 |
7 |
6 |
|
% of total area protected by coastal embankment 46 |
45.0 |
65.0 |
10.43 |
70.34 |
|
Economic loss due to cyclone during 2009 and 2014 (in million USD) 6 |
37.74 |
26.01 |
26.63 |
20.93 |
|
Lives lost due to cyclone during 2009 and 2014 (person) 6 |
59 |
7 |
3 |
97 |
Methodology
Vulnerability Indicators and Indicator Status
Eighteen indicators that represent adaptive capacity, susceptibility and exposure were considered to define an individual’s vulnerability. The degree of vulnerability was determined based on the statuses of vulnerability indicators. The status of any indicator was assigned an integer value or vulnerability score based on the vulnerability potentials. Indicator status values range from one to five, where one indicates lesser vulnerability potentials and five specifies greater vulnerability potentials. The vulnerability indicators and their status considered in this study are explained in Table 2.
Data Collection
Data were collected from 10 villages located in four coastal upazilas (administrative units) of the southwest region of Bangladesh. The studied villages were purposively selected based on the geographic locations, socio-environmental conditions, and the vulnerability factors explained in the available literature. The villages of Shyamnagar and Dacope Upazila are sheltered by the mighty Sundarbans, relatively away from the coast and are characterized by high saline aquaculture dominated land-use zones. On the contrary, the villages of Kalapara Upazila are located relatively nearer to the coast, no forest barrier in-between sea and the villages and are characterized by less saline agriculture dominated land-use zones. The only village from the Rampal Upazila represents moderate characteristics of the other villages. A total of 140 married women were interviewed with a pre-tested structured questionnaire. The number of women studied from the respective villages was selected without following any statistical procedures. However, a systematic random sampling procedure was adopted while selecting the studied household within any village. The data collection was done between July 2016 and December 2018. The sample distribution and socio-demographic features of studied villages have been presented in Table 1.
Table 2: Vulnerability indicators, indicator status and corresponding indicator value.
|
Factor |
Indicator |
Explanation |
Indicator status |
Corresponding status value |
|
Adaptive capacity |
Household income (USD/year)47 |
People with high household income is more likely to avoid/cope up against any natural disaster. Rich people usually holds good houses that resists any damage or even if damaged recovers quickly/easily. |
>3000 |
1 |
|
2400-3000 |
2 |
|||
|
1200-2400 |
3 |
|||
|
600-1200 |
4 |
|||
|
<600 |
5 |
|||
|
Sources of household income48 |
People with secure sources of income is less vulnerable (i.e. service). Aquaculture and agriculture are more susceptible to damage during cyclones. During and after the disaster the demand and payment of day labor increases, and thus assumed higher chances of damage recovery after the disaster. |
Service/Remittance |
1 |
|
|
Business |
2 |
|||
|
Day labor |
3 |
|||
|
Agriculture |
4 |
|||
|
Aquaculture |
5 |
|||
|
Education36,49 |
People with higher level of education are less vulnerable as they could understand the forecast and prepare in advance in a better way as compared those of lesser educated. |
College and above |
1 |
|
|
Up to high school |
2 |
|||
|
Illiterate |
3 |
|||
|
Family size (person/household)50 |
Larger family usually has poor economic strength, often difficult to evacuate and higher chances of damage. |
< 5 |
1 |
|
|
5-8 |
2 |
|||
|
> 8 |
3 |
|||
|
Asset ownership (worth value in USD)51-52 |
Ownership of liquid or fixed asset increases the chances/capacity to recovery. |
>10000 |
1 |
|
|
5000 – 10000 |
2 |
|||
|
2000-5000 |
3 |
|||
|
<2000 |
4 |
|||
|
No asset |
5 |
|||
|
Duration of household head’s absence at home per year |
A male household head could respond to a disaster more rapidly and safer manner. The longer absence of male household head, the poorer the household’s ability to cope up/recovery against a disaster. |
N/A |
1 |
|
|
1-2 Month |
2 |
|||
|
3-5 Month |
3 |
|||
|
>5 Month |
4 |
|||
|
Marital status53 |
Divorced and widow are more vulnerable than married women are. |
Married |
1 |
|
|
Divorced |
2 |
|||
|
Widow |
3 |
|||
|
Means of transport on the way to nearest medical facility or market36 |
A person living at hard to reach area would face difficulty to get medical care or essential groceries after the disaster. |
Motorized private vehicle |
1 |
|
|
Motorized public/hired vehicle |
2 |
|||
|
Non-motorized private vehicle |
3 |
|||
|
Non-motorized hired vehicle |
4 |
|||
|
On foot |
5 |
|||
|
Susceptibility |
Age49,54 |
Physical age often determines the coping capacity. Older aged women are more susceptible to cyclonic affect. |
<25 year |
1 |
|
25-40 year |
2 |
|||
|
40-55 year |
3 |
|||
|
>55 year |
4 |
|||
|
Health status36,38,49 |
Disabled person is more likely to vulnerable than healthy person is. |
Healthy |
1 |
|
|
Partly disabled |
2 |
|||
|
Disabled |
3 |
|||
|
Exposure |
Housing condition26,49 |
A good stable house reduces the cyclone vulnerability. |
Concrete roof |
1 |
|
Aluminum sheet/tin roof |
2 |
|||
|
Local tiles/thatching roof |
3 |
|||
|
Distance to the safe drinking water source4 |
Due to the salinity problems, in coastal areas safe drinking water sources are scarce. Therefore, easy accessibility reduces the vulnerability. |
< 100 m |
1 |
|
|
100-300 m |
2 |
|||
|
300-500 m |
3 |
|||
|
>500 m |
4 |
|||
|
Access to cyclone forecast26 |
Ownership of communication devices increases the chance of access to cyclone forecast. |
TV+Radio+Mobile+Internet |
1 |
|
|
TV+Mobile |
2 |
|||
|
Only Mobile or Radio |
3 |
|||
|
N/A |
4 |
|||
|
Status of the nearest cyclone shelter26,28 |
A poor condition or non-accommodative cyclone shelter demotivates the people to move there. |
Accommodative |
1 |
|
|
Non-accommodative |
2 |
|||
|
Distance from the nearest cyclone shelter26,28,55 |
People who live nearer to a cyclone shelter are more likely to move there during a cyclonic disaster due to the convenience. |
<0.5 km |
1 |
|
|
0.5-2 km |
2 |
|||
|
2-4 km |
3 |
|||
|
4-6 km |
4 |
|||
|
>6 km |
5 |
|||
|
Distance from the nearest healthcare facility38 |
Wider distance from the healthcare facility reduces the chances of treatment once wounded by a cyclone. |
<2 km |
1 |
|
|
2-4 km |
2 |
|||
|
>5 km |
3 |
|||
|
Aerial distance from the sea56 |
Areas nearer to the seas is more exposed to cyclone and storm surge. |
> 80 km |
1 |
|
|
50-80 km |
2 |
|||
|
20-50 km |
3 |
|||
|
<20 km |
4 |
|||
|
Presence of natural wind breaks between the sea and the respondent’s house57 |
Presence of natural windbreaks like forest potentially could absorb the shock and reduces the causalities. |
Dense forest (>50 km) |
1 |
A total of seven Focus Group Discussions (FGD) were conducted to validate the outcomes of vulnerability scores. Two FGDs were conducted in Dacope, Shyamnagar and Kalapara Upazilas while only FGD was conducted in Rampal. A total of 123 people ranged from farmers (56), traders (27), housewives (14), teachers (9), community representatives (7), community health workers (6) and NGO workers (4) were present during the FGDs. FGDS were conducted between October 2018 and April 2019.
Normalization of Indicator Values
As shown in Table 2, the vulnerability indicators have varying status (different units and scales) and corresponding values, it is necessary to normalize the values. The indicator values were normalized following UNDP58 (Eq. 1). The normalized indicator values for all 18 indicators lie between 0 and 1. The value 1 corresponds to that maximum vulnerability potential and 0 corresponds to minimum vulnerability potential.

Indicators’ Weight Estimation
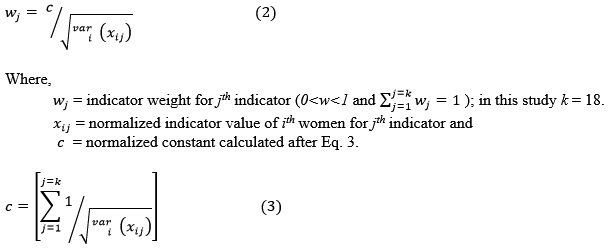
Since all the vulnerability indicators do not hold equal weight to the overall vulnerability, the weights of every indicator were estimated after Iyengar and Sudarshan.59 The weights of vulnerability indicators were estimated through Eq. 2 using the household survey outcomes. The indicator weights range between 0 and 1. The value 0 indicates no weight, while 1 corresponds maximum weight.
Calculation of Weighted Vulnerability Score
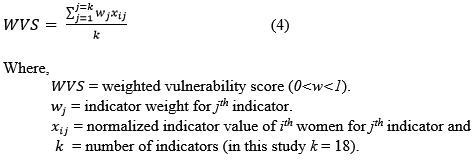
The weighted vulnerability score (WVS) score for every woman was finally calculated after Eq. 4. The WVS lies between 0 and 1. The value 1 corresponds to that of maximum vulnerability and 0 corresponds to minimum vulnerability.
Vulnerability Classes
The estimated WVSs were classified based on Table. 3.
Table 3: Vulnerability classes
|
Vulnerability class |
WVS range |
|
Extremely vulnerable |
>0.70 |
|
Vulnerable |
0.50- 0.70 |
|
Moderately vulnerable |
0.30-0.50 |
|
Minimal or non-vulnerable |
<0.30 |
Statistical Analysis and Data Processing
Principal component analysis (PCA) and orthogonal rotation (varimax rotation with Kaiser normalization) were applied to facilitate understanding contribution of vulnerability indicators in vulnerability scores. Kaiser-Meyer-Olkin measure of sampling adequacy and Bartlett’s test of sphericity was conducted to assess the suitability of factor analysis. Eigenvalues > 1.0 and the scree test was the basis for component extraction. The analysis was performed with the aid of IBM SPSS Statistics 16 (IBM Corp., Armonk, NY, USA).
Results and Discussions
Vulnerability Indicators and Indicator Status
The estimated weight of the vulnerability indicators and indicator status frequencies are presented in Table 4. Status of cyclone shelter receives the highest weight (0.0982), while the distance to the safe drinking water registered as the least weight (0.0024). Most household income in Rampal, Dacope, and Shyamnagar comes from working as the day labor. On the other hand, in Kalapara, farming (agriculture) provides the main household income. The mean age of the studied women is 40.3 years (STDEV ±13.9). The studied women from Shyamnagar are relatively younger (mean 38.2 years) and the eldest are from Kalapara (mean 43.4 years). The family size of the studied women does not vary much with a mean value of 4.6 with a standard deviation of ±0.6. The mean household income of the studied women was estimated at US$ 2176/year (STDEV ± 1241). The dataset suggests that the household of Dacope earns the highest, while Rampal earns the lowest. The mean distance from the nearest medical facility and the cyclone shelter is 2.8 (STDEV ± 1.1) and 1.3 (STDEV ± 0.6) kilometer respectively.
Correlation Among the Vulnerability Indicators
The correlation matrix among seven vulnerability indicators is provided in Table 5. Analysis reveals that household income has statistically significant positive correlations with schooling year (P < 0.0001) as shown in Blanden and Gregg60 and the distance from the cyclone shelter (P < 0.001).
Table 4: Vulnerability indicator weights and the frequencies of indicator status.
|
Sl. N. |
Indicator |
Indicator status |
Indicator weight (wj) |
Frequency |
|||
|
R |
D |
S |
K |
||||
|
1 |
Household income |
>3000 |
0.0617 |
0 |
0 |
0 |
3 |
|
2400-3000 |
1 |
2 |
4 |
6 |
|||
|
1200-2400 |
19 |
9 |
20 |
8 |
|||
|
600-1200 |
7 |
12 |
18 |
11 |
|||
|
<600 |
3 |
7 |
3 |
7 |
|||
|
2 |
Sources of household income |
Service/Remittance |
0.0648 |
3 |
1 |
0 |
3 |
|
Business |
6 |
5 |
8 |
7 |
|||
|
Day labor |
10 |
18 |
24 |
6 |
|||
|
Agriculture |
4 |
6 |
11 |
17 |
|||
|
Aquaculture |
7 |
0 |
2 |
2 |
|||
|
3 |
Education |
College and above |
0.0786 |
4 |
5 |
0 |
5 |
|
Up to high school |
13 |
17 |
29 |
11 |
|||
|
Illiterate |
13 |
8 |
16 |
19 |
|||
|
4 |
Family size |
< 5 |
0.0658 |
18 |
8 |
14 |
8 |
|
8-May |
11 |
20 |
26 |
21 |
|||
|
> 8 |
1 |
2 |
5 |
6 |
|||
|
5 |
Asset ownership (worth value in USD) |
>10000 |
0.0512 |
0 |
0 |
0 |
4 |
|
5000 – 10000 |
2 |
4 |
11 |
6 |
|||
|
2000-5000 |
12 |
6 |
21 |
4 |
|||
|
<2000 |
15 |
17 |
6 |
12 |
|||
|
N/A |
1 |
3 |
7 |
9 |
|||
|
6 |
Duration of household head’s absence at home per year |
N/A |
0.0532 |
19 |
23 |
33 |
18 |
|
1-2 Month |
3 |
4 |
10 |
5 |
|||
|
3-5 Month |
5 |
2 |
2 |
3 |
|||
|
>5 Month |
3 |
1 |
0 |
9 |
|||
|
7 |
Marital status |
Married |
0.0392 |
25 |
23 |
40 |
31 |
|
Divorced |
0 |
0 |
0 |
0 |
|||
|
Widow |
5 |
7 |
5 |
4 |
|||
|
8 |
Means of transport on the way to nearest medical facility or market |
Motorized private vehicle |
0.0583 |
3 |
1 |
0 |
8 |
|
Motorized public/hired vehicle |
18 |
19 |
36 |
13 |
|||
|
Non-motorized private vehicle |
2 |
8 |
1 |
2 |
|||
|
Non-motorized hired vehicle |
7 |
2 |
8 |
10 |
|||
|
On foot |
0 |
0 |
0 |
2 |
|||
|
9 |
Age |
<25 year |
0.0399 |
0 |
2 |
3 |
4 |
|
25-40 year |
|
12 |
16 |
18 |
23 |
||
|
40-55 year |
|
12 |
8 |
20 |
6 |
||
|
>55 year |
|
6 |
4 |
4 |
2 |
||
|
10 |
Health status |
Healthy |
0.0495 |
25 |
18 |
26 |
31 |
|
Partly disabled |
5 |
9 |
13 |
4 |
|||
|
Disabled |
0 |
3 |
6 |
0 |
|||
|
11 |
Housing condition |
Concrete roof |
0.0464 |
1 |
2 |
1 |
6 |
|
Aluminum sheet/tin roof |
5 |
15 |
17 |
18 |
|||
|
Local tiles/thatching roof |
24 |
13 |
27 |
11 |
|||
|
12 |
Distance to the safe drinking water source |
< 100 m |
0.0024 |
0 |
9 |
2 |
19 |
|
100-300 m |
2 |
4 |
1 |
13 |
|||
|
300-500 m |
6 |
6 |
9 |
3 |
|||
|
>500 m |
22 |
11 |
33 |
0 |
|||
|
13 |
Access to cyclone forecast |
TV + Radio + Mobile + Internet |
0.0485 |
0 |
0 |
0 |
2 |
|
TV+Mobile |
3 |
4 |
1 |
8 |
|||
|
Only Mobile or Radio |
22 |
24 |
36 |
16 |
|||
|
N/A |
5 |
2 |
8 |
9 |
|||
|
14 |
Status of the nearest cyclone shelter |
Accommodative |
0.0982 |
23 |
21 |
18 |
3 |
|
Non-accommodative |
17 |
9 |
12 |
32 |
|||
|
15 |
Distance from the nearest cyclone shelter |
<0.5 km |
0.0533 |
13 |
8 |
15 |
10 |
|
0.5-2 km |
14 |
21 |
25 |
12 |
|||
|
2-4 km |
1 |
1 |
5 |
5 |
|||
|
4-6 km |
2 |
0 |
0 |
1 |
|||
|
>6 km |
0 |
0 |
0 |
2 |
|||
|
16 |
Distance from the nearest healthcare facility |
<2 km |
0.0515 |
5 |
10 |
15 |
12 |
|
2-4 km |
24 |
18 |
26 |
16 |
|||
|
>5 km |
1 |
2 |
4 |
7 |
|||
|
17 |
Aerial distance from the sea |
> 80 km |
0.0496 |
30 |
0 |
0 |
0 |
|
50-80 km |
0 |
30 |
45 |
0 |
|||
|
20-50 km |
0 |
0 |
0 |
0 |
|||
|
<20 km |
0 |
0 |
0 |
35 |
|||
|
18 |
Presence of natural wind breaks between the sea and the respondent’s house |
Dense forest ( >50 km) |
0.0405 |
0 |
0 |
45 |
0 |
|
Dense forest (10-50 km) |
30 |
30 |
0 |
0 |
|||
|
Forest/plantation (<10 km) |
0 |
0 |
0 |
0 |
|||
|
Absent |
0 |
0 |
0 |
35 |
|||
Educated people earn better, more aware and conscious about the risk of cyclone induced disaster and consider moving to a shelter even located in a longer distance. In contrast, household income displays a significant (P < 0.01) negative correlation with the family size.61 Usually, the poorer have more children and have larger family size, and thus displays negative correlations between the family size and the schooling years (P < 0.05). The lower the education level, the larger the family size, the lesser the household income.
Table 5: Correlation matrix of vulnerability indicators.
|
Family Size |
Distance to the nearest hospital |
Distance from cyclone shelter |
Distance from the safe drinking water source |
Age |
Household Income |
Schooling Year |
|
1 |
0.06 |
0.19* |
0.25** |
-0.09 |
-0.25** |
-0.20* |
|
0.06 |
1 |
0.03 |
0.32*** |
-0.11 |
-0.04 |
0.06 |
|
0.19* |
0.03 |
1 |
-0.28** |
0.02 |
0.33*** |
0.28** |
|
0.25** |
0.32*** |
-0.28** |
1 |
-0.11 |
-0.05 |
-0.05 |
|
-0.09 |
-0.11 |
0.02 |
-0.11 |
1 |
0.12 |
0.07 |
|
-0.25** |
-0.04 |
0.33*** |
-0.05 |
0.12 |
1 |
0.39**** |
|
-0.20* |
0.06 |
0.28** |
-0.05 |
0.07 |
0.39**** |
1 |
*** Significant at 0.01%; *** Significant at 0.1%; ** Significant at 1%; * Significant at 5%; t-test; n = 140
Vulnerability Scores
The estimated mean vulnerability score is 0.41 (STDEV ± 0.09). The mean vulnerability score is highest in Kalapara (0.47) and the lowest in Dacope (0.37). The vulnerability classes are presented in Fig. 2. The studied Upazilas can be ordered as Kalapara > Shyamnagar > Rampal > Dacope based on the mean vulnerability score. This overall vulnerability order showed high consistencies with earlier cyclone (2009 and 2014) damages to these areas in terms of lives lost (Table 1). However, the order differs in-terms of total economic loss due to the same cyclones (Table 1). This study only considers individual vulnerability and does not account for social or physical damages. Therefore, it agrees with the individual loss (death) strongly. Out of 140 studied women, only one woman from Kalapara falls under ‘extremely vulnerable’ class (WVS> 0.7). Besides, Kalapara accommodated the maximum women (50%) of the ‘vulnerable’ class (0.49 0.71). On the other side, Shyamnagar represents the maximum number (50%) of women of ‘minimal or non-vulnerable’ class (WVS<0.3). Most women (78%) from all the Upazilas fall under the ‘moderately vulnerable’ class (0.29 0.5). The high vulnerability scores of the women from the Kalapara Upazila mainly dictated by two factors: proximity to the sea and absence of the windbreak (i.e. forest).
WVS validation through FGDs confirmed the representativeness of the WVS. Moreover, FGDs provide important insights into the existing VGF cards or emergency relief programs. FGD participants were univocally reported (n = 103, 84%) the nepotism and corruption while priority listing by local administration. Majority of the respondents reported that cyclone recovery aid programs have serious equality problems in both GoB (n = 123, 100%) and NGO (n = 76, 62%) efforts. More than 93 % (n = 115) of the respondents argued that aids are not reaching hard to reach areas due to the problems in management and non-awareness of the affected people. This suggests that government efforts are not necessarily reaching the actual vulnerable communities. FGD participants agreed that assessment-based ranking could potentially improve the situation (n = 117, 95%).
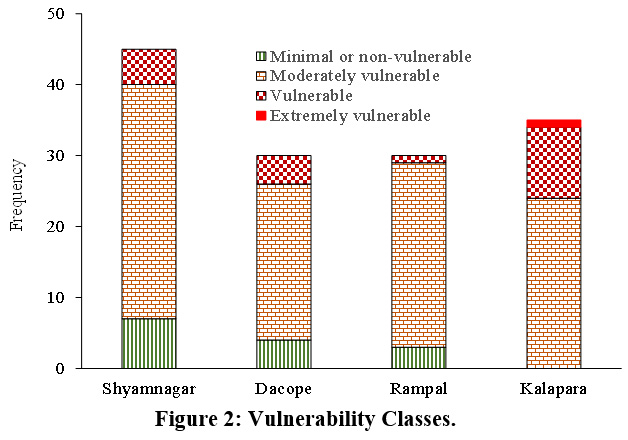 |
Figure 2: Vulnerability Classes. Click here to view Figure |
Factors of Vulnerability
The relationship between the vulnerability scores and the vulnerability indicators shown in Fig. 3. Vulnerability scores show inverse relationships with household incomes and the level of education. It is intuitive that the level of education has impact on understanding the disaster forecast and disaster preparedness efforts. Vulnerability reduction with the level of education is consistent with several literatures that focus on other types of disaster outcomes. For example, Samir62 reported that communities with higher levels of education in Nepal experience lesser damage to floods and landslides. Similarly, highly educated peoples recorded better post-tsunami recovery in Indonesia63 and Japan64 and earthquake damage in Thailand65. Apart from disaster understanding and preparedness, educated people earn better and thus have the strong economic strength to cope up with. In contrast, vulnerability scores disclose positive association with the family size and the distance from the cyclone shelter, sources of safe drinking water and medical facilities. Family size has a negative correlation with the household income and schooling year (Table 5). This could be understood in many complex social cause-effect relationships. For instance (i) larger family size à less health care, nutrition uptake à less success in education à less awareness à higher vulnerability; (ii) highly vulnerable community à takes more children (absence of birth control or expecting more support in earning livelihoods) à less education (inadequate facility, hard to reach, unawareness) à less awareness, knowledge à higher vulnerability. In a similar study, Ahsan35 assessed the area-specific vulnerability (union; an administrative unit) for the neighboring Koyra Upazila (an administrative unit) and reported that vulnerable areas have poorer educational infrastructure and lesser literacy rates.
Principal Component Analysis (PCA)
PCA analysis reveals that six components accounted for 63.77% of the observed variance. This suggests that the vulnerability model could be reduced to a six-component model. Additionally, PCA indicates that 11 out of 18 indicators have a strong association with the first principal component. Among the indicators, proximity to the sea, family size, household asset, household income, the presence of windbreaks (forest), and the age of the female resident of the coastal areas are the key determinants of vulnerability.
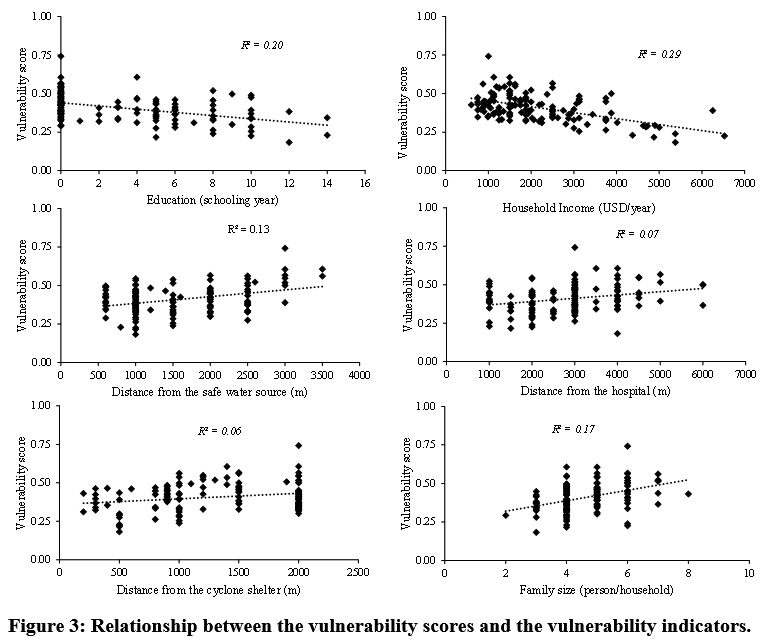 |
Figure 3: Relationship between the vulnerability scores and the vulnerability indicators. Click here to view Figure |
Conclusions
This study explores and proposes a framework for quantitative disaster vulnerability assessment at an individual scale. The framework was applied to assess the cyclonic vulnerability and rank the coastal women of Bangladesh. Eighteen indicators were chosen, defined and given probable status. Thereafter, field data were collected from randomly selected 140 women distributed over four coastal upazilas. Collected information was normalized, and the weights of the indicators were estimated to produce a numerical vulnerability score for studied individuals.
The background assumptions behind this WVS estimation indicates that the responses obtained from the household interview were fair and unbiased. Since we do not have any such ranking of vulnerable communities, the study outcomes could not be verified against any real listing. The results were validated only during the FGDs and found impressive consistencies. The sample size was also not determined statistically. The objectives of this study were to develop a framework and provide a message to the policymakers to confirm the equitable distribution of VGF or post-disaster relief efforts. The present WVS might not be robust and would differ from future studies as it considers the minimum and maximum values to normalize the household responses. Additionally, this study agrees that the indicators, indicator’s status, and the scores are not out of controversies due to its oversimplification of complex scenarios. However, this study considers that this approach of quantitative assessment and ranking could be followed to develop an agreed and comprehensive one considering its advantages over the prevailing practices.This weighted vulnerability score has several advantages, such as, easy to understand and allows wide spatial comparability. It includes important social, natural and governance connected factors of vulnerability with their relative weights. The resultant vulnerability scores from different regions could convey equal meaning as it minimizes the region-specific factors of vulnerability through normalization. Additionally, it permits the administration to rank among the vulnerable people which could facilitate equitable distribution of disaster relief and reduce the chances of corruption and illegal political interference. Moreover, this framework permits us to identify the key or highly sensitive factors of vulnerability for an area. Finally, it provides additional insights for the policymakers to fight against natural disasters by understanding the spatial distribution of vulnerable groups. The effectiveness of this framework could be further tested by piloting and creating a database for a few villages. It could be validated against the traditional relief efforts during and after any future disaster, update (if necessary) and upscale (if possible).
Acknowledgment
The authors acknowledge the contributions and efforts of all the participants of focused group discussions. The authors wish to thank Mr. Zakir Hossain and Mr. Ashraful Hoque from Kachimkhali, Kalapara during the field data collection. We also thank the two anonymous reviewers for their valuable comments and suggestions to improve this article.
Funding information
The author(s) received no financial support for the research, authorship, and/or publication of this article.
Conflict of Interest
The authors do not have any conflict of interest.
References
- Ali A. Climate change impacts and adaptation assessment in Bangladesh. Clim. Res. 1999;12(3): 109-116. doi: 10.3354/cr012109.
CrossRef - Karim M, Mimura N. Impacts of climate change and sea-level rise on cyclonic storm surge floods in Bangladesh. Global Environ. Chang. 2008; 18(3):490-500. doi: 10.1016/j.gloenvcha.2008.05.00
CrossRef - Paul S. K, Routray J. K. Household response to cyclone and induced surge in coastal Bangladesh: Coping strategies and explanatory variables. Nat. Hazards. 2011; 57(2):477-499. doi: 10.1007/s11069-010-9631-5.
CrossRef - Alam G. M. M, Alam K, Mushtaq S, Clarke M. L. Vulnerability to climatic change in riparian char and river-bank households in Bangladesh: Implication for policy, livelihoods and social development. Ecol. Indic. 2017; 72:23-32. doi: 10.1016/j.ecolind.2016.06.045.
CrossRef - Mallick B, Ahmed B, Vogt, J. Living with the Risks of Cyclone Disasters in the South-Western Coastal Region of Bangladesh. Environments. 2017; 4(1):1-17. doi: 10.3390/environments4010013.
CrossRef - BBS. Bangladesh disaster-related statistics 2015: climate change and natural disaster perspectives. Dhaka: Bangladesh Bureau of Statistics; 2015.
- DDM. Summary of Cyclonic Storm ‘AILA’. Dhaka: Department of Disaster Management; 2009.
- Dasgupta S, Huq M, Khan Z. H, Ahmed M. M. Z, Mukherjee N, Khan M. F, Pandey K. Cyclones in a changing climate: the case of Bangladesh, Clim. Dev. 2014; 6(2):96-110. doi: 10.1080/17565529.2013.868335.
CrossRef - GoB. Cyclone Sidr in Bangladesh: Damage, Loss, and Needs Assessment for Disaster Recovery and Reconstruction. Dhaka: Government of Bangladesh; 2008.
- CPP. (2018) Cyclone Preparedness Programme. Dhaka: Government of Bangladesh; 2018 Available at: http://www.cpp.gov.bd/Home (Accessed: 27 March 2018).
- Hossain M. N, Paul S. K. Vulnerability Factors and Effectiveness of Disaster Mitigation Measures in the Bangladesh Coast. Earth Syst. Environ. 2018; 2(1):55-65. doi: https://doi.org/10.1007/s41748-018-0034-1.
CrossRef - Alam E, Collins A. E. Cyclone disaster vulnerability and response experiences in coastal Bangladesh. Disasters, 2010; 34(4):931-954. doi:10.1111/j.1467- 7717.2010.01176.x.
CrossRef - Paul B. K. Why relatively fewer people died? The case of Bangladesh’s Cyclone Sidr. Nat. Hazards. 2009; 50(2):289-304. doi: https://doi.org/10.1007/s11069-008-9340-5.
CrossRef - Adger W. N, Hughes T. P, Folke C, Carpenter S. R, Rockstro¨m, J. Social-Ecological Resilience to Coastal Disasters. Science. 2005; 309(5737):1036-1039. doi: 10.1126/science.1112122.
CrossRef - Haque C. E. Perspectives of Natural Disasters in East and South Asia, and the Pacific Island States: Socio-economic Correlates and Needs Assessment. Nat. Hazards. 2003; 29(3):465-483.
https://doi.org/10.1023/A:1024765608135
CrossRef - Islam R, Walkerden G, Amati M. Households’ experience of local government during recovery from cyclones in coastal Bangladesh: resilience, equity, and corruption. Nat. Hazards. 2017; 85(1):361-378. doi: 10.1007/s11069-016-2568-6.
CrossRef - Hoque M. A. A, Phinn S, Roelfsema C, Childs I. Tropical cyclone disaster management using remote sensing and spatial analysis: A review. Int. J. Disast. Risk Re. 2017; 22:345–354. doi: https://doi.org/10.1016/j.ijdrr.2002.008.
CrossRef - Cannon T. Gender and climate hazards in Bangladesh. Gend. Dev. 2002; 10(2):45-50. doi: 10.1080/13552070215906.
CrossRef - Sutradhar L. C, Bala S. K, Islam A. K. M. S, Hasan M. A, Paul S, Rahman M. M, Pavel M. A. A, Billah M. A Review of Good Adaptation Practices on Climate Change in Bangladesh. Paper presented at: 5th International Conferene on Water & Flood Management (ICWFM-2015); 6-8 March 2015; Dhaka.
- Patt A. G, Dazé A, Suarez P. Gender and Climate Change Vulnerability: What’s the Problem, What’s the Solution?’, in Ruth, M. and Ibarraran, M. C. (eds) Distributional Impacts of Climate Change and Disasters. UK: Edward Elgar Publishing; 2009.
- Ikeda K. Gender differences in human loss and vulnerability in natural disasters: a case study from Bangladesh. Indian Journal of Gender Studies. 1995; 2(2):171-193. doi: https://doi.org/10.1177/097152159500200202.
CrossRef - Cutter S. L, Boruff B. J, Shirley W. L. Social Vulnerability to Environmental Hazards. Soc. Sci. Q. 2003; 84(2):242-261. doi: https://doi.org/10.1111/1540-6237.8402002.
CrossRef - Islam M. R. Vulnerability and Coping Strategies of Women in Disaster: A Study on Coastal Areas of Bangladesh. Arts Faculty Journal. 2012; 4:147-169. doi:https://doi.org/10.3329/afj.v4i0.12938
CrossRef - Neumayer E, Plümper T. The Gendered Nature of Natural Disasters: The Impact of Catastrophic Events on the Gender Gap in Life Expectancy, 1981–2002. Ann. Assoc. Am. Geogr. 2007; 97(3):551-566. doi: 10.1111/j.1467-8306.2007.00563.x.
CrossRef - Blaikie P, Cannon T, Davis I, Wisner B. At Risk: Natural Hazards, People’s Vulnerability and Disasters. London: Routledge; 1994.
- Hossain M. N. Analysis of human vulnerability to cyclones and storm surges based on influencing physical and socioeconomic factors: Evidences from coastal Bangladesh. Int. J. Disast. Risk Re. 2015; 13:66-75. doi: 10.1016/j.ijdrr.2015.04.003.
CrossRef - Islam M. A, Mitra D, Dewan A, Akhter S. H. Coastal multi-hazard vulnerability assessment along the Ganges deltaic coast of Bangladesh–A geospatial approach. Ocean Coast. Manage. 2016; 127:1-15. doi: 10.1016/j.ocecoaman.2016.03.012.
CrossRef - Mallick B, Vogt J. Population displacement after cyclone and its consequences: empirical evidence from coastal Bangladesh. Nat. Hazards. 2014; 73(2):191-212. doi: https://doi.org/10.1007/s11069-013-0803-y.
CrossRef - Quader M. A, Khan A. U, Kervyn M. Assessing risks from cyclones for human lives and livelihoods in the coastal region of Bangladesh. Int. J. Environ. Res. Public Health. 2017; 14(8):831. doi: http://dx.doi.org/10.3390/ijerph14080831.
CrossRef - Mohiuddin M, Latif M. B. Housing Condition of Coastal Area in Bangladesh : A Case Study of Kutubdia , Cox ’ s Bazaar. J. Environ. Sci. Nat. Resour. 6(1), 15-20. https://doi.org/10.3329/jesnr.v6i1.22034
CrossRef - Ali A. Vulnerability of Bangladesh to Climate Change and Sea Level Rise through Tropical Cyclones and Storm Surges’, in Erda, L. et al. (eds) Climate Change Vulnerability and Adaptation in Asia and the Pacific. Dordrecht: Springer; 1996. doi: https://doi.org/10.1007/978-94-017-1053-4_16.
CrossRef - Hoque M. A. A, Phinn S, Roelfsema C,Childs I. Modelling tropical cyclone risks for present and future climate change scenarios using geospatial techniques. Int. J. Digit Earth. 2018; 11(3):246-263. doi: https://doi.org/10.1080/17538947.2017.1320595.
CrossRef - Tasnim K. M, Shibayama T, Esteban M, Takagi H, Ohira K, Nakamura R. Field observation and numerical simulation of past and future storm surges in the Bay of Bengal: case study of cyclone Nargis. Nat. Hazards. 2015; 75(2):1619-1647. doi: https://doi.org/10.1007/s11069-014-1387-x.
CrossRef - Islam T, Peterson R. E. Tropical cyclone wind characteristics for the Bangladesh coast using Monte Carlo simulation. Journal of Applied Sciences. 2008; 8(9):1249-1255. doi: 10.3923/jas.2008.1249.1255.
CrossRef - Ahsan M. N, Warner J. The socioeconomic vulnerability index: A pragmatic approach for assessing climate change led risks-A case study in the south-western coastal Bangladesh. Int. J. Disast. Risk Re. 2014; 8:32-49. doi: 10.1016/j.ijdrr.2013.12.009.
CrossRef - Brooks N, Neil A. W, Mick K. P. The determinants of vulnerability and adaptive capacity at the national level and the implications for adaptation. Global Environ. Chang. 2005; 15(2):151-163. doi: 10.1016/j.gloenvcha.2004.12.006.
CrossRef - Cutter S, Mitchell J, Scott M. Revealing the Vulnerability of People and Place : a Case Study of Georgetown County, South Carolina. Ann. Assoc. Am. Geogr. 2000; 90(4):713-7 doi: 10.1111/0004-5608.00219.
CrossRef - Lindsay J. R. The determinants of disaster vulnerability: Achieving sustainable mitigation through population health. Nat. Hazards. 2003; 28(2/3):291–304. doi: 10.1023/a:1022969705867.
CrossRef - Morrow B. H. Identifying and Mapping Community Vulnerability. Disasters. 1999; 23(1), pp. 1–18. doi: 10.1111/1467-7717.00102.
CrossRef - Tierney K. Social Inequality, Hazards, and Disasters’, in Daniels, R. J., Kettl, D. F., and Kunreuther, H. (eds) On Risk and Disaster: Lessons from Hurricane Katrina. Philadelphia: University of Pennsylvania Press; 2006. doi: 10.9783/9780812205473.109.
CrossRef - CARE. After the Storm: Bangladeshi Response to the Cyclone. Dhaka: Cooperation for American Relief Everywhere; 1991.
- CARITAS. Cyclone-91: In memorial. CARITAS Bangladesh: Dhaka; 1991.
- Haque C. E, Blair D. Vulnerability to Tropical Cyclones: Evidence from the April 1991 Cyclone in Coastal Bangladesh. Disasters. 1992; 16(3):217-229. doi: 10.1111/j.1467-7717.1992.tb00400.x.
CrossRef - Clark G. E, Moser S. C, Ratick S. J, Dow K, Meyer W. B, Emani S, Jin W, Kasperson J. X, Kasperson R. E, Schwarz H. E. Assessing the vulnerability of coastal communities to extreme storms: the case of Revere, MA., USA. Mitig. Adapt. Strat. Gl. 1998; 3(1):59–82. doi: https://doi.org/10.1023/A:1009609710795.
CrossRef - Kumar T. S, Mahendra R. S, Nayak S, Radhakrishnan K, Sahua K. C. Coastal vulnerability assessment for Orissa State, east coast of India. J. Coast. Res. 2010; 26(3):523-534. doi: https://doi.org/10.2112/09-1186.1.
CrossRef - BWDB. Annual Progress Report. Dhaka: Bangladesh Water Development Board, Government of The People’s Republic of Bangladesh; 2017.
- Fothergill A, Peek L. A. Poverty and Disasters in the United States: A Review of Recent Sociological Findings. Nat. Hazards. 2004; 32(1):89-110. doi: 10.1023/b:nhaz.0000026792. 76181.d9.
CrossRef - Chambers R. Sustainable rural livelihoods: practical concepts for the 21st century. London: Institute of Development Studies; 1992.
- Cutter S. L. Social Science Perspectives on Hazards and Vulnerability Science. Geophysical Hazards. Dordrecht: Springer; 2009. 17–30. doi: 10.1007/978-90-481-3236-2_2.
CrossRef - Donner W, Rodriguez, H. Population Composition, Migration and Inequality: The Influence of Demographic Changes on Disaster Risk and Vulnerability. Social Forces. 2008; 87(2):1089–1114. doi: 10.1353/sof.0.0141.
CrossRef - Winchester P. Power, choice and vulnerability: a case study in disaster mismanagement in South India. London: Routledge; 2014.
CrossRef - World Bank. World Development Report 1990: Poverty. Washington: World Bank Publications; 1990. doi: 10.1596/978-0-1952-0851-1.
CrossRef - Flatø M, Muttarak R, Pelser A. Women, Weather, and Woes: The Triangular Dynamics of Female-Headed Households, Economic Vulnerability, and Climate Variability in South Africa. World Dev. 2017; 90:41-62. doi: 10.1016/j.worlddev.2016.08.015.
CrossRef - Alam K, Rahman H. Women in natural disasters: A case study from southern coastal region of Bangladesh. Int. J. Disast. Risk Re. 2014; 8:68-82. doi: 10.1016/j.ijdrr.2014.01.003.
CrossRef - Mallick B, Vogt J. Societal Dealings with Cyclone in Bangladesh-A Proposal of Vulnerability Atlas for Sustainable Disaster Risk Reduction. J. Coast. Zone Manag. 2015; 18(3):409-419. doi: 10.4172/2473-3350.1000409.
CrossRef - Pramanik M. K. Sea Level Rise and Coastal Vulnerability along the Eastern Coast of India through Geo-spatial Technologies. J. Geophys. Remote Sensing. 2015; 4(2):145 doi: 10.4172/2169-0049.1000145.
CrossRef - Baarsch F, Kelman I. Insurance mechanisms for tropical cyclones and droughts in Pacific Small Island Developing States. Jàmbá: Journal of Disaster Risk Studies. AOSIS, 2016; 8(1): 288. doi: 10.4102/jamba.v8i1.288.
CrossRef - Watkins K. Human Development Report 2007/8. Fighting climate change: human solidarity in a divided world. UNDP-HDRO Human Development Report. New York: United Nations Development Program; 2007.
- Iyengar N. S, Sudarshan P. A Method of Classifying Regions from Multivariate Data. Economic and Political Weekly. 1982; 17(51):2047–2052. Available at: http://www.jstor.org/stable/i401122.
- Blanden J, Gregg P. Family income and educational attainment: A review of approaches and evidence for Britain. Oxford Review of Economic Policy. 2004; 20(2):245–263. doi: 10.1093/oxrep/grh014.
CrossRef - Begum M. Factors affecting family size in rural Bangladesh. Bangladesh Medical Research Council Bulletin. 2004; 30(3):115–124.
- Samir K. C. Community vulnerability to floods and landslides in Nepal. Ecology and Society. 2013; 18(1): 8. http://dx.doi.org/10.5751/ES-05095-180108.
CrossRef - Frankenberg E, Sikoki B, Sumantri C, Suriastini W, Thomas D. Education, vulnerability, and resilience after a natural disaster. Ecology and Society. 2013; 18(2): 16. http:// dx.doi.org/10.5751/ES-05377-180216.
CrossRef - Shaw R, Shiwaku K, Kobayashi H, Kobayashi M. Linking experience, education, perception andearthquake preparedness. Disaster Prev. Manag. 2004; 13:39–49. doi: 10.1108/09653560410521689.
CrossRef - Muttarak R, Pothisiri W. The role of education on disaster preparedness: case study of 2012 Indian Ocean earthquakes on Thailand’s Andaman Coast. Ecology and Society. 2013; 18(4): 51. http://dx.doi. org/10.5751/ES-06101-180451.
CrossRef


