Sets of Environmentally Responsible Behaviors Among Residents of New Jersey
Daniel George Clark1
*
 and Rebecca Jordan2
1
Department of Human Ecology,
Graduate Program in Ecology and Evolution,
Rutgers, the State University of New Jersey, New Brunswick,
New Jersey,
08901
USA
2
Department of Community Sustainability,
Michigan State University,
Lansing,
Michigan,
48824
USA
http://dx.doi.org/10.12944/CWE.14.3.05
There are many challenges facing humanity and the degradation of resources and natural spaces. One avenue for approaching these issues is through attempting to change human behaviors. Drawing on Stern’s Value-Behavior-Norm theory, we sought out to test the idea that these Environmentally Responsible Behaviors (ERBs) fell into well-established sets. In this research, we developed questionnaire that surveyed 290 residents on Central New Jersey. The questions included demographic information, as well as items gauging the type and extent of respondents’ engagement in ERBs. We used generalized canonical correlation analysis in order to sort the types of behaviors that respondents engaged in to distinct groups. The ERBs sorted into 3 canonical correlation variables that account for 53.7% of the variation in the data. Twenty-five ERBs that loaded highly on at least one of the three canonical correlation variables. The ERBs sorted into 3 groups that did not follow the expected pattern based on Stern’s research. Instead into three other groups suggesting alternative ways of conceptualizing pro-environmental behavior in this population. We found that ERBs tended to sort into those related to energy expenditures, identity as an environmentalist, and impact-oriented ERBs. This research helps to foster a greater understanding of individuals’ engagement in Environmentally Responsible Behaviors.
Copy the following to cite this article:
Clark D. G, Jordan R. Sets of Environmentally Responsible Behaviors among Residents of New Jersey. Curr World Environ 2019; 14(3).
DOI:http://dx.doi.org/10.12944/CWE.14.3.05Copy the following to cite this URL:
Clark D. G, Jordan R. Sets of Environmentally Responsible Behaviors among Residents of New Jersey. Curr World Environ 2019; 14(3). Available from: https://bit.ly/31LVtGc
Download article (pdf) Citation Manager Publish History

Introduction
In a world facing increasing environmental challenges,1 it is important to understand factors underlying human behaviors that create these environmental challenges. Early models of these behaviors – green, pro-environmental, environmentally significant, and other terms have been used – relied on a Knowledge – Action – Behavior model.2,3 With increased interest from policy-makers, land managers, stewards, planners, and other stakeholders into understanding these behaviors, possible explanations have been increasingly studied.
Since 2002, many researchers covering Environmentally Responsible Behaviors (ERBs henceforth) have heavily cited Kollmuss and Agyeman.4 These researchers propose a comprehensive model for a range of intrinsic and external factors both supporting and suppressing pro-environmental behaviors in individuals.4 Traditionally, environmental literacy and motivation have been correlated with conservation-oriented attitudes and pro-environment views.5–7 However, correlations between these exist only modestly, and environmental literacy has not been found to be inherently linked to direct actions. Identity also plays a major role in engaging in ERBs.8
Explanations of engagement in ERBs rely heavily on identity, with how individuals see themselves in the world playing a major role.8–10 Exposure to green colors11–13 has also been found to be an explanatory factor. Childhood experiences and cultural factors have been found, in some studies, to be the single largest predictor of engagement in ERBs in adults.14–16 Much of this research cites more than one of the factors mentioned, and oftentimes there are further links to dimensions of lifestyle, such as health or use of parks.17–21 Links to lifestyle may also include factors related to convenience – for example, it may be easier for people with more time to engage in ERBs which require the investment of time, or ERBs that require spending money may be more common in wealthier communities.
The focus of this work is to identify sets of environmentally responsible behaviors (ERBs) that might provide greater explanatory power than the factors described above. More specifically, we sought to identify potential differences between those behaviors which are explicitly identified as “green” or “eco-friendly” and behaviors which may also have a positive environmental impact but which are not identified in this manner (e.g. behaviors related to efficiency or waste, but not explicitly “green” or “eco-friendly” in nature). In doing so, we seek to identify opportunities for understanding how sets of behaviors are linked, and how individuals engaging in one type of behavior may be induced into engaging in additional ERBs. We relied heavily on Stern’s Value-Belief-Norm theory (VBN). This work neatly lays out sets of behaviors that individuals engage in - consumer behaviors, support for policies, and environmental citizenship.22
At the time of Stern’s work, he cites the need for a synthesis to explain relationships among different types of behavior, and how those behaviors come to take place.22 Among these he cites some of the work we have mentioned,2 as well as literature on altruism, and the Theory of Planned Behavior.23 The Theory of Planned Behavior itself is an offshoot of the Theory of Reasoned Action,24 that was an attempt to improve on the earlier theory. These posit that individuals engage in behaviors based on their anticipated results, and evaluate them based on how this fits into their belief system (including beliefs about self).2,23,24 Stern’s VBN model added further dimensions to this work in that it incorporated context, personal abilities, and habits, and did not rely as heavily on attitude or norms as earlier models.22
In the last 20 years, there has been development in terms of VBN theory, and how other aspects of environmentalism may fit in with this theory.25,26 Additionally, by explicitly leaving out identity factors, and separating activist and non-activist forms of environmentalist behaviors, there are areas of additional study required in this body of research.22,27 We seek to evaluate some potential links across these VBN factors and identity.
To do our work, we relied heavily on Stern’s environmentally significant behaviors, which are primarily defined by their impact and the extent to which these behaviors “change the availability of materials or energy from the environment, or alters the structure and dynamics of ecosystems or the biosphere itself”.27 Our focus was on actions and behaviors that will likely have positive environmental impact, and whether there are sets of these behaviors. Additionally, we sought to identify the extent to which these behaviors could be connected to factors of identity that were cited as potential motivators in earlier studies.8-21
We are not assuming causality in this work, but rather identifying suites of behaviors that are related for possible targeting of messaging, policy, and outreach as well as future work that would have to be done to study mechanisms behind actions. We initially hypothesized that there were distinct groups of behaviors in which individuals engaged, and that they would follow the patterns described over 20 years ago.22,27 We further hypothesized that individuals fitting into a given group may also have identity factors that are associated with certain behaviors.
This research was part of a larger project that also included assessments of relationships among ERBs, landscape factors, and use of parks. Other portions of this study can be found in previously published work.19,28,29
Methods
Environmentally Responsible Behaviors
As referenced in the introduction, the primary goal of this study was to uncover latent structures or underlying themes within individuals’ engagement in Environmentally Responsible Behaviors (ERBs). Furthermore, we wanted to test the extent to which engagement in ERBs followed the patterns expected by Stern’s Value-Behavior-Norm Theory,22,27 such as a set of citizenship non-activist behaviors, or consumer-based behaviors. Additionally, we expected these to follow patterns by established in the intervening years related to ERB and environmental literacy, and the formation of environmentally significant behaviors.25,26,30–32
The questions related to ERBs were adapted from and informed by earlier work in this field related to the description and quantification of environmental behavior and consumer behavior.20,33–38 This was to allow some grounds of comparison between our work and past research on the topic of environmental behavior. The behaviors used are based on Stern, Hungerford et al., and also Lee’s Perceived Consumer Efficiency survey items,3,22,26,27 with some additional questions relating to identity.
The categories are direct actions, community and civic engagement, political engagement, identity, and consumer behavior, which was further stratified into items relating to consumable and non-consumable products. This classification is used in presenting these items in the results section.
Additionally, as part of a larger project, we focused our attention primarily on outcome-oriented ERBs and engagement in ERBs with perceptible outcomes. While we had a few items that may be more difficult to observe (such as “I think of myself as an environmentalist”), the bulk of the ERBs included in our study could potentially be measured by a person or agency seeking to change behavior – such as recycling or energy use. If a behavior is measurable and quantifiable, an intervention aimed at this behavior could be evaluated for success. A total of thirty-eight (38) ERB-related items were included in the survey instrument.
Survey Instrument
In addition to including the ERB items on our questionnaire, we also included items on age, racial/ethnic background, gender, socio-economic status, life stage, educational attainment, and recreation. Most of these items were included to check how representative our sample was of the survey area. Additionally, we wanted to check for the extent to which any of these variables may impact engagement in ERBs. Recreation items were included as part of the larger project that this was a portion of, in order to study public use of outdoor space in relation to ERBs, as well as in relation to landscape. Summary statistics for the population can be found at the beginning of the Results section.
We created a questionnaire by piloting survey items over the summer of 2016 by approaching individuals in parks as well as around eateries, coffee shops, and farmers markets. Based on responses to pilot survey instrument and guided interviews items were edited for comprehensibility, functionality, and the extent to which they answered research questions. The survey items were constructed such that responses would be comparable to census work,39 the National Survey on Recreation and the Environment,40,41 and other work of interest20,21,26,27,42
A total of 290 responses were collected, though some respondents did not answer all items, which makes the number for analysis less than 290 in some cases. The criteria for inclusion in the sample were that respondents must be a minimum of 18 years of age, and to live in one of the municipalities within the study area. Respondents were also required to respond affirmatively to a consent form based on Institutional Review Board anonymous consent protocol. All research was carried out in accordance with Rutgers IRB [#E15-678].
Qualtrics, a research software company, was contracted to collect survey responses in September of 2016 for three weeks. Survey responses were collected online via internet-enabled devices (including computers, tablets, smartphones, etc.). At the times of this study, the authors’ institution had a subscription to Qualtrics, and both authors had extensive familiarity working with this software. Additionally, when contacted for a proposal based on available funding, Qualtrics was able to provide a higher number of responses than other competing services. Text of survey items can also be found in the Results section accompanying the analyses.
Study Area
The study area chosen for this research was Middlesex County, New Jersey. One reason for choosing this study area was because of extensive experience that the authors had interacting with this population for previous work, as well as their ability to ground-truth any unexpected findings, and ability to easily contact relevant public agencies.
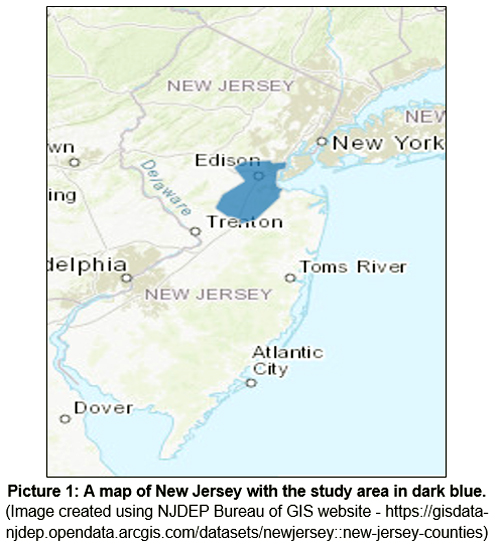 |
Picture 1: A map of New Jersey with the study area in dark blue. Click here to view Picture |
There were additional compelling reasons to select this area. Based on the number of responses possible, a constrained geographic area was desirable for other parts of the larger study which involved investigating landscape effects on populations. Due to the changes in the people and the landscape over a relatively small area, Middlesex County was selected over other possible study areas in New Jersey, New York, and Pennsylvania.
The total area is of Middlesex County is approximately 835 square kilometers, with less than five percent of that area consisting of water.43 It is the second most populous county in New Jersey, with a population of approximately 840,000; European settlement of the area dates to the 1680s; Middlesex County is part of the New York City metropolitan area.
Middlesex County displays diversity in income, socio-economic status, and landscape across a relatively small geographic area. New Brunswick and Metuchen are both in Middlesex County and only a few miles apart, but the median income for New Brunswick is less than a third of that in Metuchen, for example.39 Additionally, almost one tenth of the county is agricultural land, and goods such as hay, sod, and fruits are important economically, and occupy up to a third of towns such as Cranbury and Monroe.43,44 The ethnic and racial diversity of these municipalities varies as well.39 In sum, by constraining this work to a single county, we thought we would have some ability to isolate factors, as well as have some constancy across their experiences as they moved through the landscape.
Because much of the landscape of this area has a similar pattern of development, our study should certainly be of interest in this region, which includes approximately one-fifth of the population of the United States.39,45 Furthermore, many of the insights gained through this work would be applicable in some form when dealing with other similar portions of the United States, and similar areas of other countries.
Summary Information
This section presents summary information of the survey responses.
Respondents had already responded that they were over 18 years old in order to complete this questionnaire. Table 1 gives the summary information for the age of respondents.
Table 1: Respondent Age summary data
|
What is your age in years? |
N=290 |
|
Mean |
44.7 |
|
Median |
42.5 |
|
Mode |
54 |
|
Standard Deviation |
16.05 |
|
Variance |
257.8 |
|
Kurtosis |
-0.95 |
|
Skewness |
0.3 |
|
Range |
62 (18-80) |
The next two questions asked about respondents’ racial and ethnic background, and are presented below, in Table 2 and Table 3. These two questions were designed to be comparable with the U.S. Census and other United States-based data sources.
Table 2: Summary Hispanic/Latino ethnicity data
|
Do You identify as Hispanic, Latino or of Spanish origin? |
% |
Count |
|
Yes |
7.24% |
21 |
|
No |
92.76% |
269 |
|
Total |
100% |
290 |
Table 3: Summary racial makeup data
|
What race do you consider yourself to be? |
% |
Count |
|
Black/African American |
6.21% |
18 |
|
White/Caucasian |
74.48% |
216 |
|
Asian American/Pacific Islander |
14.48% |
42 |
|
American Indian/Alaskan Native |
0.69% |
2 |
|
Other/More than one race |
4.14% |
12 |
|
Total |
100% |
290 |
Respondents were also asked about their gender; a summary is given in Table 4. Responses were skewed, with an over-representation of female-identifying respondents compared to the study area.
Table 4: Gender Summary data
|
What is your gender? |
% |
Count |
|
Female |
66.55% |
193 |
|
Male |
33.10% |
96 |
|
Other |
0.34% |
1 |
|
Total |
100% |
290 |
Table 5 gives summary information on respondents’ educational attainment.
Table 5: Summary Educational Attainment data
|
What is the highest level of education you have completed? |
% |
Count |
|
Less than high school |
0.00% |
0 |
|
High School/GED/Equivalent |
17.93% |
52 |
|
Some college |
19.31% |
56 |
|
Associate's Degree |
8.62% |
25 |
|
Bachelor's degree |
27.93% |
81 |
|
Some graduate or professional school |
4.14% |
12 |
|
Master's Degree (MA, MS, MFA, MF, MSN, etc.) |
18.62% |
54 |
|
Doctoral Degree (MD, DO, PhD, DVM, DPT, etc.) |
3.45% |
10 |
|
Total |
100% |
290 |
Tables 6 and 7 provide information on respondents’ annual income, as well as their perceived socio-economic status. Past studies have shown that perception of ones’ socioeconomic status can impact behavior.46 Additionally, this may provide additional context for those unfamiliar with relative purchasing parity in New Jersey.
Table 6: Household income summary data
|
What was your total household income last year? |
% |
Count |
|
Less than $10,000 |
9.66% |
28 |
|
$10,000 - $19,999 |
3.79% |
11 |
|
$20,000 - $29,999 |
7.59% |
22 |
|
$30,000 - $39,999 |
5.86% |
17 |
|
$40,000 - $49,999 |
10.00% |
29 |
|
$50,000 - $59,999 |
10.00% |
29 |
|
$60,000 - $69,999 |
6.21% |
18 |
|
$70,000 - $79,999 |
8.28% |
24 |
|
$80,000 - $89,999 |
9.66% |
28 |
|
$90,000 - $99,999 |
8.97% |
26 |
|
$100,000 - $124,999 |
11.03% |
32 |
|
$125,000-$149,999 |
6.55% |
19 |
|
$150,000-$199,999 |
3.45% |
10 |
|
$200,000-$250,000 |
3.79% |
11 |
|
More than $250,000 |
1.72% |
5 |
|
Total |
100% |
290 |
Table 7: Perceived financial status
|
How would you describe yourself financially? |
% |
Count |
|
Struggling |
28.97% |
84 |
|
Stable |
44.48% |
129 |
|
Comfortable |
26.21% |
76 |
|
Affluent |
0.34% |
1 |
|
Total |
100% |
290 |
Tables 8, 9, and 10 provide summary information on the household size and composition of respondents. Additionally, we asked respondents if they had raised children in the past, whether or not those children still lived with them. Based on these, it can be seen that the average respondent lived in a household with 0.86 minors (under 21) and just over 2 adults (aged 21 or older).
Table 8: Summary household minor data
|
How many people live in your household under the age of 21? |
290 |
|
Mean |
0.86 |
|
Median |
0 |
|
Mode |
0 |
|
Standard Deviation |
1.16 |
|
Variance |
1.35 |
|
Kurtosis |
8.08 |
|
Skewness |
2.04 |
|
Range |
9 (0-9) |
Table 9: Summary household adult data
|
How many people live in your household aged 21 or older? |
290 |
|
Mean |
2.03 |
|
Median |
2 |
|
Mode |
2 |
|
Standard Deviation |
0.94 |
|
Variance |
0.89 |
|
Kurtosis |
1.1 |
|
Skewness |
0.59 |
|
Range |
5(0-5) |
Table 10: Summary parental status data
|
Are you now, or have you in the past raised any children? |
% |
Count |
|
Yes |
66.21% |
192 |
|
No |
33.79% |
98 |
|
Total |
100% |
290 |
Virtually all (99.3%) of the study area was classed as urban (in and urban/rural binary) by the U.S. Census Bureau in the 2010 census.39 There are also differences throughout the study area that may be specific on a sub-municipal scale that were not otherwise captured within the study.
Analysis
Descriptive statistics for each variable were performed using Minitab 16; all other statistical analyses were performed using SAS version 9.4. Most survey items had Likert-type responses indicating level of importance or agreement, others had responses indicating a level of participation, or number of times an action was performed. Summary statistics for response items can be found at the beginning of the results section for ERB items and demographic items.
Generalized canonical correlation can serve as a type of dimensionality reduction and a way of looking for underlying patterns within the data while still allowing for comparison between and among sets.47 Generalized canonical correlation is particularly useful in that all parametric tests – such as Principal Component Analysis - can be treated as special cases of generalized canonical correlation.47 We chose this type of analysis in order to allow us to compare across more than two possible sets of variables. Additionally, generalized canonical correlation analysis requires fewer assumptions about data than other similar analysis methods.47
With 290 responses for most items, our dataset was large enough for this type of analysis. From this, we would be able to pull out which individual items made up latent sets of behaviors. Furthermore, as performed in SAS 9.4, the results gave us standardized coefficients within each canonical correlation variable. This meant that items with slightly different scales could be compared. Magnitude and sign on a given canonical correlation variable can be interpreted as a measure of similarity or dissimilarity between two items on the same canonical correlation variable. For example, two items with a value of 0.3 and 0.32 would indicate similar responses on these items across respondents, whereas 0.3 and -0.32 would indicate different responses. When inputting the data into SAS, all variable items were coded so that the most environmentally responsible responses would have the highest value, and the least environmentally friendly response would have the lowest value across all ERBs. All 38 ERBs were included in the canonical correlation analysis.
Results
A generalized canonical correlation analysis was performed on the all 38 ERBs included in the questionnaire. Initial analyses indicated that the first three canonical variables are significant (p< 0.05), and cumulatively account for 53.74% of the variation across all three canonical variables. The canonical correlations for the first three canonical variables are: 0.729, 0.600, and 0.515, respectively.
These canonical variables can therefore be helpful in understanding and describing relationships among the sets of variables in our dataset because they highlight which individual survey items seem to co-occur in responses, which are responsible for the most and least variation, and which items individuals responded to in similar or opposite ways. Table 12 reports the fit statistics and significance of the generalized canonical correlation analysis.
Table 12: Multivariate fit statistics for Generalized Canonical Correlation. These indicate that the canonical variables are significant and represent a good fit to our data.
|
Multivariate Statistics and F Approximations |
|||
|
Statistic |
Value |
F Value |
P > F |
|
Wilks' Lambda |
0.04387706 |
1.56 |
<.0001 |
|
Pillai's Trace |
2.62705082 |
1.48 |
<.0001 |
|
Hoteling-Lawley Trace |
3.83822268 |
1.65 |
<.0001 |
|
Roy's Greatest Root |
1.13701636 |
7.30 |
<.0001 |
We focused our work on those questionnaire items that were highly weighted on the first three variables. For highly loaded variables, we used those with standardized coefficients with an absolute value of 0.2 or greater. When interpreting this type of analysis using standardized coefficients, those with the highest standardized coefficients represent the greatest weighting on the canonical variables.48 Standardized coefficients allow us to look at this relationship while accounting for differences in response scale across items. Coefficients with the same sign have the same influence on the canonical variable, whereas those with opposite signs have opposing influence. All responses were coded so that the least environmentally responsible option was a “1”, and more environmentally responsible responses were higher numbers. While the items had different numbers of responses, their canonical variable coefficients were standardized and thus can be compared across all items.
For the first canonical variable, five of the ERBs were highly weighted. Of those, three items were factors related to Identity, and two were related to consumer choices (with one each for consumable and non-consumable products).
Table 13: Highly weighted items on the first canonical variable
|
Canonical Variable 1 |
|
|
Consumer - Consumable |
|
|
When you purchase personal care products (such as soaps, shampoos or body washes), does their environmental impact affect which you choose? [Definitely Not “1”to Definitely Yes “5”] |
-0.2309 |
|
Consumer -Non-Consumable |
|
|
Would you be willing to pay more for your electricity if it came from a renewable source such as solar or wind energy? [Respondents could select 1= none, 2 =up to 10% more, 3= up to 25% more, 4 = up to 50% more, 5= up to 75% more, 6= up to double my current rate (or more).] |
0.2328 |
|
Identity |
|
|
How knowledgeable do you feel about what your personal carbon footprint is? [Not knowledgeable at all = 1, Extremely Knowledgeable = 5] |
0.2219 |
|
Which of the following are components of an individual carbon footprint? [Percent correct out of 14 possible items; 7 which were correct and should be checked, and 7 which were incorrect and were not to be checked] |
0.2208 |
|
I think about the environmental impacts of my actions. [ Does not describe me =1, Describes me extremely well =5] |
0.2206 |
Of these five highly weighted canonical variable coefficients, we see that four of them are positive in sign, and that one, relating to personal care products, is negative. This means that we would expect individuals engaging in any of the other four ERBs to increase or decrease together- those with high knowledge of their carbon footprint would also be expected to report thinking about the environmental impacts of their actions, for example. Those who reported thinking more about their personal care products, however, would be expected to have a lower response to the other four items.
The highly weighted items for the second canonical variable are presented in Table 14. For this canonical variable, thirteen items were found to be highly weighted, and items from all six of the ERB classifications were included.
Table 14: Highly weighted items on second canonical correlation variable
|
Canonical Variable 2 |
|
|
Direct Actions |
|
|
When you are uncomfortable in your home, do you think you are generally more likely to adjust the thermostat, or to change your clothing to become more comfortable? Is this different when it is too hot outside or too cold outside? (If you do not control the heat or AC in your home, please select NA) [Always/almost always change thermostat= 1 to Always/almost always change clothes = 5] |
0.3583 |
|
Think about the last time you disposed of an appliance, television, or computer. Did you dispose of it appropriately according to local rules? This may mean bringing it to a municipal disposal center, or leaving it out on a certain day of the month, for example. [Definitely Not “1”to Definitely Yes “5”] |
-0.2731 |
|
When you do dishes by hand, or dry dishes, how often do you use reusable/cloth dish towels/dish rags/ etc. instead of paper towels? [Never/Almost Never = 1 to Always/Almost Always =5] |
-0.2973 |
|
I know which items are recyclable where I live. [ Strongly Disagree =1 to Strongly Agree =5] |
-0.3228 |
|
Community/Civic |
|
|
Are you a member of any environmental groups or organizations, or do you donate to any environmental groups or organizations? [No=0, Respondents could select up to 15 organizations, including “Other” if they answered Yes] |
0.2316 |
|
Political Engagement |
|
|
Which of the following have you written, called, or emailed about a concern in the last year? (please select all that apply) [Respondents could select 0 – 8 government officials] |
0.2874 |
|
Consumer - Consumable |
|
|
When you purchase personal care products (such as soaps, shampoos or body washes), does their environmental impact affect which you choose? [Definitely Not “1”to Definitely Yes “5”] |
0.2755 |
|
Which types of car would you consider buying in the future? [Respondents could select 0-3 types of zero/low emission vehicles] |
0.2798 |
|
Would you be willing to pay more for your food if you knew it was grown sustain-ably? [Respondents could select 1= none, 2 =up to 10% more, 3= up to 25% more, 4 = up to 50% more, 5= up to 75% more, 6= up to double my current rate (or more).] |
-0.216 |
|
Consumer - Non-Consumable |
|
|
Would you be willing to pay more for your electricity if it came from a renewable source such as solar or wind energy? [Respondents could select 1= none, 2 =up to 10% more, 3= up to 25% more, 4 = up to 50% more, 5= up to 75% more, 6= up to double my current rate (or more).] |
0.273 |
|
Think about the last appliance you bought - TV, microwave, refrigerator, etc. When you bought this appliance, how important was energy efficiency to you in considering your options? [Not at all important =1 to Extremely Important = 5] |
0.2041 |
|
Identity |
|
|
I try to buy environmentally friendly groceries. [Never/Almost Never =1 to Always/Almost always =5] |
0.2263 |
|
I consider myself to be an environmentalist. [ Strongly Disagree =1 to Strongly Agree =5] |
0.2031 |
|
I think about the environmental impacts of my actions. [ Does not describe me =1, Describes me extremely well =5] |
-0.3122 |
The highest number of items comes from the category of direct actions. There are four of these, and all but one is negative. The positive item is relating to whether respondents were more likely to change clothes or their thermostats when they were uncomfortable in their dwelling, with the less environmentally responsible option being that respondents change the thermostats. The three negative ERBs within this category are those related to proper appliance disposal, knowing what is recyclable, and use of a reusable dish towel in cleaning up ones’ dishes.
Three ERBs in the category of consumer actions related to consumables were found to be highly weighted on this canonical variable. Of those, personal care products and car types both load positively, with paying more food sustainable food loading negatively.
Three identity ERBs loaded highly on this canonical variable. Self-identification as an environmentalist and buying environmentally friendly groceries loaded positively, with thinking about the environmental impacts of ones’ actions loading negatively. This would suggest that people who consider themselves environmentalists do not necessarily report thinking about the environmental impacts of their actions, and vice versa.
Two non-consumable consumer actions loaded highly on this canonical variable, and both of them loaded positively. These were being willing to pay more for renewably generated electric power, and importance of efficiency in their last appliance purchase.
One ERB each from the categories of community/civic and political engagement loaded highly on this canonical variable, and both loaded positively. These were writing to government officials, and membership in environmental related organizations.
Table 15 give the highly weighted ERBs from the third canonical variable. Twelve ERBs are highly weighted on the third canonical variable, they are evenly split with six being positive in sign and six being negative in sign. All six ERB categories are represented among these highly weighted ERBs.
Table 15: Highly weighted ERBs from third canonical variable
|
ERB Canonical Variable 3 |
|
|
Direct Actions |
|
|
I know which items are recyclable where I live. [ Strongly Disagree =1 to Strongly Agree =5] |
0.2616 |
|
Are you part of a CSA, Co-Op or similar program that you use to receive produce or other food products? [No=1, Yes = 2] |
0.2347 |
|
How often do you carry a reusable travel mug for coffee, tea or other hot beverages? [Never/Almost Never =1 to Always/Almost always =5] |
-0.2302 |
|
Do you compost your food waste? [Never/Almost Never =1 to Always/Almost always =5] |
-0.3962 |
|
Community/Civic |
|
|
I am actively engaged with my municipal/township/city or county government. [ Strongly Disagree =1 to Strongly Agree =5] |
0.2599 |
|
How likely are you to discuss/share news or informational articles about the environment with friends, relatives, or colleagues? [ Extremely Unlikely = 1 to Extremely Likely = 5] |
-0.223 |
|
Political Engagement |
|
|
How many times in the last year have you written, called or emailed a state or federal member of Congress or Senate? [This can include signing petitions - online or in person - to send to government officials] [Never =0, 1-2 times = 1, 3-5 times = 2, 6-10 times = 3, 10-20 times = 4, 20+times = 5] |
0.4004 |
|
Consumer - Consumable |
|
|
I pay attention to the type and amount of packaging of products and merchandise I purchase. [ Strongly Disagree =1 to Strongly Agree =5] |
-0.2063 |
|
Consumer - Non-Consumable |
|
|
Would you be willing to pay more for your electricity if it came from a renewable source such as solar or wind energy? [Respondents could select 1= none, 2 =up to 10% more, 3= up to 25% more, 4 = up to 50% more, 5= up to 75% more, 6= up to double my current rate (or more).] |
0.2157 |
|
Think about the last time you purchased a car. When you purchased this car, how important was fuel efficiency in considering your options? [Not at all important =1 to Extremely Important = 5] |
-0.2933 |
|
Still thinking about the last appliance, you purchased, how important was it to you that this appliance was environmentally friendly? [Not at all important =1 to Extremely Important = 5] |
0.3061 |
|
Identity |
|
|
Which of the following are components of an individual carbon footprint? [Percent correct out of 14 possible items; 7 which were correct and should be checked, and 7 which were incorrect and were not to be checked] |
-0.2513 |
Four of these highly weighted ERBs are in the Direct Actions category. Knowing what is recyclable, and membership in a CSA (or co-op) are both positive; frequency of carrying a reusable mug and composting food waste are both negative in sign.
Three of these ERBs are non-consumable-related consumer actions. Willingness to pay more for renewable electric power and the environmental friendliness of the last major appliance purchase are positive in sing; car fuel efficiency importance is negative in sign.
Two of the highly weighted ERBs on the third canonical variable are community/civic actions. Reported level of engagement with local government is positive in sign, and likelihood of sharing news articles with friends, family, and colleagues is negative in sign.
Political engagement, identity, and consumable-related consumer actions all have one highly weighted ERB on this canonical variable. The number of times that a respondent indicated they had written a government official was positive in sign, and the most highly weighted ERB on this canonical variable. Paying attention to packaging on merchandise purchased and level of knowledge related to carbon footprint were both negative on this canonical variable.
Canonical Variables Plotted
To illustrate some of these latent structures, we can look at the first two canonical variables plotted against each other. Variables near each other on this chart are ones which gathered similar responses – the distance between two points is, to some extent, indicative of how similarly respondents answered those two items. Graph 1 shows highly weighted items plotted against each other for the first two canonical variables. Only items which are highly weighted (absolute value of 0.2 or greater) on one of the first two canonical variables are shown. The shaded ovals indicate groups of behaviors which load together on the first two canonical variables. We quantified the distance on these to canonical variable by finding the vector between every set of two points. To be a cluster, a group had to consist of at least three points, and all points within a cluster had to be 0.1 units or less from all other points within the cluster.
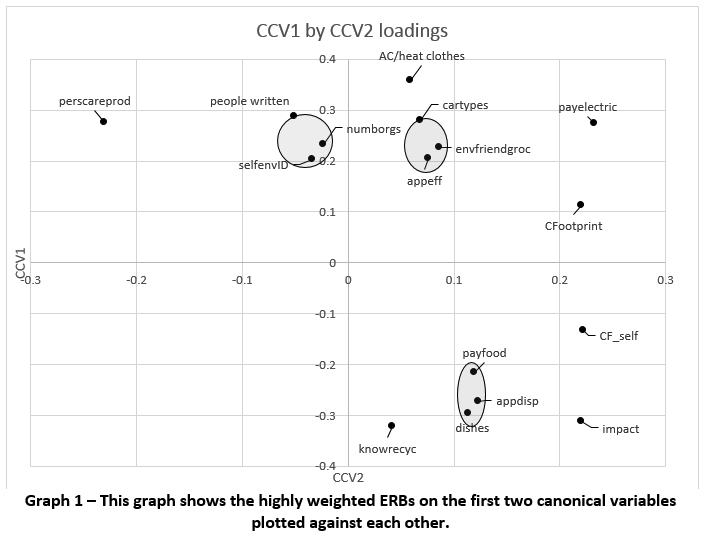 |
Graph 1 – This graph shows the highly weighted ERBs on the first two canonical variables plotted against each other. Click here to view Graph |
In the first quadrant (upper right, + sign on first two canonical variables), there are six total ERBs, with three of them in a cluster. The three clustered ERBs are car types a respondent would be willing to buy, likelihood of buying environmentally friendly groceries, and how important efficiency was in their last appliance purchase. Likelihood of changing clothes or the thermostat, willingness to pay more for renewable energy, and correct knowledge of ones’ carbon footprint round out this quadrant.
The second quadrant (upper left, CV1 +, CV2 -) has four ERBs, three of which are in a cluster. Number of government officials written, number of environmental organizations an individual belongs to, and self-identification as an environmentalist are in a cluster. Considering the environmental friendliness of ones’ personal care products is further to the right on the X (Canonical Variable 2) axis. There are no ERBs in the third quadrant (negative on CV 1 and CV2).
The fourth quadrant (bottom right, CV1 -, CV2 +), contains six ERBs, three of which form a cluster. The three clustered variables are willingness to pay more for sustainably grown food, use of a reusable dish towel, and whether respondents indicated they had disposed of their last major appliance properly. The three other ERBs in this quadrant are knowing what is recyclable where one lives, self-rating of carbon footprint (CF) knowledge, and thinking about the environmental impacts on one’s actions.
The ERBs in a given quadrant – and especially those within a cluster – may be read as groups of behaviors engaged in by individuals. These groups are not mutually exclusive. Based on the results of this generalized canonical correlation, however, individuals who engage (or do not engage) in a behavior within a quadrant also likely engage in the remaining behaviors in a quadrant.
To summarize, our results do not fit the pattern we would have anticipated if they strictly followed Stern’s VBN Theory. The behaviors are not highly clustered. Many ERBs do not cluster at all – that is to say, not all of the ERBs studied seem to co-occur with other ERBs. The behaviors that do cluster are not the behaviors we had anticipated. Self-identification as an environmentalist, environmental organization membership, and writing to officials forms a single cluster; interest in buying energy efficient appliances, interest in more eco-friendly cars, and seeking environmentally friendly groceries forms a second cluster; and, being more willing to pay for sustainable food, use of a dish towel, and proper appliance disposal form a third cluster.
Discussion
The ERBs in our research did not cluster into the groups we had expected. Based on the Value-Belief-Norm Theory,22,27 we had expected that the behavior within a cluster or a quadrant would be based primarily on their a priori categories. Additionally, Stern’s VBN Theory led to the expectation of a cluster of Consumer ERBs (perhaps split between consumable/non-consumable goods), one comprising primarily of community/civic ERBs (perhaps blended with political actions), and one consisting primarily of direct actions. As we had expected, there are identity items included in all of the clusters. This is highlighted below in Table 16. The findings of this research can be useful in shaping programs designed to enhance ERB engagement by communities. For example, by understanding which behaviors individuals already engage in, we might get a sense of which additional behaviors they would be most open to taking on.
Table 16: Highly loaded ERBs by quadrant, and their a priori categories
|
Quadrant |
ERB set |
ERBs (* denotes those within clusters) |
|
Quadrant 1 |
Consumer - Consumable |
Low/Zero Emission Car types of interest* |
|
Consumer - Non-Consumable |
Efficiency of concern in appliance purchasing* |
|
|
Willingness to pay for renewable electricity |
||
|
Direct Actions |
Likelihood of changing thermostat vs. changing clothes |
|
|
Identity |
Knowledge of carbon footprint components |
|
|
Looks for environmentally friendly groceries* |
||
|
Quadrant 2 |
Community/Civic |
Membership in environmental organizations* |
|
Consumer - Consumable |
Looks for environmentally friendly personal care products |
|
|
Identity |
Self-identification as an environmentalist* |
|
|
Political |
Number of different government officials written* |
|
|
Quadrant 4 |
Consumer - Consumable |
Willingness to pay more for sustainably grown food* |
|
Direct Actions |
Proper disposal of last major appliance disposed of* |
|
|
Reported level of knowledge of local recyclables |
||
|
Use of a reusable dish towel* |
||
|
Identity |
Self-reported level of carbon footprint knowledge |
|
|
Thinks about the environmental impacts of actions |
While we had anticipated some potential deviation, or perhaps blurring between categories, our results show that behaviors that cluster together may come from all over. There are identity and consumer ERBs across all three clusters, and these blend with political, community/civic, and direct action ERBs. In Stern’s 1999 paper it is explicitly acknowledged that identity variables were not studied22; however, based on this work, we would still expect our consumer behaviors to group together, and also the community/civic ERBs and political ERBs (either independently or together, neither of which was the case). The second cluster fits this to some extent, in that individuals with membership in environmental organizations were also more likely to write government officials.
Our research has some alignment with the perceived consumer efficiency model, which was another source that highly informed this research.26 In this case, we see that individuals within the same cluster were concerned with purchasing low/zero emissions cars, changing the thermostat over changing clothes, and looking for efficiency in consumer appliances purchased. If Perceived Consumer Efficiency ere entirely explanatory, however, we would have anticipated seeing answers for willingness to spend more on renewable energy and sustainably grown groceries align more closely.
How to Characterize these Clusters of ERBs
Most of the ERBs present in the first quadrant could be seen as being related to energy-related expenditures. The exception to this would be looking for environmentally friendly groceries. Willingness to purchase low/zero emission cars, and pay more for renewable energy, and looking for efficient appliances all relate to purchases that use less energy, or energy that is more environmentally friendly. As mentioned above, this may fall in line with the PCE model. Additionally, willingness to change one’s clothes instead of the thermostat relates directly to energy-based expenditures. Someone concerned about the efficiency of their appliances may also be willing to put on a sweater, in the winter, for example. Knowledge of the components of one’s carbon footprint was also highly loaded and in this quadrant. Most (though not all) of the carbon footprint components within this question were related to energy as well – including energy use, transportation, and air travel. Therefore, persons who think about the efficiency and costs associated with their energy use may be more likely to see the connections to how these behaviors emit carbon.
The group of ERBs in the second quadrant seem to be most linked to individuals identifying themselves as environmentalists. Other than the explicit ERB of “I consider myself to be an environmentalist”, this quadrant also contains writing government officials, membership in environmental organizations, and looking for environmentally friendly groceries. The first two of these may be considered as activist behaviors – writing an official and joining a group specifically dedicated to some environmental cause. Additionally, specifically thinking about the impact of one’s personal care products would likely sit well with someone who thought of themselves as an environmentalist.
The behaviors in the fourth quadrant of ERBs may be tied together through being impact-related. One of these items is explicitly “I think about the environmental impacts of my actions”. Disposal of an appliance, and proper recycling are both very tangible impacts that one can touch – that one is not throwing waste into the world carelessly. Likewise, using a reusable dish towel on a regular basis is tangible, and evident in a lack of paper towel waste building up. The other two behaviors in this cluster are willingness to pay for sustainable food and self-reported knowledge of one’s carbon footprint. Food that is grown sustainably can also be regarded as impact-oriented. This does not refer to the food as being environmentally friendly, but sustainably grown, which would indicate that it has a minimal long-term impact according to most definitions of sustainability. Since the carbon footprint is a conception of one’s knowledge about how many carbon emissions one generates, this can also be linked to impact-oriented behavior.
Limitations
Because of the budget of this project, our sample size was 290. Our study was highly influenced and guided by the work of both Stern and Lee. Our study area was more constrained than Stern’s in that we focused on a single county within a single state, though not necessarily as constrained as Lee’s which was conducted entirely within a single municipality (Seoul, South Korea – which has ~9.7 million residents to our study area’s ~840,000). The reasons for this, as discussed in the Methods section, were so landscape and spatial factors could be examined as potential drivers of ERBs. Additionally, our use of an online questionnaire may have had a different influence compared to an in-person or telephone survey.
Implications and Future Directions
This research has presented some linkages among ERBs that may not have been thoroughly explored in the past. The information uncovered can be useful in public programs targeting ERB engagement. It seems that individuals do not necessarily engage in ERBs in the sets we had hypothesized – consumer ERBs, community/civic ERBs, and direct actions. In this population, at least, engagement in ERBs may be viewed as sets related to energy efficiency and expenditures, or related to environmental-impact driven thinking. There is a history of literature related to identity as an environmentalist and how that relates to behavior. Our research adds some validation to previous studies that would suggest that self-described environmentalists join environmental groups, and write government officials.
Our results suggest that individuals find some motivation from three areas – energy efficiency and expenditures, environmentalist identity, and impact-oriented behaviors. Therefore, a program designed to induce a particular behavior might want to include all three of these areas in its messaging. In this way, the findings of this study may be useful. For example, a campaign to lower plastic bag use might explicate to consumers the impacts of plastic bags on ecosystems and waste, the energy costs associated with plastic bags, and pro-environmental messaging surrounding use of alternatives. Using multiple messages would be one way of engaging with individuals who engage in any behaviors in any of these three areas. This would be especially relevant for programs in similar suburban and urban areas in the Eastern United States, and similar places.
While there is still work to be done on this topic, our research can provide an effective starting point for engaging with the public in relation to environmentally responsible behaviors. Implementing these findings can lead to more successful implementation of programs to increase engagement in ERBs.
Acknowledgements
The authors would like to thank Amanda Sorensen, Daniel Betz, David Howe, Terry Regan, and Oscar Gato for their assistance with this work.
Funding
Some of the funding for this work came from the Rutgers Professional Development Fund for Teaching and Graduate Assistants.
Conflict of Interest
The authors declare that they have no conflicting interesting in performing or publishing this research.
References
- McCarthy JJ, Intergovernmental Panel on Climate Change, eds. Climate Change 2001: Impacts, Adaptation, and Vulnerability: Contribution of Working Group II to the Third Assessment Report of the Intergovernmental Panel on Climate Change. Cambridge, UK ; New York: Cambridge University Press; 2001.
- Hines JM, Hungerford HR, Tomera AN. Analysis and synthesis of research on responsible environmental behavior: a meta-analysis. Journal of Environmental Education. 1986;18(2):8.
CrossRef - Hungerford H, Bluhm WJ, Volk TA, Ramsey JM. Essential Readings in Environmental Education. 1st ed.; 1988.
- Kollmuss A, Agyeman J. Mind the gap: why do people act environmentally and what are the barriers to pro-environmental behavior? Environmental education research. 2002;8(3):239–260.
CrossRef - Coldwell DF, Evans KL. Contrasting effects of visiting urban green-space and the countryside on biodiversity knowledge and conservation support. Chapman M (Gee) G, ed. PLOS ONE. 2017;12(3):e0174376. doi:10.1371/journal.pone.0174376
CrossRef - Coyle K. Environmental Literacy in America: What Ten Yeats of NEETP/Roper Research and Related Studies Say about Environmental Literacy in the U.S. Washington, DC: The National Environmental Education & Training Foundation; 2005.
- Burchett JH. Environmental Literacy and its Implications for Effective Public Policy Formation. 2015. http://trace.tennessee.edu/cgi/viewcontent.cgi?article=1026&context=utk_bakerschol. Accessed April 5, 2016.
- Stets JE, Biga CF. Bringing identity theory into environmental sociology. Sociological Theory. 2003;21(4):398–423.
CrossRef - Dillon J, Kelsey E, Duque-Aristizabal AM. Identity and culture: Theorising emergent environmentalism. Environmental Education Research. 1999;5(4):395–405.
CrossRef - Greene CS, Millward AA, Ceh B. Who is likely to plant a tree? The use of public socio-demographic data to characterize client participants in a private urban forestation program. Urban Forestry & Urban Greening. 2011;10(1):29-38. doi:10.1016/j.ufug.2010.11.004
CrossRef - Kim TH, Song JK, Jeong GW. Neural responses to the human color preference for assessment of eco-friendliness: a functional magnetic resonance imaging study. International Journal of Environmental Research. 2012;6(4):953–960.
- Palmer SE, Schloss KB. An ecological valence theory of human color preference. Proceedings of the National Academy of Sciences. 2010;107(19):8877-8882. doi:10.1073/pnas.0906172107
CrossRef - Schloss KB, Palmer SE. Aesthetic response to color combinations: preference, harmony, and similarity. Attention, Perception, & Psychophysics. 2011;73(2):551-571. doi:10.3758/s13414-010-0027-0
CrossRef - Andrejewski R, Mowen AJ, Kerstetter DL. An Examination of Children’s Outdoor Time, Nature Connection, and Environmental Stewardship. 2011. http://scholarworks.umass.edu/nerr/2011/Papers/2/. Accessed August 2, 2016.
- Jensen PS. It Takes a (Green) Village…. Journal of the American Academy of Child & Adolescent Psychiatry. 2016;55(7):540–541.
CrossRef - Lekies KS, Whitworth B. Exploring Age Cohort Differences in Childhood Nature Experiences and Connection to Nature. 2014. http://scholarworks.umass.edu/cgi/viewcontent.cgi?article=1096&context=nerr. Accessed August 2, 2016.
- Banda JA, Wilcox S, Colabianchi N, Hooker SP, Kaczynski AT, Hussey J. The Associations Between Park Environments and Park Use in Southern US Communities: Park Environments and Park Use. The Journal of Rural Health. 2014;30(4):369-378. doi:10.1111/jrh.12071
CrossRef - Bedimo-Rung AL, Mowen AJ, Cohen DA. The significance of parks to physical activity and public health: a conceptual model. American journal of preventive medicine. 2005;28(2):159–168.
CrossRef - Clark D. G., Sorensen A.E., Jordan R. C. Characterization of Factors Influencing Environmental Literacy in Suburban Park Users. Current World Environment. 2016;11(1):01-09. doi:10.12944/CWE.11.1.01
CrossRef - Jordan R, Sorensen A, Clark D. Urban/Suburban Park Use: Links to Personal Identity? Current World Environment. 2015;10(2):355-366. doi:10.12944/CWE.10.2.01
CrossRef - Sorensen AE, Clark D, Jordan RC. Effects of alternative framing on the publics perceived importance of environmental conservation. Frontiers in Environmental Science. 2015;3. doi:10.3389/fenvs.2015.00036
CrossRef - Stern PC, Dietz T, Abel T, Guagnano GA, Kalof L. A value-belief-norm theory of support for social movements: The case of environmentalism. Human ecology review. 1999: 6(2):81–97.
- Ajzen I. The theory of planned behavior. Organizational Behavior and Human Decision Processes. 1991;50(2):179-211.
CrossRef - Fishbein M, Ajzen I. Belief, Attitude, Intention, and Behavior: An Introduction to Theory and Research. Reading, MA: Addison - Wesley; 1975. http://people.umass.edu/aizen/f&a1975.html. Accessed January 20, 2018.
- Chua KB, Quoquab F, Mohammad J, Basiruddin R. The mediating role of new ecological paradigm between value orientations and pro-environmental personal norm in the agricultural context. Asia Pacific Journal of Marketing and Logistics. 2016;28(2):323-349. doi:10.1108/APJML-09-2015-0138
CrossRef - Lee Y, Kim S, Kim M, Choi J. Antecedents and interrelationships of three types of pro-environmental behavior. Journal of Business Research. 2014;67(10):2097-2105. doi:10.1016/j.jbusres.2014.04.018
CrossRef - Stern PC. New Environmental Theories: Toward a Coherent Theory of Environmentally Significant Behavior. Journal of Social Issues. 2000;56(3):407-424. doi:10.1111/0022-4537.00175
CrossRef - Clark D, Jordan R. An Investigation of Links between Environmentally Responsible Behaviors and Built and Natural Features of Landscape in Central New Jersey. Urban Science. 2018;2(4):114. doi:10.3390/urbansci2040114
CrossRef - Clark D.G., Jordan R.C. Public Use of Outdoor Spaces as A Function of Landscape and Demographic Factors. Current World Environment. 2018;13(2):215-223. doi:10.12944/CWE.13.2.06
CrossRef - Lindenberg S, Steg L. Normative, gain and hedonic goal frames guiding environmental behavior. Journal of Social issues. 2007;63(1):117–137.
CrossRef - Poortinga W, Steg L, Vlek C. Values, Environmental Concern, and Environmental Behavior: A Study into Household Energy Use. Environment & Behavior. 2004;36(1):70-93. doi:10.1177/0013916503251466
CrossRef - Stern MJ, Frensley BT, Powell RB, Ardoin NM. What difference do role models make? Investigating outcomes at a residential environmental education center. Environmental Education Research. 2018;24(6):818-830. doi:10.1080/13504622.2017.1313391
CrossRef - Corbett JB. Altruism, Self-Interest, and the Reasonable Person Model of Environmentally Responsible Behavior. Science Communication. 2005;26(4):368-389. doi:10.1177/1075547005275425
CrossRef - De Young R. New Ways to Promote Proenvironmental Behavior: Expanding and Evaluating Motives for Environmentally Responsible Behavior. Journal of Social Issues. 2000;56(3):509-526. doi:10.1111/0022-4537.00181
CrossRef - Gatersleben B, Steg L, Vlek C. Measurement and Determinants of Environmentally Significant Consumer Behavior. Environment and Behavior. 2002;34(3):335-362. doi:10.1177/0013916502034003004
CrossRef - Kaplan S. New ways to promote proenvironmental behavior: Human nature and environmentally responsible behavior. Journal of social issues. 2000;56(3):491–508.
CrossRef - Kilbourne W, Pickett G. How materialism affects environmental beliefs, concern, and environmentally responsible behavior. Journal of Business Research. 2008;61(9):885-893. doi:10.1016/j.jbusres.2007.09.016
CrossRef - Osbaldiston R, Sheldon KM. Promoting internalized motivation for environmentally responsible behavior: A prospective study of environmental goals. Journal of Environmental Psychology. 2003;23(4):349-357. doi:10.1016/S0272-4944(03)00035-5
CrossRef - U.S. Census Bureau. United States Census 2010. U.S. Census Bureau; 2010. http://www.census.gov/2010census/data/. Accessed September 5, 2012.
- Larson LR, Cordell HK, Betz CJ, Green GT. Children’s Time Outdoors: Results from a National Survey. 2011. http://scholarworks.umass.edu/nerr/2011/Papers/31/. Accessed August 2, 2016.
- Larson LR, Green GT, Cordell HK. Childrens time outdoors: Results and implications of the National Kids Survey. Journal of Park and Recreation Administration. 2011;29(2):1-20. http://search.proquest.com/openview/6b7bbfd2fc5ec602f2b18d7712ea69b8/1?pq-origsite=gscholar. Accessed August 2, 2016.
- Steg L, Bolderdijk JW, Keizer K, Perlaviciute G. An Integrated Framework for Encouraging Pro-environmental Behaviour: The role of values, situational factors and goals. Journal of Environmental Psychology. 2014;38:104-115. doi:10.1016/j.jenvp.2014.01.002
CrossRef - New Jersey Department of Environmental Protection (NJDEP), Office of Information Resources Management (OIRM), Bureau of Geographic Information Systems (BGIS). Land Use/Land Cover 2012 Update, Edition 20150217 Subbasin 02040302 - Great Egg Harbor, Subbasin 02040303 - Chincoteague (Land_lu_2012_hu02040302_303). February 2015.
- Laurie Sobel. Middlesex County Agriculture Development Board (CADB) Fact Sheet. Middlesex County, NJ: Middlesex County Office of Planning; 8/11:4. http://www.middlesexcountynj.gov/Government/Departments/IM/Documents/Planning%20-%20Farmland/CADB%20Fact%20Sheet.pdf. Accessed August 16, 2018.
- U.S. Geological Survey, Gap Analysis Program (GAP). Protected Areas of the United States (PAD-US), version 1.4. May 2016.
- Kinzig AP, Warren P, Martin C, Hope D, Katti M. The effects of human socioeconomic status and cultural characteristics on urban patterns of biodiversity. Ecology and Society. 2005;10(1):23.
CrossRef - Knapp TR. Canonical correlation analysis: A general parametric significance-testing system. Psychological Bulletin. 1978;85(2):410.
CrossRef - McGarigal K, Cushman S, Stafford S. Multivariate Statistics for Wildlife and Ecology Research. New York, New York: Springer Science+Business Media Inc.; 2000.
CrossRef


