Thermal Requirements and Heat Use Efficiency of Pea Cultivars under Varying Environments
Savita Devi1 , Mohan Singh1 and R K Aggarwal1 *
1
Department of Environmental Science,
Dr. YSP University of Horticulture and Forestry,
Solan,
173 220
Himachal Pradesh
India
http://dx.doi.org/10.12944/CWE.14.3.06
A study was conducted in mid hills of Himachal Pradesh during the Rabi seasons of 2017-18 and 2018-19 on a sandy loam to assess the thermal requirements and heat use efficiency of Pea cultivars under varying sowing environments & row orientations. The duration of phenological stages and accumulation of agro-climatic indices (GDD, PTU and HTU) were greatly abridged with delay in crop sowing. Among the dates of sowing, the utmost agro-climatic indices accretion was perceived in 1st December as compared to 15th December sown crop. Earlier crop sown had significantly highest heat use efficiency. Among the cultivars, PB-89 was observed highly efficient in heat use as compared to Azad-p1 and ESP-111 cultivars. Among the row orientations, the highest heat use efficiency was observed in crop sown on NS orientation. The study concluded that alterations in sowing time and row orientation are highly effective in improving heat use efficiency of Pea cultivars under changing climatic scenarios in mid hills of Himachal Pradesh.
Copy the following to cite this article:
Devi S, Singh M, Aggarwal R. K, Thermal Requirements and Heat Use Efficiency of Pea Cultivars under Varying Environments. Curr World Environ 2019; 14(3).
DOI:http://dx.doi.org/10.12944/CWE.14.3.06Copy the following to cite this URL:
Devi S, Singh M, Aggarwal R. K, Thermal Requirements and Heat Use Efficiency of Pea Cultivars under Varying Environments. Curr World Environ 2019; 14(3). Available from: https://bit.ly/2Mz6K7h
Download article (pdf)
Citation Manager
Publish History


Introduction
Pea (Pisum sativum) is a nutritious, cool season, frost-hardy and one of the most important Rabi pulse has the ability to grow in a wide range of soil and climate. It does not thrive in summer heat or low land tropical climates but, widely cultivated throughout the world in cooler high altitude tropical areas.1, 14 Pea was among the first crops cultivated by primitive man for food, forage and vegetable purpose. It is generally grown for dry seeds which ranked fourth in terms of world production of legumes after Soybeans, Peanuts & Dry beans. Every crop has its own definite requirements for particular environmental conditions for its proper growth and yield.2, 3 Temperature is one of the utmost imperative weather parameter for controlling the plant growth and development3, 15 which adversely affects photosynthesis, respiration, membrane stability, fertilization, maturity, quality of seeds and nutrient absorption.4 The concept of growing degree days is based on the concept that real time required to achieve the phenological stage is linearly related to temperature in the range between base temperature & optimal temperature. Heat and photoperiodic units are considered as the fundamental units used to examine the phenology of crops over climatic variations.5, 9 Heat use efficiency (HUE) depicted that the heat utilized to produce one unit of plant biomass.6 Heat use efficiency, i.e., efficiency of utilization of heat in terms of dry matter accretion, depends on crop type, genetic factors & sowing time & has great practical application.7 Thermal use efficiency was influenced by varying weather conditions and nutrient levels. Temperature based agro-meteorological indices such as growing degree days (GDD) and Thermal Use Efficiency (HUE) are quite useful in predicting growth and yield of different crops.
Materials and Methods
A arena experiment was steered throughout the Rabi seasons of 2017-18 and 2018-19 in the experimental farm of the Department of Environmental Science, Dr. YS Parmar University of Horticulture & Forestry Nauni (30o86'N, 77o16'E and 1275 m amsl). The climate of the area is sub-tropical to sub-temperate and semi-humid characterized by cold winters and having distinguished four major seasons in the year. The treatments comprised of two dates of sowing viz. D1 (1st December) and D2 (15th December) as main plot and three pea varieties (Azad-P1, PB-89 and ESP-111) under two row orientations i.e. O1 (North-South) and O2 (East-west) with three replication. The total no. of plots were 36 (3x2x2x3) with gross size of 3m x 2m and net sown area of 2.7m x 1.8m The crop was sown in 45 cm x 20 cm spacing in RBD design and recommended package of practices for the crop were adopted during the experiment.
Meteorological data were recorded from the Agro-meteorological Observatory, situated near the experimental farm. Agro-meteorological indices, viz. growing degree days (GDD), helio-thermal units (HTU), photo thermal units (PTU) and heat use efficiency (HUE) were computed by adopting procedure laid out by Singh et al., 2015.8
Phenology is the study of the timing of recurring of biological phasic events, the reasons of their timing with regard to biotic & abiotic forces also the interrelation amid phases of the same or different species.9 Five major phenophases from sowing to maturity viz. emergence, first node, flowering, pod formation and maturity and days taken to attain them were recorded in three pea cultivars.
Agro-meteorological indices
Different agro-meteorological indices & heat use efficiencies were calculated using following equations on daily basis and accumulated from emergence to maturity/harvesting taking 5o C as base temperature.
Growing Degree Days (GDD)
Growing degree days for different phonological stages were intended by summation of daily mean temperature above base temperature (5oC) for a corresponding period from emergence to maturity.
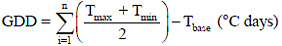
Where,
Tmax = Daily maximum temperature (°C)
Tmin = Daily minimum temperature (°C)
Tbase = Minimum threshold/base temperature taken as 5oC for pea crop
Helio-thermal unit (HTU)
Helio-thermal unit at different phenological stages was calculated by using the formula
HTU = GDD × BSS (o C day hr)
Where, BSS are Bright Sunshine hours
Photo-thermal unit (PTU)
Photo-thermal unit at different phenological stages was calculated by using the formula
PTU = GDD × DL (°C day hr)
Where, DL is the maximum possible day length hours at the experimental site
Heat use efficiency (HUE)
The heat use efficiency is the extent of above ground dry matter formed per degree-day. It was intended by using the following formula:
Heat Use Efficiency (g/m2/°C day) = 
Where, AGDD = Accumulated growing degree days (°C day)
Results and Discussion
Crop Phenology
The results discovered that the early sown crop took more number of days from pod filling to physiological maturity as compared to late sown crop because early sown crop almost matures early by preventing the higher temperature at later growth stages (Table 1).
The physiological maturity of PB-89, Azad-p1 and ESP-111 was observed 113,115 and 121 DAS under first date of sowing, 109,107 and 114 under second date of sowing respectively (Table1). With delay in sowing, cultivars took less number of days from pod filling to physiological maturity due to high temperature.10
Table 1: Phenological calendar of Pea cultivars under varying sowing environments
|
Phenophases |
D1 (1st December) |
D2 (15th December) |
||||
|
V1 (Azad P-1) |
V2 (PB 89) |
V3 (ESP 111) |
V1 (Azad P-1) |
V2 (PB 89) |
V3 (ESP 111) |
|
|
Days |
Days |
Days |
Days |
Days |
Days |
|
|
Emergence |
12 |
12 |
14 |
13 |
12 |
14 |
|
First Node |
25 |
26 |
27 |
25 |
23 |
27 |
|
Flowering |
76 |
77 |
80 |
74 |
70 |
77 |
|
Pod Formation |
94 |
96 |
103 |
95 |
90 |
99 |
|
Maturity |
113 |
115 |
121 |
109 |
107 |
114 |
|
CD 0.05 |
0.03 |
0.05 |
0.07 |
0.02 |
0.02 |
0.06 |
Growing Degree Days (GDD)
Crop duration and accumulated heat units during the entire growth period of Pea cultivars reduced with delay in sowing from 1st to 15th December (Table 2). The perusal of data indicated that the crop sown on 1st December accumulated more growing degree days as compared to 15th December sown crop in all the varieties. To attain physiological maturity Azad-P1 accumulated 911.86 and 869.57 growing degree days, PB-89 accumulated 895.10 and 883.13 growing degree days and ESP-111 accumulated 986.80 and 978.71 growing degree days under first and second date of sowing respectively.
Heliothermal Units (HTU)
The perusal of the data given in Table 1 indicated that the crop sown on the 1st December consumed more HTU as compared to the crop sown on 15th for all the varieties. To complete physiological maturity Azad-P1 accumulated 6885.70 and 3620.10 HTU, PB-89 accumulated 6674.70 and 6530.47 HTU and ESP-111 accumulated 7283.83 and 7261.27 HTU under first and second date of sowing respectively. Reduction in HTU under late sowing settings indicated that the crop used more heat units under crop sown early rather than later crop growth stages.11
Photothermal Units (PTU)
To complete physiological maturity Azad-P1 accumulated 10045.73 and 9657.00 PTU, PB-89 accumulated 9359.10 and 9646.10 PTU and ESP-111 accumulated 10545.10 and 10532.60 PTU under first and second date of sowing respectively (Table 2). Variety ESP-111 consumed more PTU as compared to other varieties due to late maturity. Among the dates of sowing, accumulated PTU were higher in first date of sowing than second date of sowing, due to reduction in crop duration in second date of sowing.
Heat Use Efficiency (HUE)
The heat use efficiency (HUE) indicated capacity of the plant to harvest dry matter per unit of heat use. The HUE was computed at different phonological stages of three pea cultivars under different environment (D1 and D2) and two row orientations were given in Table 3.
Table 2: Thermal units accumulated for different phenophases under varying sowing environments.
|
Treatments |
Days taken |
GDD (oC day) |
HTU (oC day hrs) |
PTU (oC day hrs) |
HYTU (oC day hrs) |
PTI (oC day day-1) |
|
|
Sowing to emergence |
|||||||
|
V1 |
D1 |
13.6 |
103.2 |
731.3 |
1020.5 |
5843.6 |
8.01 |
|
D2 |
12.2 |
90.7 |
557.3 |
921.8 |
3683.7 |
7.62 |
|
|
V2 |
D1 |
13.5 |
96.2 |
557.7 |
938.5 |
5793.3 |
8.11 |
|
D2 |
12.3 |
90.7 |
715.1 |
924.4 |
3355.8 |
7.62 |
|
|
V3 |
D1 |
14.8 |
103.6 |
790.5 |
1066.8 |
6695.1 |
8.03 |
|
D2 |
14.4 |
103.1 |
613.1 |
1045.9 |
3844.3 |
7.50 |
|
|
Mean |
13.5 |
97.9 |
660.8 |
986.3 |
4869.3 |
7.8 |
|
|
CD 0.05 |
0.04 |
0.25 |
3.82 |
24.5 |
220.2 |
0.03 |
|
|
Emergence to first node |
|||||||
|
V1 |
D1 |
13.6 |
191.7 |
1291.0 |
1949.5 |
9,796.3 |
6.64 |
|
D2 |
12.2 |
160.6 |
1176.1 |
1655.6 |
5,989.6 |
4.75 |
|
|
V2 |
D1 |
14.5 |
198.3 |
1325.9 |
2021.6 |
10,475.8 |
6.70 |
|
D2 |
11.3 |
149.6 |
1116.2 |
1557.3 |
5,584.5 |
5.26 |
|
|
V3 |
D1 |
13.8 |
205.3 |
1344.7 |
2069.8 |
10,559.7 |
6.70 |
|
D2 |
13.4 |
174.7 |
1325.4 |
1740.7 |
6,369.0 |
4.75 |
|
|
Mean |
13.1 |
180.0 |
1263.2 |
1832.4 |
8129.2 |
5.8 |
|
|
CD 0.05 |
0.05 |
0.26 |
3.59 |
50.8 |
314.9 |
0.26 |
|
|
First node to flowering |
|||||||
|
V1 |
D1 |
51.6 |
502.2 |
3645.5 |
5174.9 |
20,485.6 |
6.76 |
|
D2 |
49.1 |
491.1 |
3484.8 |
5053.0 |
18,437.2 |
5.75 |
|
|
V2 |
D1 |
51.8 |
499.6 |
3504.5 |
5170.2 |
21,666.3 |
6.46 |
|
D2 |
47.6 |
462.5 |
3424.7 |
4745.4 |
16,424.6 |
5.83 |
|
|
V3 |
D1 |
53.8 |
532.6 |
3811.6 |
5451.7 |
21,494.0 |
7.23 |
|
D2 |
50.4 |
523.6 |
3710.1 |
5445.2 |
19,540.0 |
6.17 |
|
|
Mean |
50.7 |
501.9 |
3596.9 |
5173.4 |
19674.6 |
6.4 |
|
|
CD 0.05 |
0.06 |
0.6 |
7.63 |
57.6 |
532.8 |
0.25 |
|
|
Flowering to pod formation |
|||||||
|
V1 |
D1 |
21.9 |
730.8 |
5429.8 |
7747.4 |
26,729.3 |
10.7 |
|
D2 |
18.4 |
660.5 |
3531.1 |
6844.0 |
22,366.6 |
9.45 |
|
|
V2 |
D1 |
20.7 |
678.4 |
4941.3 |
7157.7 |
28,285.7 |
10.4 |
|
D2 |
19.5 |
675.3 |
4670.6 |
7057.2 |
22,562.6 |
9.36 |
|
|
V3 |
D1 |
23.4 |
772.5 |
5652.9 |
8366.2 |
27,665.2 |
10.7 |
|
D2 |
22.2 |
758.6 |
5428.7 |
8062.8 |
21,808.1 |
8.15 |
|
|
Mean |
21.0 |
712.7 |
4942.4 |
7539.2 |
24902.9 |
9.8 |
|
|
CD 0.05 |
0.05 |
0.11 |
10.04 |
53.6 |
508.8 |
0.18 |
|
|
Pod formation to maturity |
|||||||
|
V1 |
D1 |
19.8 |
911.8 |
6885.7 |
10045.7 |
34,526.3 |
12.7 |
|
D2 |
14.4 |
869.5 |
3620.1 |
9657.0 |
30,695.7 |
10.8 |
|
|
V2 |
D1 |
19.6 |
895.1 |
6674.7 |
9359.1 |
33,418.9 |
12.21 |
|
D2 |
17.3 |
883.1 |
6530.4 |
9646.1 |
29,834.3 |
11.5 |
|
|
V3 |
D1 |
18.8 |
986.8 |
7283.8 |
10545.1 |
34,828.6 |
14.2 |
|
D2 |
15.4 |
978.7 |
7261.2 |
10532.6 |
21,649.4 |
12.3 |
|
|
Mean |
17.6 |
920.8 |
6376.0 |
9964.3 |
30825.5 |
12.3 |
|
|
CD 0.05 |
0.04 |
0.67 |
20.6 |
272.3 |
458.6 |
0.15 |
|
The HUE of V1D1 under NS orientation was 6.76 for dry matter accumulated in Pod and 3.68 in seed and under EW orientation it was 6.40 and 3.59 for Pod & Seed, respectively. The HUE of V1D2 under NS orientation was 6.38 for dry matter accumulated in Pod and 3.49 in seed and under E-W orientation it was 5.48 and 3.21 for Pod & Seed, respectively. The HUE of V2D1 under NS orientation was 6.97 for dry matter accumulated in Pod and 3.78 in seed and under EW orientation it was 6.71 and 3.62 for Pod & Seed, respectively.
Table 3: Effect of sowing environments & row orientations on heat use efficiency of Pea cultivars
|
Treatments |
Heat use efficiency (g m-2 0C Day-1) |
|||
|
Pod |
Seed |
|||
|
V1 |
D1 |
NS |
6.76 |
3.68 |
|
EW |
6.40 |
3.59 |
||
|
D2 |
NS |
6.38 |
3.49 |
|
|
EW |
5.48 |
3.21 |
||
|
V2 |
D1 |
NS |
6.97 |
3.78 |
|
EW |
6.71 |
3.62 |
||
|
D2 |
NS |
6.95 |
3.74 |
|
|
EW |
6.23 |
3.58 |
||
|
V3 |
D1 |
NS |
5.99 |
3.20 |
|
EW |
5.44 |
2.14 |
||
|
D2 |
NS |
5.64 |
2.16 |
|
|
EW |
4.72 |
2.08 |
||
|
CD 0.05 |
0.02 |
0.01 |
||
The HUE of V2D2 under NS orientation was 6.95 for dry matter accumulated in Pod and 3.74 in seed and under EW orientation it was 6.23 and 3.58 for Pod & Seed, respectively. The HUE of V3D1 under NS orientation was 5.99 for dry matter accumulated in Pod and 3.20 in seed and under EW orientation it was 5.44 and 2.14 for Pod & Seed, respectively. Similarly, the HUE of V3D2 under NS orientation was 5.64 for dry matter accumulated in Pod and 2.16 in seed and under EW orientation it was 4.72 and 2.08 for Pod & Seed, respectively. Reduction in HUE under late sown conditions designates that the crop used heat more efficiently under early crop as compared to late sown conditions. The early sown crop has highest heat use efficiency and it decreased with delay in sowing.12
Relationship between heat units and seed yield
Grain yield produced by a crop depends up on the heat units accumulated during their growth period. Accumulated growing degree days explained 66.1 per cent variation in grain yield (Fig 1). Similar relation with the grain yield was observed for other thermal indices like HTU, and PTU. A significant positive correlation (R2 = 0.67) between GDD and grain yield was reported by Srivastava et al. (2005).13
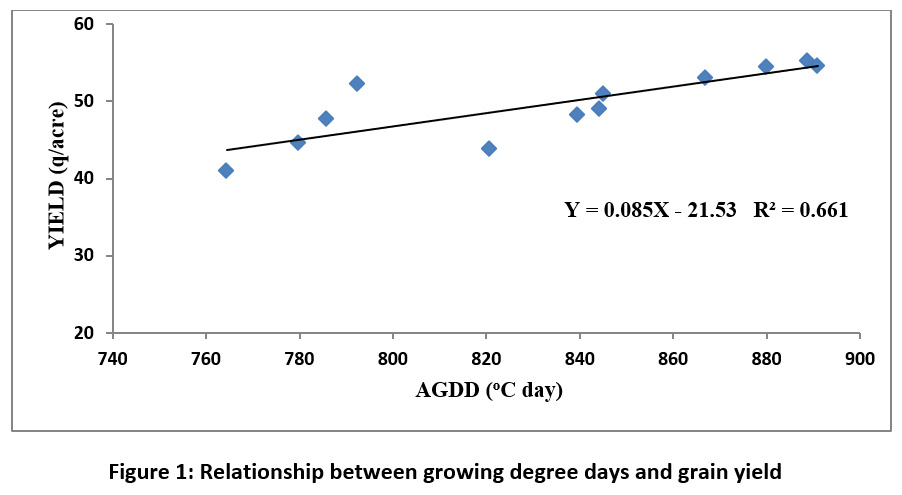 |
Figure 1: Relationship between growing degree days and grain yield Click here to view Figure |
Conclusions
The present study indicated that the date of sowing played a very important role in determining the arrival of different phenological stages as well as pod and grain yield of Pea cultivars. The timely crop sowing took higher number of days and thermal times as compared to delayed sowing for attaining different phenophases and physiological maturity. More that 66 per cent variation in pod and grain yields of pea cultivars were explained by different thermal units. Timely or early crop sowing gave better yield both in respect of pod and grain. And NS directions give more yields as compared to EW directions. Heat use efficiency was higher in NS rather than EW.
Acknowledgement
The facilities provided by Department of Environmental Science, Dr. YSP University of Horticulture & Forestry, Nauni (Solan) HP are highly acknowledged.
Conflict of Interest
There is no conflict of interest
References
- Oelke E, Oplinger E, Hanson C, Davis D, Putnam D, Fuller E and Rosen C.199 Alternative field crops manual, madison, wisconsin. Cooperative Extension Service University of Wisconsin-Madison.110 p.
- Razzaq, A. Shah P, Khan SB, Saeed K and Mohammad D. 1986. Effect of planting time on the growth and straw yield of wheat varieties. Sarhad Journal of Agriculture, 2: 327-334.
- Zinn, KK, Tunc-ozdemir M and Harper JF. 2010. Temperature stress and plant sexual reproduction: uncovering the weakest links. Journal of Environmental and Experimental Botany, 61: 1959-1968.
- Basu PS, Ali M and Chaturvedi SK. 2011. Terminal heat stress adversely affects chickpea productivity in northern India: Strategies to improve thermo tolerance in the crop under climate change. ISPRS Archives XXXVIII-8/W3 Workshop Proceeding: Impact of Climate Change on Agriculture pp. 189-193.
- Sreenivas G, Reddy MD and Reddy DR. 2010. Agrometeorological indices in relation to phenology of aerobic rice. Journal of Agrometerology ,12: 241-244.
- Rajbongshi R, Neog P, Sarma PK, Sarmah K, Sarma MK, Sarma D and Hazarika M. 201 Thermal indices in relation to crop phenology and seed yield of pigeon pea (cajanus cajan L millsp.) grown in the north bank plains zone of Assam. Mausam 672: 397-404.
- Rao VUM, Singh D and Singh R. 1999. Heat use efficiency of winter crops in Haryana. Journal of Agrometeorology, 1: 143-148.
- Singh M, Niwas R, Godara AK, and Khichar ML 2015. Pheno-thermal response of plum genotypes in semi arid region of Haryana. Journal of Agrometeorology, 17: 230-233.
- Leith H. 1974. Phenology and seasonality modeling. - Springer, NY.
- Dhaliwal, L.K., 2002. Crop-weather-aphid interaction in raya (Brassica juncea L.) under different hydro-thermal environments. Ph.D. Dissertation, Punjab Agricultural University, Ludhiana, India.
- Solanki, NS and Mundra SL. 2015. Phenology and productivity of mustard (Brassica juncea L.) under varying sowing environments and irrigation levels. Annals of Agricultural Research New Series, 36: 312-317.
- Keerthi, P., Pannu, R.K., Singh, R. and Dhaka, A.K., 2016. Thermal requirements, heat use efficiency and plant responses of Indian mustard (Brassica Juncea L.) for different levels of nitrogen under different environments. J. Agromet., 18(2): 201-05
- Srivastava AK, Chakravarty NVK, Sharma PK, Bhagavati G, Prasad RN, Gupta VK, Sutradhar AK, Subbarao YV and Chopra UK. 2005. Relation of Growing Degree days with Plant growth and yield in mustard varieties grown under a Semi-arid environment. Journal of Agricultural Physics, 5: 23-28.
- Rao VUM, Singh D and Singh R.1999. Heat use efficiency of winter crops in Haryana. Journal of Agrometeorology 1:143-148.
- Singh D, Singh R and VUM Rao. 2004. Radiation characteristics studies over mustard crop. Journal of Agrometeorology 6:21-24.


