An Analysis of GRAP Task Force Directions for Improved AQI in Delhi during 2018
Yogender Singh1
and Umesh Kulshrestha1
*

http://dx.doi.org/10.12944/CWE.15.1.06
Air quality has been a matter of public concern in Delhi. The concentration of Particulate Matters (PM2.5 and PM10) often surpasses the Indian National Ambient Air Quality Standards (NAAQS). This study is focused upon the evaluation of Environment Pollution (Prevention and Control) Authority (EPCAs) Graded Response Action Plan (GRAP) action during 2018 in terms of PM2.5 and NO2. In order to control air pollution sources in National Capital Region (NCR), the (EPCA) Environmental Pollution (Prevention and Control) Authority directed GRAP to advise the local industries and other sources of pollution to close their operations on particular dates whenever Air Quality Index (AQI) showed severe level. In this study, we have analyzed 24 hourly averaged Air Quality Index (AQI) data for the period September 2017 - January 2018 and September 2018 - January 2019 at two sites i.e. Delhi Technical University (DTU) and Income Tax Office (ITO) respectively. The GRAP results showed a significant decrease in AQI values of both after every order passed by GRAP task force. In general, the PM2.5 AQI values were always higher during year 2017-18 as compared to 2018-19 at both sites.
Copy the following to cite this article:
Singh Y, Kulshrestha U. An Analysis of GRAP Task Force Directions for Improved AQI in Delhi during 2018. Curr World Environ 2020; 15(1). DOI:http://dx.doi.org/10.12944/CWE.15.1.06
Copy the following to cite this URL:
Singh Y, Kulshrestha U. An Analysis of GRAP Task Force Directions for Improved AQI in Delhi during 2018. Curr World Environ 2020; 15(1). Available from: https://bit.ly/2Usyvl4
Download article (pdf) Citation Manager Publish History

Introduction
Air quality standards
The issue of air quality in the National Capital Region (NCR) Delhi is a matter of public concern. Poor air quality has various harmful effects on the environment and human health causing smog, acid rain, reduced visibility and increasing premature deaths, asthma attacks and chronic respiratory illness.1,2,3 In general, poor air quality of Delhi is due to high concentrations of the PM2.5 and PM10 which have been reported violating the limits of National Ambient Air Quality Standards (NAAQS).4,5 The soil dust, road dust, and construction site dust contribute to the high loadings of particulates in this region6,7 other sources such as local industries, automobiles, vehicles, generator sets; brick kilns etc are also responsible for the contribution of air pollutants.8,9 The burning of crop residues in neighboring states also adversely affects the air quality of Delhi region post-monsoon season.10 In the NCR, among other pollutants, it has been reported that the PM2.5 has greater potential on health effects and respiratory system than the corresponding particles PM10.11,12 In the guideline of the World Health Organization (WHO) and the NAAQS under the USEPA, the recommended levels for PM2.5 and PM10 based on 24 hourly and annual observations have already been mentioned. Several studies have considered these levels as baseline, where results have been provided by making comparison with respect to the prescribed level only. However, the need of chemical speciation of PM2.5 has been emphasized in order to differentiate its natural vs anthropogenic constituents.13
Other important pollutant is NO2 which has been reported with increasing trends in Delhi.14,15,16 According to reports, the levels of NO2 are increased, primarily because of number of vehicles are increased drastically.6 The number of vehicles is increased from 24, 32,295 in 1994 to 80, 52,508 in 20146 and further 10 million vehicles till March 2018.17 The increase in NO2 levels affects human health, acid deposition and ozone chemistry.18 NO2 is contributed by the combustion sources such as industrial and automobiles etc.19,20 NO2 causes respiratory health effects. NO2 also has an important role in tropospheric ozone and smog formation.21,22 Due to increase in NO2, NO3 concentration in rain water has been reported 11 times higher in 2011 as compare to 1994.23
In Indian context, the Central Pollution Control Board (CPCB, Govt. of India) has been monitoring the daily air quality and several stations which have been mandated to the monitoring purpose as well. The Indian NAAQS (under the CPCB) have already been established the standard levels of major air pollutants in ambient environment.24 In NAAQS of the CPCB notification 2009, limits have been prescribed for these pollutants for two categories i.e. i) industrial/ residential area and ii) ecologically sensitive areas. In general, the government has taken several measures or air pollution mitigation to improve the air quality of Delhi including the introduction of unleaded petrol, phasing out old commercial vehicles, low sulphur diesel; compressed natural gas (CNG) based vehicles etc. Other such efforts include implementation of Bharat stage-IV (BS-IV), phasing out 15 year old vehicles, ambient air fund, prohibiting burning of leaves and plastics in open, promotion of gas based thermal power plants, restriction on diesel trucks, ban on petcocks, ban on diesel generator sets etc.9,25 The very popular mitigation step has been Odd- Even rule introduced by government of Delhi two times, first time during 1st January to 15th January 2016. The second round of Odd-Even was implemented during 15th April to 30th April 2016. All These odd even campaigns could not bring the required quality of air. However, due to less number of vehicles plying on roads, the running time was saved. Also, these campaigns were able to mobilize and encash the sentiments of people and probably, could reflect the proactivness of the government.25
Graded Response Action Plan (GRAP)
In order to reduce air pollution in Delhi-National Capital Region (NCR), Graded Response Action Plan (GRAP) is introduced recently which is directed by the Environment Pollution Control Authority (EPCA). Various agencies such as CPCB, the Civic Agencies and Urban Development Department, Transport Department, Pollution Control Committee of Delhi and Traffic Police are responsible to implement the plan.17
The task Force on Graded Response Action Plan (GRAP) holds meetings frequently. The recommended actions to be implemented in the field accordingly. Last year GRAP task force has conducted several meetings between November 2018 and January 2019 and directed for taking action. The GRAP has been notified by government for Delhi-NCR which comprises measures such as restriction on entry of trucks into Delhi; ban on construction activities, introduction of odd-even scheme for vehicles, closure of schools during severe condition, closure of brick kilns and stone crushers; ban on diesel generator sets and burning in landfills and parks.9 The GRAP task force also ensures the enforcement of Graded Response Action Plan (GRAP) in NCR as per the pollution levels. However, stopping open burning of plastic and polythene has been reported as a trigerer of ozone spikes at industrial and residential areas.26
Though the CPCB and SAFAR have been calculating AQI for various pollutants, but in order to obtain a comparative scenario, only the daily and monthly AQI data for PM2.5 and NO2 are considered in this study for two sites i.e. Delhi Technological University (DTU) and Income Tax Office (ITO) during the period from September 2017 to January 2018 and September 2018 to January 2019. In this study we are presenting the effectiveness of GRAP and a comparison of AQI or PM2.5 and NO2 at both the sites. We selected PM2.5 and NO2 for this study, as these two criteria pollutants are the prime air quality indicators for Delhi. PM2.5 levels affect our inner bronchial region, sometimes resulting in acute and chronic respiratory diseases.27
Methodology
Sites description and methods
Figure 1 shows the map of study area i.e. Delhi Technical University (DTU) and Income Tax Office (ITO).
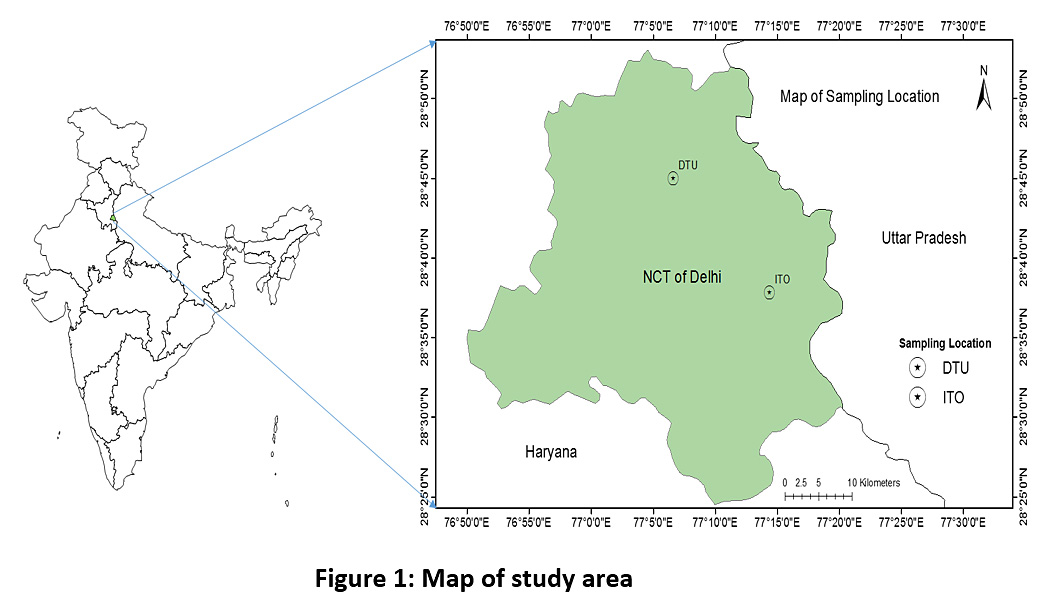 |
Figure 1: Map of study area Click here to view Figure |
The hourly AQI data for the selected period were downloaded from the website of Central Pollution Control Board, India.28 There are over 38 total sampling sites in Delhi out of which 24 sites are monitored by DPCC, 6 by IMD and the remaining 8 sites are monitored by CPCB. Amng eight sampling sites, monitored by CPCB, two sites i.e. DTU and ITO were selected for the present study because of their specific urban characteristics. The DTU site is located in an industrial area while the ITO site is located at a very heavy traffic junction. The monitoring protocol of the network records 8 pollutants (PM2.5, PM10, SO2, NO-NO2-NOx, NH3, CO, O3 and BTEX), but we selected PM2.5 and NO2 for this study, as these two criteria pollutants are the prime air quality indicators for Delhi air.
The measurements of PM2.5 and NO2 along with other parameters are carried out by online analyzers (cbcp.nic.in). The principle of measuring PM2.5 is based on β-ray attenuation technique through which continuous measurement of ambient particulate matters can be obtained. The, particulate matter is sampled through the inlet of the instrument and is collected on the fiberglass filter tape. The β-ray radiation value is measured by scintillation/G.M. counter before and after sampling. Internal microprocessor handles all sequences and automatically calculates the concentration of PM2.5 (cbcp.nic.in). NO2 measurements are carried out by using NOX analyzer which works on chemiluminiscence principle. The NO2 sampler consists of 10 ports manifold and fitted with suction pump to draw ambient air and moisture removal system.
Data analysis method
The downloaded hourly datasets were reformatted after which daily and monthly averaged values were computed using Microsoft excel. Descriptive statistics was applied to daily and monthly average datasets in order to determine the nature of variations and trends. It is pertinent to mention here that the descriptive statistics is useful to assess the central tendency (mean, mode etc.) and variability of the given dataset. Special attention was given to capture the variation pattern of AQI before and after GRAP (Graded Response Action Plan) orders. The variations of AQI values of the selected pollutants were shown using area graph and descriptive statistics. Date for the period of Sep-2017 to Jan-2018 (Non GRAP period i.e. 153 days of these 5 months) and Sep-2018 to Jan-2019 (GRAP period i.e. 153 days of these 5 months) of study parameters (PM2.5 and NO2) at various selected study sites were considered for the present study. The missing and outlier values of the downloaded dataset of pollutants were ignored and remaining data points were subjected to analysis.
Results and Discussion
AQI of PM2.5 and NO2 after GRAP
Table 1 details of GRAP task force meetings and the AQI values after the directed actions. The results showed that after the suggested actions, the AQI values reduced noticeably falling under moderate and satisfactory categories. In November 2018, EPCA conducted two Meetings on 12 and 14 November 2018 when AQI was very high under severe condition. Hence, GRAP came into an action who laid down rules for traffic, constructions and industries. In response to the strict implementation of GRAP by the EPCA, significant improvement was seen in AQI. Figure-2 shows that how the values of AQI were decreased after every GRAP task force meeting at both the study sites. Similarly, after the GRAP meeting held on 24, 27 and December 30th 2018 or 3 and 18 January, 2019, the AQI values decreased. Every time the result showed the decreasing AQI values except 12th November 2018 for PM2.5 and 3rd January 2019 for NO2 at DTU site. At ITO site, data of 12 November 2018 was not available for both criteria pollutants as shown in Table 1. But during remaining six dates, pollution level was noticed decreasing indicating that GRAP actions were successfully working.
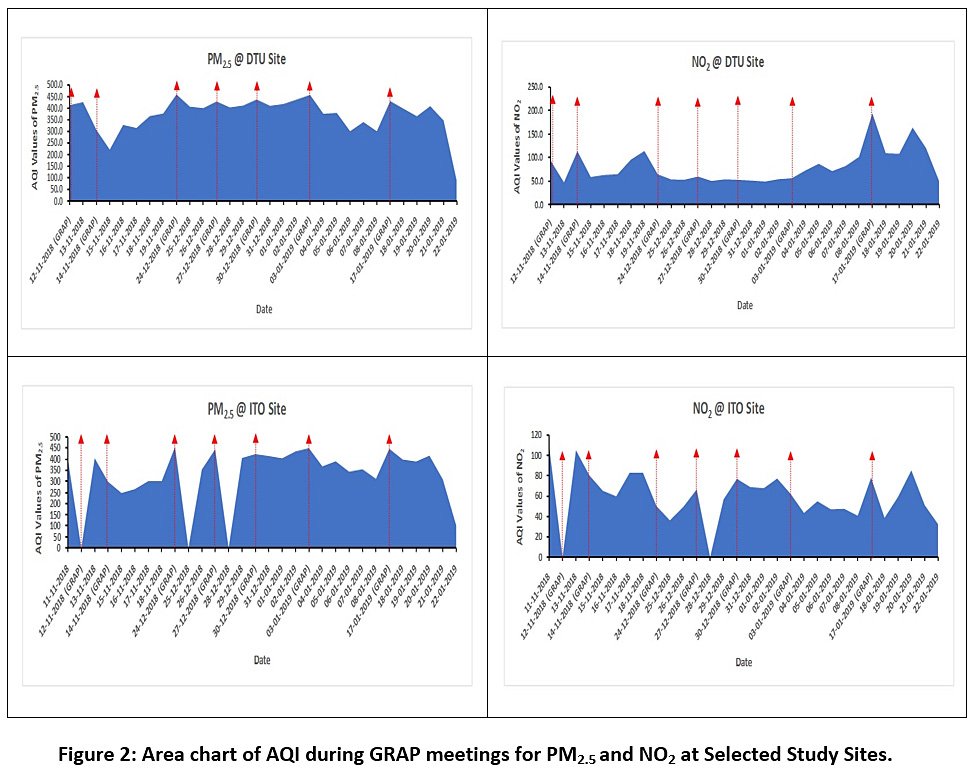 |
Figure 2: Area chart of AQI during GRAP meetings for PM2.5 and NO2 at Selected Study Sites. Click here to view Figure |
Table 1: PM2.5 and NO2 variations during and after GRAP meetings at DTU and ITO sites.
|
Dates of GRAP Order Implementation |
PM2.5 |
NO2 |
||||||||||
|
DTU Site |
ITO Site |
DTU Site |
ITO Site |
|||||||||
|
AQI before GRAP |
AQI after GRAP |
% Relative difference |
AQI before GRAP |
AQI after GRAP |
% Relative difference |
AQI before GRAP |
AQI after GRAP |
% Relative difference |
AQI before GRAP |
AQI after GRAP |
% Relative difference |
|
|
12-11-2018 |
412.3 |
425.4 |
3.1 |
0 |
0 |
0 |
93.8 |
47.2 |
-49.6 |
0 |
0 |
0 |
|
14-11-2018 |
305.8 |
221.3 |
-27.6 |
297.5 |
247.1 |
-16.9 |
113.8 |
58.5 |
-48.5 |
80.5 |
65.3 |
-18.8 |
|
24-12-2018 |
458.8 |
405.9 |
-11.5 |
454.2 |
352.5 |
-22.3 |
64.2 |
53.3 |
-16.9 |
50.1 |
36.1 |
-27.9 |
|
27-12-2018 |
428.1 |
402.7 |
-5.9 |
444.3 |
404.6 |
-8.9 |
59.5 |
50.2 |
-15.6 |
66.6 |
56.7 |
-14.8 |
|
30-12-2018 |
436.9 |
409.4 |
-6.2 |
422.0 |
413.2 |
-2.0 |
52.5 |
51.0 |
-2.8 |
77.1 |
68.8 |
-10.7 |
|
03-01-2019 |
456.8 |
375.6 |
-17.7 |
448.6 |
367.0 |
-18.1 |
56.0 |
72.6 |
29.6 |
62.2 |
43.4 |
-30.2 |
|
17-01-2019 |
430.0 |
397.1 |
-7.65 |
446.2 |
397.8 |
-10.8 |
194.8 |
109.3 |
-43.8 |
78.3 |
38.6 |
-50.7 |
AQI frequency during 2017-18 and 2018-19 at DTU and ITO sites
Table 2 describes the AQI categories used for PM2.5 and NO2 pollutants around the world. India has fixed the value of severe category same as China and USA. European Union (EU) has decided severe conditions for their citizens when particulate matter AQI is touched 60, and good below 10. Similarly, in case of NO2, the lower value of AQI are different for different countries i.e. 40 for India, 50 for (EU), 80 for China and there is no lower limits are set by (USA) for NO2. The limit of severe conditions the set by above mentioned countries also had a lot of difference. India and EU have decided severe conditions in case of NO2 AQI crosses 400. The AQI value NO2 in China is 565 for severe category while in USA it is beyond 3760.
Table 2: AQI standards used for PM2.5 and NO2 globally by different countries.
|
Country |
AQI Category (Range) |
PM2.5 |
NO2 |
|
India |
Good Hazardous/Severe |
30 250+ |
40 400+ |
|
China |
Good Hazardous/Severe |
35 250+ |
80 565+ |
|
United States of America (USA) |
Good Hazardous/Severe |
35 250+ |
- 3760 |
|
European Union (EU) |
Good Hazardous/Severe |
10* 60+* |
50* 400+* |
*The exposure time for both PM2.5 and NO2 is 8 hours in European Union, while the Exposure time for remaining countries is 24 hours for both the pollutants.
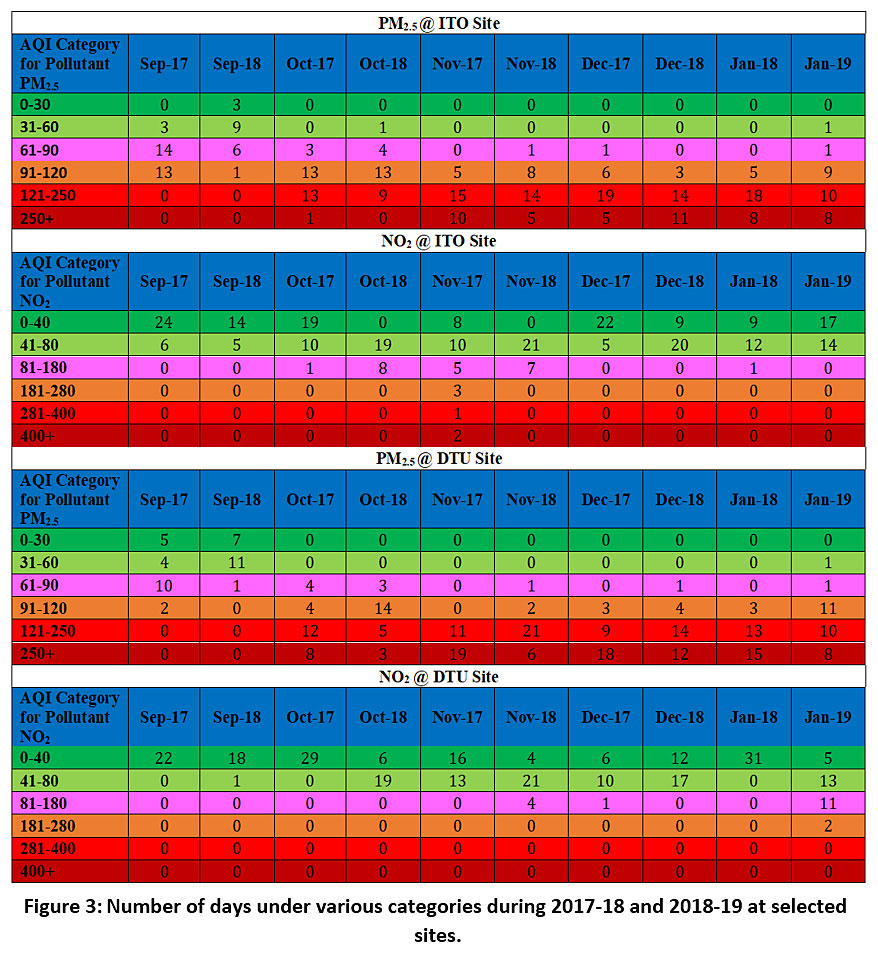 |
Figure 3: Number of days under various categories during 2017-18 and 2018-19 at selected sites. Click here to view Figure |
Figure 3 gives a comparison of category wise frequency of days during period of 2017-18 and 2018-19 for the pollutants PM2.5 and NO2 at DTU and ITO sites. Figure 3 gives category for pollutants with the help of range of concentration and by the color code. On the basis of concentration and color coding CPCB divided pollution in six different categories.29 AQI of PM2.5 from 0-30, dark green color for good category, from 31-60, light green color for satisfactory, 61-90, pink color shows moderate category, 91-120, orange color for poor category, red color and concentration between 121-250 shows pollution enters into very poor category and in last when pollution level covers concentration more than 250 it is considered in severe category which is shown in by crimson red color. In case of pollutant NO2 the color code is same for all categories but values are different for all categories which are described below. The AQI between 0-40 for good, 41-80 for satisfactory, 81-180 for moderate, 181-280 for poor, 281-400 for very poor and more than 400 for severe condition.
Total number of days at ITO site from September 2017 to January 2018 for which data is available for pollutant PM2.5 were 152 out of these only 21 days were found under good, satisfactory and moderate categories and remaining 131 days are in poor, very poor and severe categories. On the other hand, data available for the period from September 2018 to January 2019 only for 131 days out of which 27 days are lies in good-moderate while remaining 104 are in between poor and severe category. At DTU site the number days was 140 and 136 for which data was available for year 2017-18 and 2018-19. Out of these only 23 days were counts in good, satisfactory and moderate categories for September 2017 to January 2018 and 26 days for September 2018 to January 2019. Remaining 113 days are in poor, very poor and severe category during 2017-18 and 110 days during 2018-19.
NO2 data was available 138 and 134 days during for period 2017-18 and 2018-19 respectively. Out of which 132 days were under moderate category and 6 are under poor and sever category for 2017-18, 134 days are recorded under moderate category and not a single day was counted in other category during 2018-19. At DTU site 128 and 133 days data was available for the same period. Out of which all 128 days recorded under poor, very poor and severe category during 2017-18. At DTU site from September 2018 to January 2019 only two days were recorded in poor category while remaining 131 are in good, satisfactory and moderate categories.
AQI variation of PM2.5 and NO2 at DTU site
AQI of PM2.5
Figures 4-7 show daily average AQI for PM2.5 and NO2 at the Delhi Technical University (DTU) and Income Tax Office (ITO) sites for the years 2017-18 and 2018-19. We noticed a large range of AQI at both the sites during all the months. During 2017 and 2018 September month at DTU site AQI values for PM2.5 were “between” 20-200. In October month during 2017 and 2018, the AQI values recorded between 200 and 400, but in the month of November again we found a huge difference between minima-maxima. In November 2017, the AQI values were recorded between 350 and 500 or in 2018, between 200 and 425. Interestingly, during December and January months, there was no noticeable difference in the AQI of PM2.5 between 2017-18 and 2018-19. The high particulate matter in northern India is quite obvious due to higher loadings of atmospheric dust.6 Due to this reason Aerosol optical Depth (AOD) values has also been recorded distinctly different in south versus north India.7
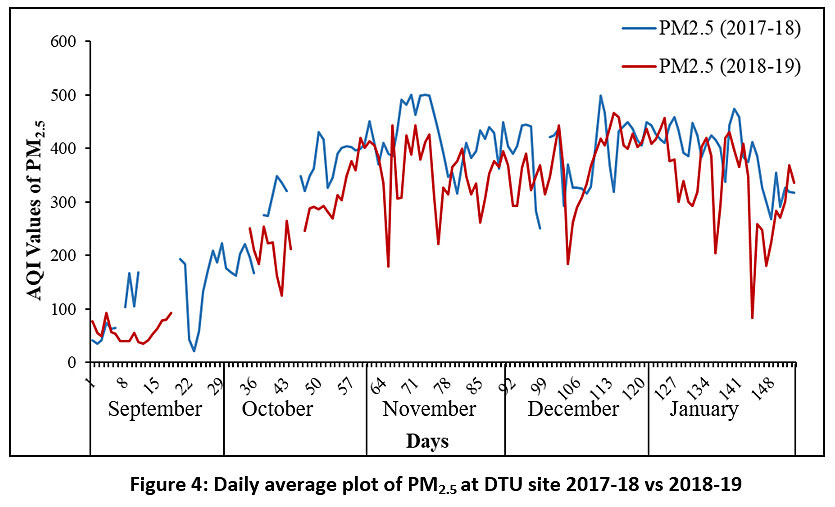 |
Figure 4: Daily average plot of PM2.5 at DTU site 2017-18 vs 2018-19. Click here to view Figure |
AQI of NO2
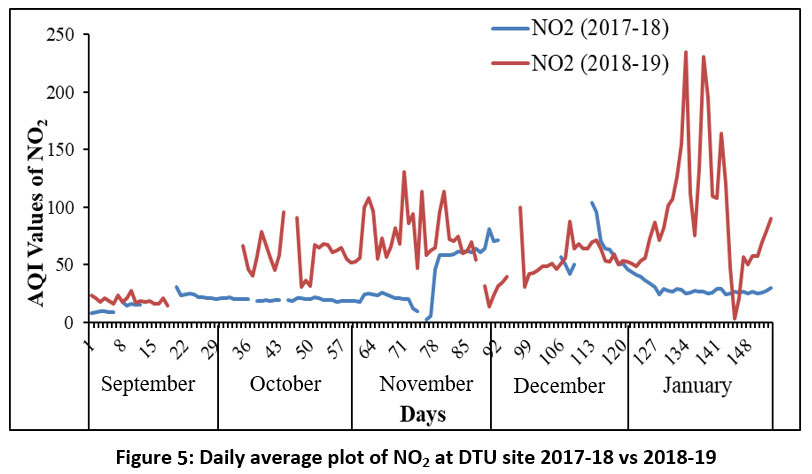 |
Figure 5: Daily average plot of NO2 at DTU site 2017-18 vs 2018-19. Click here to view Figure |
ITO site
AQI of PM2.5
The AQI values at ITO site indicated that PM2.5 was high during month of December 2018. In December 2018, the AQI value was not very different from 2017 December. In December 2017, there is a small decrease in the average AQI value of PM2.5 which was 341. While in December 2018, the average AQI recorded was 371. Fig. 6 shows that during winter months i.e. December and January for 2017-18 and 2018-19, the AQI values were almost similar because of atmospheric conditions such as temperature inversion etc. which can trap the pollutants near the surface of earth, low wind speed due to which dispersion of pollutants is not possible, and dimming of sun light effect the conversion of various oxides. In general, SO2 and NO2 are considered major gases contributing towards PM2.5 or finer ranged particles but the SO2 levels in Delhi region are very low. With respect to NAAQS reason is probably the SO2 is adsorbed onto calcium carbonate rich dust particles forming calcium sulphate in coarse mode.30 Due to this reason PM2.5 contributed by SO2 is very low in fine range.32 Morphological and elemental studies reveal that the dust is composed of spherical (smooth surface), round (rough surface) and irregular shapes of particles indicating the dominance of crystal sources.31
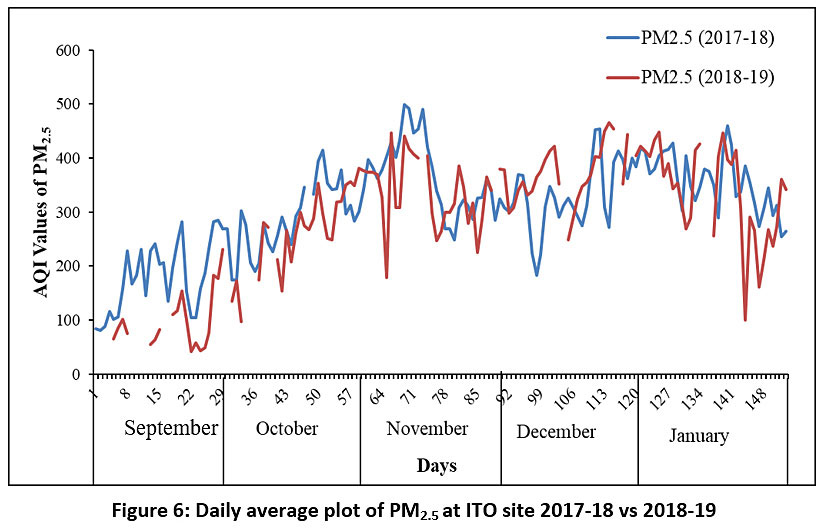 |
Figure 6: Daily average plot of PM2.5 at ITO site 2017-18 vs 2018-19 Click here to view Figure |
AQI variation of NO2
As shown in Fig. 3, the AQI of NO2 noticed lower during September, October and December 2017 as compared to the respective months in 2018. But in November 2017and January 2018, the AQI values are higher as compared to November 2018 and January 2019. In general the AQI values of NO2 pollutant are not exceeded more than the moderate category at all sites during all seasons except during episodic periods of pollution such as huge burning of stubbles in agriculture dominant areas, heavy fires in bigger landfills, cracker burning during festive seasons etc.
 |
Figure 7: Daily average plot of NO2 at ITO site 2017-18 vs 2018-19 Click here to view Figure |
Table 4 gives the descriptive statistics of AQI of PM2.5 and NO2 at both the study sites. At DTU site the maximum and minimum AQI values for PM2.5 was found to be 500, 21.5 while that of NO2, as 103.6, 2.7 respectively during 2017-18. The maximum and minimum AQI values for PM2.5 were found to be 466.7 and 34.5, while for NO2, as 235.0 and 3.0 respectively during 2018-19.
At ITO site, the values of mean, median and mode for PM2.5 and NO2 during period 2017-18 were 306.3, 312.0 and 488.2. The mean, median and mode of NO2 AQI were 61.8, 42.8 and 26.0 respectively during same period. PM2.5 AQI mean, median and mode values were 295.0, 315.7 and 300.0 respectively during 2018-19 while for NO2 AQI values of mean, median and mode were 68.1, 67.2 and 83.0 respectively during 2018-19.
Table 3: Statistics for daily AQI values of PM2.5 and NO2 at selected sites.
|
Statistical parameters |
PM2.5 @ DTU Site |
NO2 @ DTU Site |
PM2.5 @ ITO Site |
NO2 @ ITO Site |
||||
|
2017-18 |
2018-19 |
2017-18 |
2018-19 |
2017-18 |
2018-19 |
2017-18 |
2018-19 |
|
|
Mean |
343.1 |
297.6 |
31.4 |
64.3 |
306.3 |
295.0 |
61.8 |
68.1 |
|
Median |
386.0 |
321.0 |
24.7 |
57.7 |
312.0 |
315.7 |
42.8 |
67.2 |
|
Mode |
500.0 |
305.8 |
24.0 |
21.2 |
488.2 |
300.0 |
26.0 |
83.0 |
|
Minimum |
21.5 |
34.5 |
2.7 |
3.0 |
81.5 |
41.5 |
10.6 |
22.5 |
|
Maximum |
500.0 |
466.7 |
103.6 |
235.0 |
498.4 |
465.2 |
468.3 |
124.0 |
|
No. of Days |
140.0 |
136.0 |
128.0 |
133.0 |
152.0 |
131.0 |
138.0 |
134.0 |
Monthly average AQI at ITO and DTU site
Fig. 8 shows the variation of monthly average AQI values for PM2.5 and NO2 at DTU and ITO sites. The average monthly AQI for PM2.5 was found to be minimum during the months of September, 2017 and 2018 which was found to be 120 and 63 respectively for the DTU station. It was found to be in moderate and satisfactory range in accordance with the parameters defined by Indian National Ambient Air Quality Standards (NAAQS). Probably the monsoon rain effect which by which washes off the pollutants from the atmosphere easily. Further, it can be observed that PM2.5 AQI was found to be maximum in the months of winter season. At DTU, the PM2.5 AQI was found to be 421, 393 and 388 during November 2017, December 2017 and January 2018 respectively while it was recorded 369 and 330 during November 2018, December 2018 and January 2019 respectively at DTU site. Accordingly, the air is categorized under very poor and severe range as per the NAAQS. It was found maximum because of atmospheric conditions, agricultural burning in surroundings of Delhi and major festive seasons (like Diwali, Dussehra, Christmas and New Year) during this period. Similarly, average monthly concentration for AQI for the pollutant NO2 was found to be lower (17 and 21) during the months September 2017 and 2018 respectively at DTU station. While it was found to be maximum during the winter season and higher values (96) were obtained in the month of January 2019. It can also be observed that the average monthly values for NO2 were found to be 40, 59 and 28 for the months of Nov-17, Dec-17 and Jan-18 respectively and were found to be 72, 55 and 96 for November 2018, December 2018 and January 2019 respectively. Similar trends were observed for the AQI at ITO as well. The minimum monthly average values for AQI at ITO station were as (179 and 97) for PM2.5 and (32 and 46) for NO2 during the months of September, 2017 and 2018 respectively. Further, the average monthly AQI values for the PM2.5 and NO2 were found to be higher during winter season.
 |
Figure 8: Monthly AQI Variations of PM2.5 and NO2 at Selected Study Sites. Click here to view Figure |
As given in Table 4, every time there was a decrease in percent relative difference “between” 6.0 and 47.3 at DTU site and between 8.8 and 45.7 at ITO site. December is the only month at ITO site when instead of decrease, an increased level of PM2.5 AQI was recorded.
On the other hand, the monthly average relative difference of NO2 was very different from PM2.5 values. percent different to PM2.5. The relative difference was noticed between -7.2 to 240.5 at DTU while and -32.1 to 90.1 at ITO site. The decrease in AQI was seen during winter months of 2018 as compared to 2017 with few exceptions. Record decrease in AQI at both sites pointed toward success and the significance of GRAP task force implementation and effective steps taken by EPCA for providing clean air to citizens of NCR Delhi.
Table 4: PM2.5 and NO2 Variations at Selected Study Sites.
|
(a) |
(b) |
||||||
|
Months |
PM2.5 @DTU Site |
Months |
NO2 @DTU Site |
||||
|
2017-18 |
2018-19 |
%Relative difference |
2017-18 |
2018-19 |
%Relative difference |
||
|
Sep |
120.5 |
63.5 |
-47.3 |
Sep |
17.8 |
21.2 |
19.0 |
|
Oct |
326.1 |
279.4 |
-14.3 |
Oct |
19.7 |
59.3 |
200.6 |
|
Nov |
421.3 |
352.5 |
-16.3 |
Nov |
40.5 |
72.8 |
79.5 |
|
Dec |
393.5 |
369.9 |
-6.0 |
Dec |
59.5 |
55.2 |
-7.2 |
|
Jan |
388.5 |
330.3 |
-14.9 |
Jan |
28.3 |
96.4 |
240.5 |
|
(c) |
|
|
|
(d) |
|
|
|
|
Months |
PM2.5 @ITO Site |
Months |
NO2 @ITO Site |
||||
|
2017-18 |
2018-19 |
%Relative difference |
2017-18 |
2018-19 |
%Relative difference |
||
|
Sep |
179.9 |
97.5 |
-45.7 |
Sep |
32.7 |
46.4 |
41.4 |
|
Oct |
290.3 |
270.9 |
-6.7 |
Oct |
46.3 |
88.2 |
90.1 |
|
Nov |
358.7 |
336.5 |
-6.2 |
Nov |
125.4 |
85.2 |
-32.1 |
|
Dec |
340.9 |
371.1 |
8.8 |
Dec |
39.2 |
65.8 |
67.7 |
|
Jan |
353.4 |
329.6 |
-6.7 |
Jan |
67.5 |
51.3 |
-23.9 |
Conclusion
The GRAP task force action plan was very effective during the days when pollution level entered into the severe category. GRAP task force immediately came into action and conducted meetings to mitigate the heavy loadings of pollution in NCR Delhi. In this study we noticed that every time whenever GRAP task force took action, the pollution level decreased significantly and the situation was under control. It was observed that whenever GRAP was implemented, the the AQI values of both PM2.5 and NO2 decreased drastically. This was possible due to stringent steps such as restriction on entry of heavy vehicles, ban on construction activities, introduction of odd-even scheme for vehicles, closure of schools during severe condition, closure of brick kilns and stone crushers; ban on diesel generator sets and burning in landfills and parks etc. taken by the authorities. Therefore, the suggestive outcome of study is to formulate similar task forces in every mega city of India for providing neat and clean air to our citizens. Also, there is need to prepare a fresh inventory of air pollution sources in residential areas.
Acknowledgement
We sincerely thank the financial support received from Jawaharlal Nehru University New Delhi, DST PURSE, University Grant Commission (UGC) and Central Pollution Control Board (CPCB).
Funding
The author(s) received no financial support for the research, authorship, and/or publication of this article.
Conflict of Interest
The authors do not have any conflict of interest.
References
- McCubbin, D. R., Apelberg, B. J., Roe, S., & Divita, F. (2002). Livestock ammonia management and particulate-related health benefits.
- Gupta, P., Christopher, S. A., Wang, J., Gehrig, R., Lee, Y. C., & Kumar, N. (2006). Satellite remote sensing of particulate matter and air quality assessment over global cities. Atmospheric Environment, 40(30), 5880-5892.
- Chowdhury, S., & Dey, S. (2016). Cause-specific premature death from ambient PM2. 5 exposure in India: Estimate adjusted for baseline mortality. Environment international, 91, 283-290.
- Dholakia, H. H., Purohit, P., Rao, S., & Garg, A. (2013). Impact of current policies on future air quality and health outcomes in Delhi, India. Atmospheric environment, 75, 241-248.
- Sindhwani, R., Goyal, P., Kumar, S., & Kumar, A. (2015). Anthropogenic emission inventory of criteria air pollutants of an urban agglomeration-National Capital Region (NCR), Delhi. Aerosol and Air Quality Research, 15(4), 1681-1697.
- Kumar, B., Verma, K., & Kulshrestha, U. (2014). Deposition and mineralogical characteristics of atmospheric dust in relation to land use and land cover change in Delhi (India). Geography Journal, 2014.
- Sharma. D. & Kulshrestha, U. C. (2014). Spatial and temporal patterns of air pollutants in rural and urban areas of India. Environmental pollution, 195, 276-281.
- Chandrappa, R., & Kulshrestha, U. C. (2015). Sustainable air pollution management: theory and practice. Springer.
- Gurjar, B. R., Ravindra, K., & Nagpure, A. S. (2016). Air pollution trends over Indian megacities and their local-to-global implications. Atmospheric Environment, 142, 475-495.
- Liu, T., Marlier, M. E., DeFries, R. S., Westervelt, D. M., Xia, K. R., Fiore, A. M., ... & Milly, G. (2018). Seasonal impact of regional outdoor biomass burning on air pollution in three Indian cities: Delhi, Bengaluru, and Pune. Atmospheric environment, 172, 83-92.
- Villar-Vidal M, Lertxundi A, de Dicastillo MML, Alvarez JI, Santa Marina L, Ayerdi M, Ibarluzea J (2014) Air Polycyclic Aromatic Hydrocarbons (PAHs) associated with PM2.5 in a North Cantabric coast urban environment. Chemosphere 99:233–238
- Hazarika, N., & Srivastava, A. (2017). Estimation of risk factor of elements and PAHs in size- differentiated particles in the National Capital Region of India. Air Quality, Atmosphere & Health, 10(4), 469-482.
- Kulshrestha U. 2015.Some Facts about Recent Air Pollution Problem in Delhi. Journal of Indian Geophysical Union, Vol, 19(3), 351-352.
- Ghude, S. D., Jain, S. L., Arya, B. C., Beig, G., Ahammed, Y. N., Kumar, A., & Tyagi, B. (2008). Ozone in ambient air at a tropical megacity, Delhi: characteristics, trends and cumulative ozone exposure indices. Journal of Atmospheric Chemistry, 60(3), 237-252.
- Goyal, S. K., Ghatge, S. V., Nema, P. S. M. T., & Tamhane, S. M. (2006). Understanding urban vehicular pollution problem vis-a-vis ambient air quality–case study of a megacity (Delhi, India). Environmental monitoring and assessment, 119(1-3), 557-569.
- Jenamani, R. K. (2007). Alarming rise in fog and pollution causing a fall in maximum temperature over Delhi. Current Science (00113891), 93(3).
- Economic Survey of Delhi 2018-19 (http://delhiplanning.nic.in/content/economic-survey- delhi-2018-19).
- Finlayson-Pitts, B. J., & Pitts Jr, J. N. (1999). Chemistry of the upper and lower atmosphere: theory, experiments, and applications. Elsevier.
- Bhanarkar, A. D., Goyal, S. K., Sivacoumar, R., & Rao, C. C. (2005). Assessment of contribution of SO2 and NO2 from different sources in Jamshedpur region, India. Atmospheric Environment, 39(40), 7745-7760.
- World Health Organization. (2006). Air quality guidelines: global update 2005: particulate matter, ozone, nitrogen dioxide, and sulfur dioxide. World Health Organization.
- Sillman, S. (2003). Tropospheric ozone and photochemical smog. Environmental geochemistry, 9, 407-31.
- Turner, M. C., Jerrett, M., Pope III, C. A., Krewski, D., Gapstur, S. M., Diver, W. R., ... & Burnett, R. T. (2016). Long-term ozone exposure and mortality in a large prospective study. American journal of respiratory and critical care medicine, 193(10), 1134-1142.
- Singh, S., Kumar, B., Gupta, G. P., & Kulshrestha, U. C. (2014). Signatures of increasing energy demand of past two decades as captured in rain water composition and airmass trajectory analysis at Delhi (India). Atmospheric Environment.
- Central Pollution Control Board (CPCB, Govt. of India), 2009.
- Singh. Y., Kulshrestha. U., (2016). New Delhi ‘Odd–Even II’: A Hasty Repeat. Journal of Energy Environment and Carbon Credits. 6(3): 1–8p.
- Kulshrestha U. & Mishra M., 2019. Ozone Pollution from Urban Sources, Geography and You,19(23): 30-35.
- O'Connor, G. T., Neas, L., Vaughn, B., Kattan, M., Mitchell, H., Crain, E. F., & Adams, G. K. (2008). Acute respiratory health effects of air pollution on children with asthma in US inner cities. Journal of Allergy and Clinical Immunology, 121(5), 1133-1139.
- (http://cpcb.nic.in/uploads/National_Ambient_Air_Quality_Standards.pdf),
- Singh. Y., Kulshrestha. U., (2016). Critical Assessment of Odd and Even in Delhi. Journal of Energy Environment and Carbon Credits. 6(2): 1–6p.
- Kulshrestha, U. C., Kulshrestha, M. J., Sekar, R., Sastry, G. S. R., & Vairamani, M. (2003). Chemical characteristics of rainwater at an urban site of south-central India. Atmospheric Environment, 37(21), 3019-3026.
- Sharma, A., Singh, S., & Kulshrestha, U. C. (2018). Aerosol-trace gases interactions and their role in air quality control of Delhi city (India). Arabian Journal of Geosciences, 11(13),358.


