Physico - Chemical Analysis of Fresh Water of Ropar Wetland (Ramsar Site), India
Saima Akhter1
*
 and Onkar Singh Brraich1
http://dx.doi.org/10.12944/CWE.15.1.15
Through anthropogenic activities such as dam building, river management works, indirectly through developments and disturbances in the landscape of the watersheds in particular effluent discharges and deforestation increasingly threatened the environmental integrity of freshwaters systems, world wide. In order to access the monthly and seasonally variations of “Ropar Weland”, study on various physio - chemical parameters was carried out from October 2015 to September 2017 at four representative sites (S1, S2, S3 and S4). The seasons were generally divided into winter (December to February), summer (March to May), monsoon (June to August) and autumn (September to November). Maximum amount of all the parameters except DO and free CO2 were observed in summer and monsoon season and minimum in winter season. Minimum value of DO and free CO2 during summer season is due to the higher temperature because temperature is inversely proportional to DO. Rest of the parameters such as phosphate, sulphate, magnesium, calcium were widely fluctuated according to seasons and are under permissible limits.
Copy the following to cite this article:
Akhter S, Brraich O. S. Physico - Chemical Analysis of Fresh Water of Ropar Wetland (Ramsar Site), India. Curr World Environ 2020; 15(1). DOI:http://dx.doi.org/10.12944/CWE.15.1.15
Copy the following to cite this URL:
Akhter S, Brraich O. S. Physico - Chemical Analysis of Fresh Water of Ropar Wetland (Ramsar Site), India. Curr World Environ 2020; 15(1). Available from: https://bit.ly/2VWhPTx
Download article (pdf) Citation Manager Publish History

Introduction
Human induced perturbances and hydrological conditions such as amount of precipitation, water loss due to high heat inducers can modify the physical and chemical characteristics such as soil salinity, nutrient availability, pH, sediment properties and degree of substrate anoxia. These changes in physico - chemical environment have direct impact on the biotic component of the water body. The ecological parameter of such water bodies may provide clues for understanding the key relationship which are relevant for restoration strategies.1 Pollutions by way of mining also lead to the decrease in biodiversity. The contaminants include heavy metals, cyanide, phosphate, carbonates, sulphides, sulphates, arsenic and its complexes, nitrogen and its compounds.2 Some heavy metals in small amounts are important for metabolic functioning but in high quantities these become toxic e.g. manganese, chromium, zinc, iron and copper.3 Due to the non - biodegradable property of metal pollutants, the effect is long - lasting.4
Wetlands are fragile aquatic ecosystems. Slight change in the aquatic environment causes serious alterations in various abiotic and biotic components of the wetlands. Ropar wetland is designated as Ramsar site in 2002. Now, it is experiencing rampant deforestation in the catchment area which ultimately discharging loads of silt into it. Small islands have been emerged in the reservoir area of this wetland which has drastically reduced its water carrying capacity as well as depth. Product quality and safety is greatly reduced by the environmental impacts as the variation in various water quality parameters influences management decisions in aquaculture. Pollution from the adjoining industries (National Fertilizer Limit (NFL) Nangal) is also one of the major causes of degradation of this wetland. Discharge of effluents, heavy metals, slit from cement plant and ash from the thermal plant causes mass mortality of fishes and poses a serious threat to other biotic components of this internationally important wetland. Present study about the concentration of various solutes is important which is provided by the quality of the water. A water quality renders a great help to improve its existing conditions and provides the basis for judging the suitability of water for its various usages. A continuous monitoring of water quality is essential to determine the state of pollution in our wetlands.
Materials and Methods
Physico - Chemical Analysis
Ropar Wetland is a manmade freshwater riverine as well as lacustrine wetland. It came into existence with the impoundment of water by constructing a barrage on the river Sutlej near Ropar town. It is situated at 30°58′ - 31°02′N latitude and 76°30′ - 76°33′E longitude (Figure 1). This important ecological zone is located in the Shivalik foothills of the Lower Himalayas and was created in 1952 on the Sutlej River, in the Punjab State of India, by building a head regulator to store and divert water for beneficial uses of irrigation through canals, drinking and industrial water supply. The total area covered by the Wetland is 1365 ha, which includes 800 ha area of the river and the reservoir, 30 ha of forest area named as Sadabarat Forest and 30 ha under marshy plants, which serves as an important habitat for some rare and threatened species of Shivalik foothills. It is also an important staging and resting ground for migratory waterfowl. From October 2015 to September 2017 the present study was carried out for a period of 2 years. The exact sample sites were fixed by using Global Positioning System (GPS). Four sampling sites (S1, S2, S3, S4) were identified with an objective of obtaining samples for the analysis of physico - chemical parameters from this wetland. The samples of water were collected by 2 liters polythene bottle Physico - chemical parameters like air, water temperature, conductivity, total dissolved solid, total alkalinity, salinity, pH, free carbon dioxide and dissolved oxygen have been analyzed on the spot with the help of portable water analysis kit as their values are liable to change soon. The rest of the parameters viz., turbidity, total hardness, calcium and magnesium hardness, chlorides, nitrites, nitrates, phosphates and sulphates were analyzed in the laboratory by titrimetric methods using standard methodology.5,6
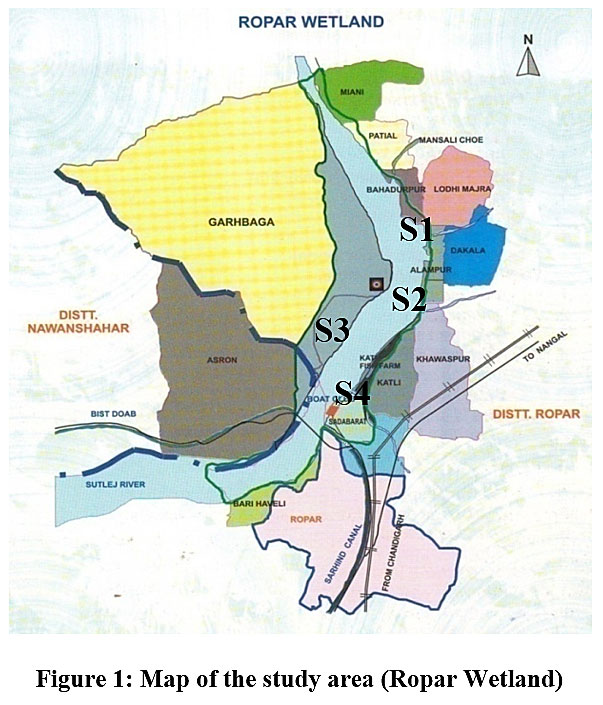 |
Figure 1: Map of the study area (Ropar Wetland) Click here to view Figure |
Results
Analysis of Physico - Chemical Parameters
The study on Ropar wetland was carried out from October 2015 to September 2017 to assess various physico - chemical parameters and various seasonal variations at four representative sites (S1, S2, S3 and S4). The seasons were generally divided into into winter (December to February), summer (March to May), monsoon (June to August) and autumn (September to November) and are shown in Table 1,2,3,4. Monthly variations between different physico - chemical parameters at all the four sites (S1, S2, S3 and S4) have been observed and there range, mean and standard deviation (S.D.) was also calculated and are shown in Table 1,2,3,4. These parameters include: Air Temperature (ºC), Water temperature (ºC), Conductivity (µS/cm), TDS (mg/l), Turbidity (NTU), Dissolved oxygen (mg/l), Free CO2 (mg/l), pH, Alkalinity (mg/l), Salinity (mg/l), Chlorides (mg/l), Total Hardness (mg/l), Ca++Hardness (mg/l), Mg++Hardness (mg/l), Phosphates (mg/l), Sulphates (mg/l), Nitrates (mg/l), Nitrites (mg/l) and Silicates (mg/l).
Table 1: Mean, S.D., range and seasonal variation in physico - chemical parameters from October 2015 to September 2017 at S1 site of Ropar Wetland
|
Parameters |
Winter season |
Summer season |
Monsoon season |
Autumn season |
October 2015 to September 2017 |
|
|
Mean ± S.D. |
Mean ± S.D. |
Mean ± S.D. |
Mean ± S.D. |
Mean ± S.D. |
Range |
|
|
Air Temperature(ºC) |
19.01 ± 1.01 |
32 ± 3.13 |
31.43 ± 2.28 |
26.65 ± 2.69 |
27.27 ± 5.77 |
17.5 - 35.5 |
|
Water temperature (ºC) |
17.86 ± 1.17 |
26.63 ± 3.70 |
28 ± 2.93 |
23.66 ± 2.69 |
24.04 ± 4.74 |
16.5 - 32.5 |
|
Conductivity (µS/cm) |
250 ± 36.87 |
412.83 ± 15.62 |
325 ± 18.70 |
320 ± 25.09 |
326.95 ± 63.59 |
200 - 430 |
|
TDS (mg/l) |
116.66 ± 4.45 |
146.83 ± 4.26 |
127 ± 9.61 |
128 ± 1.78 |
129.62 ± 12.35 |
110 - 152 |
|
Turbidity (NTU) |
9.24 ± 0.59 |
21.32 ± 1.51 |
12.66 ± 2.31 |
13.53 ± 2.10 |
14.19 ± 4.80 |
8.5 - 23 |
|
Dissolved oxygen (mg/l) |
8.79 ± 0.20 |
6.71 ± 0.14 |
7.05 ± 0.28 |
8.1 ± 0.85 |
7.66 ± 0.95 |
6.5 - 8.95 |
|
Free CO2 (mg/l) |
8.16 ± 0.53 |
6.31 ± 0.58 |
6.28 ± 0.54 |
6.33 ± 0.73 |
6.77 ± 0.99 |
5 - 8.9 |
|
pH |
6.72 ± 0.23 |
7.92 ± 0.07 |
7.38 ± 0.29 |
7.17 ± 0.25 |
7.65 ± 0.42 |
6.82 - 7.99 |
|
Alkalinity (mg/l) |
86 ± 3.74 |
136.66 ± 6.88 |
110 ± 8.94 |
90 ± 8.94 |
105.66 ± 21.64 |
80 - 146 |
|
Salinity (mg/l) |
96 ± 4.77 |
305 ± 39.37 |
175 ± 52.44 |
116.66 ± 25.81 |
173.16 ± 89.47 |
90 - 350 |
|
Chlorides (mg/l) |
18.33 ± 1.49 |
36.42 ± 1.10 |
23.61 ± 2.47 |
21.99 ± 1.36 |
25.09 ± 7.14 |
15.86 - 37.89 |
|
Total Hardness (mg/l) |
161.66 ± 33.11 |
358.66 ± 22.50 |
241.83 ± 12.00 |
209.33 ± 13.36 |
242.87 ± 77.01 |
120 - 380 |
|
Ca++Hardness (mg/l) |
24.14 ± 1.15 |
38.52 ± 2.32 |
25.81 ± 1.90 |
28.86 ± 4.49 |
29.33 ± 6.24 |
22.7 - 40.37 |
|
Mg++Hardness (mg/l) |
85.47 ± 11.51 |
163.63 ± 14.93 |
127.33 ± 13.60 |
92.95 ± 9.67 |
117.35 ± 33.80 |
75.63 - 178.51 |
|
Phosphates (mg/l) |
0.11 ± 0.01 |
0.20 ± 0.01 |
0.13 ± 0.02 |
0.13 ± 0.01 |
0.14 ± 0.04 |
0.098 - 0.223 |
|
Sulphates (mg/l) |
2.24 ± 0.53 |
3.91 ± 0.36 |
2.94 ± 0.58 |
2.73 ± 0.26 |
2.96 ± 0.75 |
1.72 - 4.3 |
|
Nitrates (mg/l) |
0.09 ± 0.006 |
0.18 ± 0.01 |
0.08 ± 0.009 |
0.12 ± 0.008 |
0.12 ± 0.04 |
0.07 - 0.199 |
|
Nitrites (mg/l) |
0.09 ± 0.003 |
0.19 ± 0.003 |
0.08 ± 0.007 |
0.16 ± 0.01 |
0.13 ± 0.04 |
0.076 - 0.199 |
|
Silicates (mg/l) |
4.44 ± 0.58 |
6.72 ± 0.35 |
5.34 ± 0.63 |
5.88 ± 0.58 |
5.59 ± 0.99 |
3.86 - 7.1 |
Table 2: Mean, S.D., range and seasonal variation in physico - chemical parameters from October 2015 to September 2017 at S2 site of Ropar Wetland
|
Parameters |
Winter season |
Summer season |
Monsoon season |
Autumn season |
October 2015 to September 2017 |
|
|
Mean ± S.D. |
Mean ± S.D. |
Mean ± S.D. |
Mean ± S.D. |
Mean ± S.D. |
Range |
|
|
Air Temperature (ºC) |
18.96 ± 1.37 |
27.6 ± 1.45 |
27.06 ± 1.25 |
24.2 ± 1.08 |
24.45 ± 3.70 |
17 - 29.5 |
|
Water temperature (ºC) |
17.63 ± 0.97 |
25.33 ± 1.94 |
24.5 ± 1.82 |
22.13 ± 0.84 |
22.4 ± 3.35 |
16.3 - 27.5 |
|
Conductivity (µS/cm) |
240 ± 20.97 |
347.33 ± 16.96 |
322.16 ± 7.88 |
298.33 ± 13.29 |
301.95 ± 43.11 |
200 - 366 |
|
TDS (mg/l) |
114.66 ± 3.26 |
135.66 ± 1.75 |
120.83 ± 5.23 |
125.66 ± 2.80 |
124.20 ± 8.49 |
110 - 138 |
|
Turbidity (NTU) |
7.6 ± 0.83 |
18.83 ± 1.25 |
14.35 ± 2.37 |
12.36 ± 0.54 |
13.28 ± 4.33 |
6.5 - 20.5 |
|
Dissolved oxygen (mg/l) |
8.71 ± 0.19 |
6.4 ± 0.23 |
7.61 ± 0.24 |
7.96 ± 0.64 |
7.67 ± 0.92 |
6 - 8.9 |
|
Free CO2 (mg/l) |
7.16 ± 0.53 |
5.31 ± 0.58 |
5.28 ± 0.54 |
5.33 ± 0.73 |
5.77 ± 0.99 |
4 - 7.9 |
|
pH |
6.36 ± 0.20 |
7.94 ± 0.04 |
7.18 ± 0.14 |
7.43 ± 0.36 |
7.57 ± 0.44 |
6.72 - 7.99 |
|
Alkalinity (mg/l) |
67.5 ± 5.24 |
124.83 ± 2.78 |
98.33 ± 6.83 |
80.33 ± 4.03 |
92.75 ± 22.46 |
60 - 128 |
|
Salinity (mg/l) |
114.16 ± 12.81 |
250 ± 31.62 |
150 ± 44.72 |
150 ± 44.72 |
166.04 ± 61.62 |
100 - 300 |
|
Chlorides (mg/l) |
17.43 ± 1.37 |
34.54 ± 2.82 |
17.73 ± 4.68 |
22.84 ± 2.08 |
23.13 ± 7.61 |
12.97 - 36.89 |
|
Total Hardness (mg/l) |
202.5 ± 52.70 |
335 ± 23.51 |
230.66 ± 16.63 |
221.66 ± 33.71 |
247.45 ± 61.68 |
150 - 353 |
|
Ca++Hardness (mg/l) |
23.11 ± 3.02 |
33.07 ± 1.60 |
23.95 ± 1.53 |
26.24 ± 6.11 |
26.59 ± 5.20 |
20 - 35.23 |
|
Mg++Hardness (mg/l) |
101.4 ± 14.82 |
138.07 ± 8.30 |
120.24 ± 16.58 |
94.11 ± 3.38 |
113.45 ± 20.75 |
90.23 - 150 |
|
Phosphates (mg/l) |
0.07 ± 0.008 |
0.16 ± 0.01 |
0.10 ± 0.002 |
0.10 ± 0.0008 |
0.11 ± 0.03 |
0.06 - 0.18 |
|
Sulphates (mg/l) |
1.49 ± 0.04 |
3.20 ± 0.13 |
2.42 ± 0.22 |
2.47 ± 0.28 |
2.4 ± 0.64 |
1.42 - 3.4 |
|
Nitrates (mg/l) |
0.07 ± 0.008 |
0.16 ± 0.01 |
0.07 ± 0.01 |
0.12 ± 0.008 |
0.10 ± 0.03 |
0.06 - 0.18 |
|
Nitrites (mg/l) |
0.08 ± 0.01 |
0.18 ± 0.01 |
0.05 ± 0.007 |
0.13 ± 0.03 |
0.11 ± 0.05 |
0.04 - 0.2 |
|
Silicates (mg/l) |
3.39 ± 0.49 |
5.70 ± 0.55 |
4.29 ± 0.38 |
4.66 ± 0.56 |
4.51 ± 0.97 |
2.89 - 6.3 |
Table 3: Mean, S.D., range and seasonal variation in physico - chemical parameters from October 2015 to September 2017 at S3 site of Ropar Wetland
|
Parameters |
Winter season |
Summer season |
Monsoon season |
Autumn season |
October 2015 to September 2017 |
|
|
Mean ± S.D. |
Mean ± S.D. |
Mean ± S.D. |
Mean ± S.D. |
Mean ± S.D. |
Range |
|
|
Air Temperature (ºC) |
19.16 ± 1.85 |
30.51 ± 3.12 |
30.56 ± 1.95 |
26.25 ± 2.71 |
26.62 ± 5.27 |
17 - 34.5 |
|
Water temperature (ºC) |
17.95 ± 1.41 |
27.7 ± 2.41 |
27.66 ± 2.47 |
23.78 ± 2.59 |
24.27 ± 4.58 |
16.1 - 30.7 |
|
Conductivity (µS/cm) |
261.66 ± 37.63 |
426.83 ± 16.12 |
343.33 ± 13.66 |
332.66 ± 21.18 |
341.12 ± 63.92 |
200 - 450 |
|
TDS (mg/l) |
117.16 ± 10.53 |
145.83 ± 13.61 |
131.83 ± 15.63 |
128 ± 13.13 |
130.70 ± 16.27 |
105 - 161 |
|
Turbidity (NTU) |
10.44 ± 0.90 |
20.44 ± 1.61 |
16.81 ± 5.54 |
15.26 ± 3.21 |
15.74 ± 4.80 |
9.5 - 22.59 |
|
Dissolved oxygen (mg/l) |
8.87 ± 0.08 |
7.10 ± 0.54 |
7.46 ± 0.24 |
8.31 ± 0.52 |
7.94 ± 0.80 |
6.5 - 8.95 |
|
Free CO2 (mg/l) |
8.85 ± 0.10 |
6.35 ± 0.39 |
7.11 ± 0.46 |
7.66 ± 0.38 |
7.49 ± 0.99 |
5.8 - 9 |
|
pH |
6.57 ± 0.28 |
7.86 ± 0.10 |
7.30 ± 0.30 |
7.34 ± 0.26 |
7.66 ± 0.42 |
6.85 - 7.99 |
|
Alkalinity (mg/l) |
86.16 ± 10.30 |
146.33 ± 12.67 |
108.33 ± 14.71 |
89.33 ± 16.81 |
107.54 ± 27.65 |
60 - 160 |
|
Salinity (mg/l) |
100.66 ± 25.39 |
290 ± 40.49 |
163.33 ± 62.82 |
113.33 ± 25.03 |
166.83 ± 85.67 |
80 - 360 |
|
Chlorides (mg/l) |
15.64 ± 4.43 |
38.04 ± 0.82 |
24.4 ± 1.76 |
23.25 ± 1.21 |
25.33 ± 8.56 |
10.88 - 39.5 |
|
Total Hardness (mg/l) |
169.33 ± 36.03 |
353.66 ± 34.99 |
248.33 ± 17.22 |
223.33 ± 20.65 |
248.66 ± 73.42 |
120 - 390 |
|
Ca++Hardness (mg/l) |
23.05 ± 2.86 |
37.48 ± 3.37 |
25.99 ± 2.67 |
29.09 ± 5.97 |
28.90 ± 6.62 |
20.18 - 41.37 |
|
Mg++Hardness(mg/l) |
84.40 ± 8.68 |
163.79 ± 16.82 |
127 ± 21.86 |
96.85 ± 13.21 |
118.01 ± 34.62 |
76.03 - 188.51 |
|
Phosphates (mg/l) |
0.10 ± 0.002 |
0.19 ± 0.006 |
0.13 ± 0.02 |
0.12 ± 0.01 |
0.14 ± 0.04 |
0.098 - 0.207 |
|
Sulphates (mg/l) |
2.40 ± 0.59 |
3.86 ± 0.19 |
3.03 ± 0.62 |
3.24 ± 0.74 |
3.13 ± 0.75 |
1.82 - 4.07 |
|
Nitrates (mg/l) |
0.09 ± 0.004 |
0.18 ± 0.01 |
0.08 ± 0.01 |
0.13 ± 0.02 |
0.12 ± 0.04 |
0.07 - 0.199 |
|
Nitrites (mg/l) |
0.09 ± 0.001 |
0.19 ± 0.003 |
0.08 ± 0.009 |
0.16 ± 0.01 |
0.13 ± 0.04 |
0.076 - 0.199 |
|
Silicates (mg/l) |
3.92 ± 0.06 |
6.32 ± 0.16 |
4.72 ± 0.16 |
5.64 ± 0.25 |
5.15 ± 0.94 |
3.82 - 6.55 |
Table 4: Mean, S.D., range and seasonal variation in physico - chemical parameters from October 2015 to September 2017 at S4 site of Ropar Wetland
|
Parameters |
Winter season |
Summer season |
Monsoon season |
Autumn season |
October 2015 to September 2017 |
|
|
Mean ± S.D. |
Mean ± S.D. |
Mean ± S.D. |
Mean ± S.D. |
Mean ± S.D. |
Range |
|
|
Air Temperature (ºC) |
16.13 ± 2.22 |
26.95 ± 3.04 |
27.38 ± 3.12 |
26.65 ± 2.69 |
23.25 ± 5.18 |
14 - 31.8 |
|
Water temperature (ºC) |
15.08 ± 2.06 |
23.68 ± 3.18 |
23.73 ± 1.70 |
23.66 ± 2.69 |
20.58 ± 4.27 |
12.3 - 27.3 |
|
Conductivity (µS/cm) |
220 ± 20.97 |
337.5 ± 14.05 |
305 ± 10.48 |
320 ± 25.09 |
286.04 ± 46.60 |
190 - 350 |
|
TDS (mg/l) |
107.83 ± 3.71 |
128 ± 5.40 |
116.16 ± 3.76 |
128 ± 1.78 |
117.41 ± 8.45 |
102 - 134 |
|
Turbidity (NTU) |
7.44 ± 0.71 |
19.26 ± 0.95 |
13.05 ± 1.95 |
13.53 ± 2.10 |
12.78 ± 4.50 |
6.6 - 20.79 |
|
Dissolved oxygen (mg/l) |
8.54 ± 0.24 |
6.41 ± 0.30 |
7.38 ± 0.15 |
8.1 ± 0.85 |
7.48 ± 0.84 |
6 - 8.8 |
|
Free CO2 (mg/l) |
5.83 ± 0.08 |
4.48 ± 0.86 |
4.28 ± 0.54 |
6.33 ± 0.73 |
4.73 ± 0.87 |
3 - 5.9 |
|
pH |
6.27 ± 0.13 |
7.83 ± 0.10 |
7.34 ± 0.16 |
7.17 ± 0.25 |
7.58 ± 0.44 |
6.73 - 7.98 |
|
Alkalinity (mg/l) |
68 ± 7.61 |
122.33 ± 6.65 |
96.83 ± 7.22 |
90 ± 8.94 |
90.95 ± 22.31 |
60 - 128 |
|
Salinity (mg/l) |
101.66 ± 16.02 |
246.66 ± 36.14 |
141.66 ± 41.67 |
116.66 ± 25.81 |
154.58 ± 64.26 |
80 - 300 |
|
Chlorides (mg/l) |
17.55 ± 2.44 |
33.33 ± 1.93 |
23.15 ± 1.17 |
21.99 ± 1.36 |
24.34 ± 6.15 |
14.85 - 35.89 |
|
Total Hardness (mg/l) |
165 ± 34.49 |
331 ± 25.06 |
226.83 ± 17.78 |
209.33 ± 13.36 |
235.70 ± 65.70 |
100 - 358 |
|
Ca++Hardness (mg/l) |
22.41 ± 3.15 |
32.80 ± 1.93 |
23.29 ± 2.26 |
28.86 ± 4.49 |
26.04 ± 5.14 |
17.84 - 35.23 |
|
Mg++Hardness (mg/l) |
94.28 ± 13.30 |
141.56 ± 7.20 |
116.40 ± 15.67 |
92.95 ± 9.67 |
110.30 ± 23.87 |
74.38 - 150 |
|
Phosphates (mg/l) |
0.05 ± 0.01 |
0.16 ± 0.01 |
0.10 ± 0.001 |
0.13 ± 0.01 |
0.10 ± 0.04 |
0.04 - 0.19 |
|
Sulphates (mg/l) |
1.58 ± 0.16 |
3.15 ± 0.04 |
2.28 ± 0.11 |
2.73 ± 0.26 |
2.38 ± 0.61 |
1.4 - 3.22 |
|
Nitrates (mg/l) |
0.07 ± 0.01 |
0.15 ± 0.01 |
0.06 ± 0.008 |
0.12 ± 0.008 |
0.11 ± 0.04 |
0.054 - 0.17 |
|
Nitrites (mg/l) |
0.07 ± 0.009 |
0.16 ± 0.01 |
0.04 ± 0.007 |
0.16 ± 0.01 |
0.10 ± 0.05 |
0.03 - 0.185 |
|
Silicates (mg/l) |
3.81 ± 0.09 |
6.16 ± 0.05 |
4.54 ± 0.09 |
5.88 ± 0.58 |
4.94 ± 0.89 |
3.72 - 6.25 |
Different Physico - Chemical Parameters of Ropar Wetland:
(i) Air Temperature (ºC)
At all the sites, monthly variations in the air temperature were recorded and maximum values were observed during the present investigations. At S1 site the air temperature ranged from 17.5 - 35.5ºC (27.27 ± 5.77), S2 site 17 - 29.5ºC (24.45 ± 3.70), S3 site 17 - 34.5ºC (26.62 ± 5.27) and at S4 site 14 - 31.8ºC (23.25 ± 5.18). At all the sites the minimum value of air temperature has been recorded in the month of December 2016 and January 2016, 2017 and maximum value was observed in the month of May 2016, 2017 and June 2017. The seasonal variation in air temperature was also recorded at all the sites and the highest air temperature (32ºC, 27.6ºC, 30.56ºC and 27.38ºC) was observed during summer season and lowest air temperature (19.01ºC, 18.96ºC, 19.16ºC and 16.13ºC) during winter season.
(ii) Water Temperature (ºC)
During the present investigations the monthly variations in the water temperature was recorded at all the sites and at S1 site the water temperature ranged from 16.5 - 32.5ºC (24.04 ± 4.74), S2 site 16.3 - 27.5ºC (22.4 ± 3.35), S3 site 16.1 - 30.7ºC (24.27 ± 4.58) and at S4 site 12.3 - 27.3ºC (20.58 ± 4.27). The minimum value of water temperature at all the sites, has been recorded in the month of December 2016 and January 2016, 2017 and maximum value was observed in the month of March 2017, May 2017, June 2017 and July 2017. Our results are in accordance to the findings7,8,9 . Water temperature generally varies with sites and seasons and the seasonal variation in water temperature at all the sites was observed and during summer season and monsoon season the highest water temperature (28ºC, 25.33ºC, 27.7ºC and 23.73ºC) was observed and lowest water temperature (17.86ºC, 17.63ºC, 17.95ºC and 15.08ºC) during winter season was recorded.
(iii) Electrical Conductivity (µS/cm)
The monthly variation in electrical conductivity was observed during the present course of study at all the sites and at S1 site it ranges from 200 - 430 µS/cm (326.95 ± 63.59), S2 site 200 - 366 µS/cm (301.95 ± 43.11), S3 site 200 - 450366 µS/cm (341.12 ± 63.92) and S4 site 190 - 350 µS/cm (286.04 ± 46.60). The lowest electrical conductivity was observed in the month of December 2016 and January 2016, 2017 and highest electrical conductivity was found in the month of March 2016, 2017, April 2017 and May 2016, 2017 at all the sites. Our results are in concordance with the workers who observed a range of EC in between 296 to723 μmhos/cm and 115.11 to 212.13 μmhos/cm respectively.10,11 Electrical conductivity showed seasonal changes at all the sites and minimum value (250 µS/cm, 240 µS/cm, 261.66 µS/cm and 220 µS/cm) of electrical conductivity was recorded during winter season and maximum value (412.83 µS/cm, 347.33 µS/cm, 426.83 µS/cm and 337.5 µS/cm) of electrical conductivity was found during summer season. Lowest electrical conductivity may due to the rainfall which increases the level of water in the wetlands whereas increase in electrical conductivity may be due to the evaporation and increase in organic matters such as plant debris enter the wetlands which lead to decrease in the water level.
(iv) Total Dissolved Solids (TDS mg/l)
The monthly variation in TDS was observed during the present at all the sites. The TDS at S1 site ranges from 110 - 152 mg/l (129.62 ± 12.35), S2 site 110 - 138 mg/l (124.20 ± 8.49), S3 site 105 - 161 mg/l (130.70 ± 16.27) and at S4 site 102 - 134 mg/l (117.41 ± 8.45). At all the sites (S1, S2, S3 and S4) the minimum TDS was observed in the month of January 2016, 2017 and September 2017 and maximum TDS was found in the month of April 2017 and May 2016, 2017. Seasonal changes in TDS at all the sites was recorded and TDS showed minimum value (116.66 mg/l, 114.66 mg/l, 117.16 mg/l and 107.83 mg/l) during winter season and maximum value (146.83 mg/l, 135.66 mg/l, 145.83 mg/l and 128 mg/l) of TDS during summer season. Our results were analogous to.12,13,14
(v) Turbidity (NTU)
Turbidity showed monthly variations during the present study at all the sites and at S1 site it ranges from 8.5 - 23 NTU (14.19 ± 4.80), S2 site 6.5 - 20.5 NTU (13.28 ± 4.33), S3 site 9.5 - 22.59 NTU (15.74 ± 4.80) and at S4 site 6.6 - 20.79 NTU (12.78 ± 4.50). At all the sites the minimum value of turbidity was observed in the month of December 2015, January 2016, September 2016 and February 2017 and maximum value of turbidity was recorded in the month of May 2016, 2017. Seasonal variations in turbidity at all the sites was recorded and minimum value (9.24 NTU, 7.6 NTU, 10.44 NTU and 7.44 NTU) of turbidity during winter season and maximum value (21.32 NTU, 18.83 NTU, 20.44 NTU and 19.26 NTU) of turbidity during summer season. These results are analogous to the observations.15,8
(vi) Dissolved Oxygen (DO mg/l)
DO values showed monthly variations at all the sites (S1, S2, S3 and S4) during the present study and at S1 site it ranges from 6.5 - 8.95 mg/l (7.66 ± 0.95), S2 site 6 - 8.9 mg/l (7.67 ± 0.92), S3 site 6.5 - 8.95 mg/l (7.94 ± 0.80) and at S4 site 6 - 8.8 mg/l (7.48 ± 0.84). DO show minimum value in the month of May 2016, 2017 and June 2017 at all the sites and maximum value in the month of January 2016, 2017 and February 2017. DO also showed seasonal variations at all the sites and minimum value (6.71 mg/l, 6.4 mg/l, 7.1 mg/l and 6.41 mg/l) of DO during summer season and maximum value (8.79 mg/l, 8.71 mg/l, 8.87 mg/l and 8.54 mg/l) of DO during winter season. Our results are comparable to the scientist who observed DO in a range of 5.18 - 9.72mg/l.9
(vii) Free CO2 (mg/l)
Free CO2 values also showed monthly variations at all the sites during the present study and at S1 site it ranges from 5 - 8.9 mg/l (6.77 ± 0.99), S2 site 4 - 7.9 mg/l (5.77 ± 0.99), S3 site 5.8 - 9 mg/l (7.49 ± 0.99) and at S4 site 3 - 5.9 mg/l (4.73 ± 0.87). The minimum value of Free CO2 was observed in the month of November 2015 and March 2017 at all the sites and maximum value in the month of February 2016 and January 2017. The seasonal variations in the values of Free CO2 at all the sites was also recorded and minimum value (6.28 mg/l, 5.28 mg/l, 6.35 mg/l and 4.28 mg/l) of Free CO2 was recorded during summer season and monsoon season and maximum value (8.16 mg/l, 7.16 mg/l, 8.85 mg/l and 6.33 mg/l) during winter season and autumn season. Parallel conditions were observed in the waters of the central west coast of India.16
(viii) pH
pH showed monthly variations at all the sites and at S1 site it ranges from 6.82 - 7.99 (7.65 ± 0.42), S2 site 6.72 - 7.99 (7.57 ± 0.44), S3 site 6.85 - 7.99 (7.66 ± 0.42) and at S4 site 6.73 - 7.98 (7.58 ± 0.44). At all the sites the minimum value of pH was observed in the month of June 2016 and December 2016 and maximum value in the month of October 2015, February 2017, March 2017 and April 2016. Our results are parallel to the worker who reported pH in the range of 6.93 to 7.55 and 7.5 to 8.4 respectively11. The growth of planktons is best favoured by a pH range from 5.0 to 8.517. The seasonal variations in the pH at all the sites was also recorded and minimum (6.72, 6.36, 6.57 and 6.27) of pH was recorded during winter season and maximum value (7.92, 7.94, 7.86 and 7.83) of pH during summer season. The slightly acidic and slightly alkaline nature of pH was observed at all the sites throughout the study period.
(ix) Alkalinity (mg/l)
Alkalinity showed monthly variation during the present study from at all the sites and at S1 site it ranges from 80 - 146 mg/l (105.66 ± 21.64), S2 site 60 - 128 mg/l (92.75 ± 22.46), S3 site 60 - 160 mg/l (107.54 ± 27.65) and at S4 site 60 - 128 mg/l (90.95 ± 22.31). At all the sites (S1, S2, S3 and S4) alkalinity showed minimum value in the month of December 2015, February 2016, 2017 and September 2016, 2017 and maximum value in the month of March 2016, April 2016 and May 2017. Seasonal variations in alkalinity was also observed at all the sites and minimum value (86 mg/l, 67.5 mg/l, 86.16 mg/l and 68 mg/l) during winter season and maximum value (136.66 mg/l, 124.83 mg/l, 146.33 mg/l and 122.33 mg/l) during summer season. During the summer season the amount of carbonates and bicarbonates increases due to sewage discharge and runoff from catchment areas.
(x) Salinity (mg/l)
During the present study salinity showed monthly variation at all the sites and at S1 site it ranges from 90 - 350 mg/l (173.16 ± 89.47), S2 site 100 - 300 mg/l (166.04 ± 61.62), S3 site 80 - 360 mg/l (166.83 ± 85.67) and at S4 site 80 - 300 mg/l (154.58 ± 64.26). At all the sites, minimum value of salinity was observed in the month of January 2016, 2017, August 2016, 2017 and September 2016, 2017 and maximum value in the month of April 2016, 2017. Our results are similar to the worker who reported the range of salinity in between 100 - 200 mg/l and100 - 400 mg/l respectively18. Seasonal variations in salinity was also observed at all the sites and minimum value (96 mg/l, 114.16 mg/l, 100.66 mg/l and 101.66 mg/l) during winter season and maximum value (305 mg/l, 250 mg/l, 290 mg/l and 246.66 mg/l) during summer season. Our results are in conformity with prior studies.19
(xi) Chlorides (mg/l)
In the present study chloride content showed monthly variation at all the sites and at S1 site it ranged from 15.86 - 37.89 mg/l (25.09 ± 7.14), S2 site 12.97 - 36.89 mg/l (23.13 ± 7.61), S3 site 10.88 - 39.5 mg/l (25.33 ± 8.56) and at S4 site 14.85 - 35.89 mg/l (24.34 ± 6.15). Chloride content showed minimum value in the month of December 2015, 2016, January 2017 and July 2017 and maximum value in the month of April 2016, 2017 and May 2017 at all the sites. Chloride also showed seasonal variations at all the sites and minimum value (18.33 mg/l, 17.43 mg/l, 15.64 mg/l and 17.55 mg/l) during winter season and maximum value (36.42 mg/l, 34.54 mg/l, 38.04 mg/l and 33.33 mg/l) during summer season.
(xii) Total Hardness (mg/l)
Total hardness showed monthly variation at all the sites and at S1 site it ranged from 120 - 380 mg/l (242.87 ± 77.01), S2 site 150 - 353 mg/l (247.45 ± 61.68), S3 site 120 - 390 mg/l (248.66 ± 73.42) and at S4 site 100 - 358 mg/l (235.70 ± 65.70). Minimum value of total hardness was observed in the month of December 2015, January 2017 and February 2017 and maximum value of total hardness in the month of March 2016, April 2017 and May 2016, 2017 at all the sites. Seasonal variations in total hardness at all the sites was also recorded and minimum value (161.66 mg/l, 202.5 mg/l, 169.33 mg/l and 165 mg/l) during winter season and maximum value (358.66 mg/l, 335 mg/l, 353.66 mg/l and 331 mg/l) during summer season.
(xiii) Calcium Hardness (Ca++ hardness mg/l)
Ca++ hardness showed monthly variation at all the sites and at S1 site it ranged from 22.7 - 40.37 mg/l (29.33 ± 6.24), S2 site 20 - 35.23 mg/l (26.59 ± 5.20), S3 site 20.18 - 41.37 mg/l (28.90 ± 6.62) and at S4 site 17.84 - 35.23 mg/l (26.04 ± 5.14). Minimum value of Ca++ hardness was observed in the month of December 2016 and January 2017 and maximum value of Ca++ hardness in the month of April 2016, 2017 at all the sites. Seasonal variations in Ca++ hardness at all the sites (S1, S2, S3 and S4) was also recorded and minimum value (24.14 mg/l, 23.11 mg/l, 23.05 mg/l and 22.41 mg/l) during winter season and maximum value (38.52 mg/l, 33.07 mg/l, 37.48 mg/l and 32.8 mg/l) during summer season. Similar trend was reported.20
(xiv) Magnesium hardness (Mg++Hardness mg/l)
Mg++Hardness during the present study showed monthly variation at all the sites and at S1 site it ranges from 75.63 - 178.51 mg/l (117.35 ± 33.80), S2 site 90.23 - 150 mg/l (113.45 ± 20.75), S3 site 76.03 - 188.51 mg/l (118.01 ± 34.62) and at S4 site 74.38 - 150 mg/l (110.30 ± 23.87). At all the sites minimum value of Mg++Hardness was observed in the month of October 2016, December 2016 and January 2017 and maximum value in the month of April 2016. Seasonal variations in salinity was also observed at all the sites and minimum value (85.47 mg/l, 94.11 mg/l, 84.4 mg/l and 92.95 mg/l) during winter season and maximum value (163.63 mg/l, 138.07 mg/l, 163.79 mg/l and 141.56 mg/l) during summer season.
(xv) Phosphates (mg/l)
Monthly variation in phosphates was observed during the present study at all the sites. The phosphates at S1 site ranges from 0.098 - 0.223 mg/l (0.14 ± 0.04), S2 site 0.06 - 0.18 mg/l (0.11 ± 0.03), S3 site 0.098 - 0.207 mg/l (0.14 ± 0.04) and at S4 site 0.04 - 0.19 mg/l (0.10 ± 0.04). At all the sites the minimum phosphates was observed in the month of December 2016, January 2017 and February 2016 and maximum phosphates was found in the month of March 2016, 2017 and May 2017. Seasonal changes in phosphates at all the sites was recorded and phosphates showed minimum value (0.11 mg/l, 0.07 mg/l, 0.1 mg/l and 0.05 mg/l) during winter season and maximum value (0.2 mg/l, 0.16 mg/l, 0.19 mg/l and 0.16 mg/l) of phosphates during summer season. Analogous observations were made.21
(xvi) Sulphates (mg/l)
The monthly variation was observed in sulphates during the present study at all the sites. The sulphates at S1 site ranges from 1.72 - 4.3 mg/l (2.96 ± 0.75), S2 site 1.42 - 3.4 mg/l (2.4 ± 0.64), S3 site 1.82 - 4.07 mg/l (3.13 ± 0.75) and at S4 site 1.4 - 3.22 mg/l (2.38 ± 0.61). At all the sites the minimum sulphates was observed in the month of December 2015, January 2016 and February 2016 and maximum sulphates was found in the month of March 2016, April 2017 and May 2017. Seasonal changes in sulphates at all the sites, was recorded and sulphates showed minimum value (2.24 mg/l, 1.49 mg/l, 2.4 mg/l and 1.58 mg/l) during winter season and maximum value (3.91 mg/l, 3.2 mg/l, 3.86 mg/l and 3.15 mg/l) of sulphates during summer season.
(xvii) Nitrates (mg/l)
During the present study of nitrates showed the monthly variations at all the sites. The nitrates at S1 site ranges from 0.07 - 0.199 mg/l (0.12 ± 0.04), S2 site 0.06 - 0.18 mg/l (0.10 ± 0.03), S3 site 0.07 - 0.199 mg/l (0.12 ± 0.04) and at S4 site 0.054 - 0.17 mg/l (0.11 ± 0.04). The minimum value of nitrates was observed in the month of February 2016, August 2016 and June 2017 and maximum value of nitrates was found in the month of March 2016 and May 2016, 2017 at all the sites. Seasonal changes in nitrates was also observed at all the sites and nitrates showed minimum value (0.08 mg/l, 0.07 mg/l, 0.08 mg/l and 0.06 mg/l) during monsoon season and maximum value (0.18 mg/l, 0.16 mg/l, 0.18 mg/l and 0.15 mg/l) during summer season.
(xviii) Nitrites (mg/l)During the present study nitrites showed monthly variations at all the sites. The nitrites at S1 site ranges from 0.076 - 0.199 mg/l (0.13 ± 0.04), S2 site 0.04 - 0.2 mg/l (0.11 ± 0.05), S3 site 0.076 - 0.199 mg/l (0.13 ± 0.04) and at S4 site 0.03 - 0.185 mg/l (0.10 ± 0.05). The nitrites was observed minimum in the month of June 2016, 2017 and maximum value of nitrites was found in the month of March 2016, April 2017, May 2016, 2017 and September 2017 at all the sites. The seasonal variations in nitrites was also observed at all the sites and nitrites showed minimum value (0.08 mg/l, 0.05 mg/l, 0.08 mg/l and 0.04 mg/l) during monsoon season and maximum value (0.19 mg/l, 0.18 mg/l, 0.19 mg/l and 0.16 mg/l) during summer season.
(xix) Silicates (mg/l)Silicates during the present study showed monthly variation at all the sites and at S1 site it ranges from 3.86 - 7.1 mg/l (5.59 ± 0.99), S2 site 2.89 - 6.3 mg/l (4.51 ± 0.97), S3 site 3.82 - 6.55 mg/l (5.15 ± 0.94) and at S4 site 3.72 - 6.25 mg/l (4.94 ± 0.89). At all the sites minimum value of silicates was observed in the month of December 2015 and January 2017 and maximum value in the month of April 2016, 2017 and May 2016. Seasonal variations in silicates was also observed at all the sites and minimum value (4.44 mg/l, 3.39 mg/l, 3.92 mg/l and 3.81 mg/l) of silicates during winter season was observed and maximum value (6.72 mg/l, 5.7 mg/l, 6.32 mg/l and 6.16 mg/l) of silicates during summer season. A parallel trend was evidenced.22
Conclusion
To sustain natural ecosystem and human development water resources play a pivotal role. The biotic and abiotic depict the state of an aquatic ecosystem and their abundance corresponds to the good quality of water. In order to identify magnitude and source of any pollution load it is important to monitor these parameters. There is a variation in the water parameters as the season changes the reason may be in flow and change in the temperature. During the present investigations maximum amount of all the parameters except DO and free CO2 were observed in summer and monsoon season and minimum in winter season.
Acknowledgements
Authors would like to extend sincerest gratitude to the Head, Department of Zoology and Environmental Sciences, Punjabi University, Patiala for providing the necessary laboratory facilities.
Funding
The author(s) received no financial support for the research, authorship, and/or publication of this article.
Conflict of Interest
The authors do not have any conflict of interest.
References
- Sharma, K. C, Chouhan, P. D, Charan, P. D, Nag, M. Water quality and restoration practices of lake Buda Pushkar – a threatened water body of Ajmer, Rajasthan. The Ecoscan 2009; 3(1&2): 53 - 58.
- Pena, E, Suárez, J, Sánchez - Tembleque, F, Jácome, A, Puertas, J. Characterization of polluted runoff in a granite mine, Galicia, Spain, In: A.P. Jarvis, B.A. Dudgeon, P.L. Younger (Eds.) Proceedings of the International Mine Water Association Symposium, University of Newcastle, Newcastle Upon Tyne 1, 2004; 185 - 194.
- Mohan, D, Pittman, C. U, Bricka, J. M, Smith, F, Yancey, B. Mohammad, J. Sorption of arsenic, cadmium, and lead by chars produced from fast pyrolysis of wood and bark during bio - oil production, J Colloid Interface Sci 2007; 310: 57 - 73.
- Shukla, S. R, Pai, R. S. Adsorption of Cu (II), Ni (II) and Zn (II) on modified jute fibres, Bioresour. Tech., 2005;96: 1430 - 1438.
- Trivedi, R. K. Goel, P. K. Chemical and Biological Methods for Water Pollution Studies. India: Environmental Publications 1984.
- American Public Health Association. Standard methods for the examination of water and waste water, 21st (Ed.). New York: American Public Health Association, American Water Works Association & Water Environment Federation 2012.
- Mishra R. R, Rath B, Thatoi H. Water Quality Assessment of Aquaculture Ponds Located in Bhitarkanika Mangrove Ecosystem, Orissa, India. Turkish. J Fish Aquat Sci 2008; 8: 71 - 77.
- Sharma R, Capoor A Seasonal Variations in Physical, Chemical and Biological Parameters of Lake Water of Patna Bird Sanctuary in Relation to Fish Productivity. World Appl Sci J 2010; 8 (1): 129 - 132,
- Thirupathaiah M, Samatha C. H, Chintha S. Analysis of water quality using physico - chemical parameters in lower manair reservoir of Karimnagar district, Andhra Pradesh. Inter J Environ Sci 2012; 3(1): 172 - 180
- Kataria H. C, Gupta, M. K, Kushwaha S, Kashyap S, Trivedi S, Bhadoriya R, Bandewar N. K. Study of physico - chemical parameters of drinking water of Bhopal city with Reference to Health Impacts. Curr World Environ 2011; 6(1): 95 - 99
- Shrivastava, S, Kanungo, V. K. Physico - chemical analysis of pond water of Surguja District, Chhattishgarh, India. Inter J Herbal Med, (2013);1(4), 35 - 43.
- Rao K. D. S, Ramakrishniah M, Karthikeyan M, Sukumaran P. K. Limnology and fish yield enhancement Reservoir (Cauvery River System). J Inland Fish Soc India 2003; 3(5): 20 - 27
- Kirubavathy A. K, Binukumari S, Mariamma N, Rajammal T. Assessement of water quality of Orthupalayam reservoir, Erode District, Tamil Nadu. J Ecophysiol Occupational Health 2005;(5): 53 - 54
- Garg R. K, Saksena D. N, Rao R. J. Assessment of physico - chemical water quality of Harsi Reservoir, district Gwalior, Madhya Pradesh. J Ecophysiol Occupational Health 2006;6(1): 33 - 40
- Parashar, C, Dixit S, Shrivastava R. Seasonal variations in physico - chemical characteristics in upper lake of Bhopal. Asian J Exp Sci 2006;20(2): 297 - 302.
- Suganthini, S. N, and Dias,C. M. On the distribution of fluoride , calcium and magnesium in the waters of the central west coast of India. Mazhasagar –Bull Nati.Inst Oceanogr 1982;15:23 - 28.
- Umavathi S, Longakumar K, Subhashini. Studies on the nutrient content of Sulur pond in Coimbator, Tamil Nadu. J Ecol Environ Conser 2007;13(5): 501 - 504
- Brraich, O. S. Kaur, R. Assessment of physico - chemical parameters and water quality index of Nangal wetland, Punjab (India). J Env Bio - Sci 2015; 29(1): 33 - 39.
- Govindasamy C, Kannan L, Jayapaul Azariah, S. Seasonal variations in physico – chemical properties and primary production in the coastal water biotopes of coromandel coast, India. J Environ Biol 2000; 21:1 - 7.
- Patra, A. P, Patra , J. K, Mahapatra , N. K, Das , S, Swain ,G. C. Seasonal variation in Physico - chemical parameters of chilika lake after opening of New Mouth near Gabakunda, Orissa, India. World J Fish Mar Sci 2010; 2(2):109 - 117.
- Ashokprabu,V, Rajkumar, M, Perumal, P. Seasonal Variations in physico – Chemical characteristics of Pichavaram mangroves, Southeast coast of India. J Environ Biol 2008; 29: 945 - 950.
- Sankar R, Ramkumar L, Rajkumar, M, Jun Sun A, Ananthan G. Seasonal variations in physico – Chemical parameters and heavy metals in water and sediments of Uppanar estuary, Nagapattinam, India. J Environ Biol 2010; 31 (5):681 - 68.


