Water Quality Assessment using Environmetrics and Pollution Indices in a Tropical River, Kerala, SW Coast of India
Sukanya S1
 and Sabu Joseph1
*
and Sabu Joseph1
*
http://dx.doi.org/10.12944/CWE.15.1.04
Envirometrics and pollution indices are proxies to assess water quality of a wetland ecosystem. Hence, the present study is focused on establishing water quality and elucidating the pollution status of Karamana River (KR) in Kerala, SW coast of India. The Karamana River Basin – KRB (n=6th; L= 68 km, A=695 km2), is the main source of water for domestic and drinking purpose in Thiruvananthapuram city. The Killi River (n= 5th; L= 24 km, A= 102 km2), the largest tributary of KR, carry heavy load of pollutants mainly from city and joins KR towards its downstream side. For this study, about 12 sampling stations were selected along the KR from upstream to downstream (interval= ~3km), and water samples (n=12x2= 24) were collected during non-monsoon (NON) and monsoon (MON) of 2015 to assess the variability and sourcing of key hydrochemical variables. Environmetric methods, viz., Pearson Correlation and Principal Component Analysis (PCA) were applied for apportionment of pollution sources significantly responsible for the surface water quality. It was found that sewage effluents and seawater intrusion were the primary factors deteriorating water quality in downstream. Further, the results of water quality analyses and Pollution Indices, viz., Organic Pollution Index (OPI), Eutrophication Index (EI) and Comprehensive Pollution Index (CPI) indicate that lower reaches (L= ~4 km) of KR is seriously polluted. A distinct Zone of Pollution Influence (ZPI) has been delineated based on the indices and this attempt is first of its kind in KR. The present study provides several noteworthy contributions to the existing knowledge on the factors influencing surface water quality and serves as a baseline data for watershed managers and administrators.
Copy the following to cite this article:
Sukanya S. Joseph S. Water Quality Assessment using Environmetrics and Pollution Indices in a Tropical River, Kerala, SW Coast of India. Curr World Environ 2020; 15(1). DOI:http://dx.doi.org/10.12944/CWE.15.1.04
Copy the following to cite this URL:
Sukanya S. Joseph S. Water Quality Assessment using Environmetrics and Pollution Indices in a Tropical River, Kerala, SW Coast of India. Curr World Environ 2020; 15(1). Available from: https://bit.ly/2IY5etb
Download article (pdf) Citation Manager Publish History

Introduction
Over the years, rivers are progressively subjected to environmental stress caused by human intervention.1 Water quality of a river is being carved up by several interrelated factors, which are subjected local and temporal variations in addition to discharge.2 As a result of increased anthropogenic pressure including pollution, large-scale damming, sand mining etc., the natural self purification capacity of rivers becomes restricted to a minimal level.3 Excessive loading of nutrients into the riverine environment in the form of eutrophication turns out to be a threat to human health as well as other biota in freshwater ecosystem.28, 29 Consequently, understanding the extent of water quality degradation and sources of pollution is important for an effective management of water resources.
Conventional techniques of descriptive analysis to interpret river water quality have several limitations4 of not detecting correlation between variables and poor delineation in the pollution source apportionments influencing the quality status. The use of environmetric techniques has potentialities to surpass these limitations.
Environmetrics are multivariate statistical techniques applied in environmental problems. Application of environmetrics, i.e., multivariate statistical techniques, is an important tool for environmental decision making in water quality problems.4 Correlation Analysis and Principal Component Analysis (PA) have been applied successfully in scrutinizing latent factors and mechanisms influencing water quality worldwide.5,6,7,8,9,10,11
Further, pollution indices provide supplementary information on water quality in a single value by comparing different variables as per the standards. A plethora of various water quality indices is available in literature12 and based on the purpose of assessment, water quality indices were formulated worldwide viz., Harkins Index,13 Horton Quality Index,14 Water Quality Index,15 Agricultural Water Quality Index16 etc. Again, to assess the grade of pollution, certain specific pollution indices, viz., Carlson’s Trophic State Index,17 Organic Pollution Index,18 Comprehensive Pollution Index,19 Eutrophication Index20 have been commonly applied in numerous studies.21,22,23,24,25
Karamana River (KR) is the main resource to meet the domestic and drinking purpose of Thiruvananthapuram city. This tropical river is suffering from invariable pressure of fast growing urbanization analogous to other overpopulated river basins globally26,27,28 and the available data on water quality of this river is very sparse. Hence, monitoring the water quality of this river is very relevant in the current scenario. It is against this backdrop, the present study was carried out to provide an overview of pollution status and its underlying sources in KR using environmetric techniques viz., Pearson Correlation analysis and Principal Component Analysis coupled with pollution indices viz., Organic Pollution Index (OPI), Eutrophication Index (EI) and Comprehensive Pollution Index (CPI).
Study Area
The Karamana river basin, KRB (n= 6th; L= 68 km; A = 702 km2), is one of the prominent river basins in southern Kerala, SW India. The basin lies between latitudes 8â°27’36”N to 8â°38’24”N and longitudes 76â°54’0” to 77â°15’0”E. The Karamana river (KR) originates from Chemmunji Motta and Aathiramala peaks of Western Ghats, and flows westward and debouch into the Arabian sea at Poonthura (estuary), SW of Thiruvananthapuram. The Killiyar (n= 5th; L= 24 km, A= 102 km2) merges with KR ~3 km upstream of Poonthura estuary (Fig.1). TS canal (Parvathy Puthanar Canal), running parallel to the coast with untreated sewage effluents rushes in, further pollutes the lower reaches of KR. The average annual stream flow of KR is calculated to be 836Mm3.30
Methodology
The sampling was carried out during non monsoon-NON (March) and monsoon-MON (June) seasons in 2015. A total of 12 sampling stations were identified from upstream to downstream (interval = 3 km) and physico-chemical parameters were analyzed using standard procedures.31,32
Correlation and factor analyses were done using SPSS 17 software. The Spearman correlation was calculated by applying the Pearson correlation formula to the ranks of the data.
Pearson’s correlation analysis (r) is a measure of the extent to which two quantitative variables are linearly related. It summarizes the magnitude of a linear relationship between pairs of variables. The value of relationship takes values ranging from -1 to +1, where +1 represents an absolute perfect positive linear relationship, 0 represents no linear relationship, whereas -1 represents an absolute inverse relationship between the bivariates. The sign in front of the correlation coefficient value determines the direction of the relationship. A plus sign denotes a positive relationship and a minus sign denotes negative correlation. The correlation (r) provides a standardized measure of the linear association between two variables, as given in Eq.1.
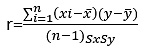
where x and y are the bivariates to be correlated and Sx and Sy are the sample standard deviations of variables x and y, respectively.
PCA reduces a relatively large number of variables into a smaller set of variables that still captures the same information.33PCA is about extracting a set of independent linear combination of parameters of the study so as to capture the maximum amount of variability of a given dataset. PCA can be calculated using Eq.2.
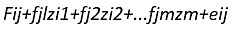
Where j is the measured variable, f is the factor loading, z is the factor score, e is the residual term accounting for errors, i is the sample number, and m is the total number of factors.
Varimax rotation method was applied in factor analysis by rotating the axis defined by PCA according to well-established rules to find a simple structure of datasets. By this method, variables are obtained in which original variables are demonstrated more clearly 33 thus by achieving a simpler and meaningful representation of the underlying factors.34
Further, to evaluate pollution status of the river, the Organic Pollution Index (OPI), Eutrophication Index (EI) and Comprehensive Pollution Index (CPI) were calculated.
Organic Pollution Index (OPI) was calculated by involving the values of four parameters, viz., Chemical Oxygen Demand (COD), Dissolved Inorganic Nitrogen (DIN), Dissolved Inorganic Phosphorus (DIP) and Dissolved Oxygen (DO).18

OPI<0: Excellent; 0-1: Good; 1-2: Begin to be contaminated; 2-3: Lightly polluted; 3-4: Moderately polluted; 4-5: Heavily polluted.18CODs, DINs, DIPs and DOs are the standard concentrations as defined in BIS and WHO.
Eutrophication Index (EI) was used for evaluating the trophic condition of water body.
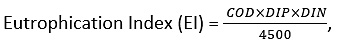
Where, the units of COD, DIN and DIP are mg/L. EI>1: Eutrophication; EI<1: No Eutrophication.20
Comprehensive Pollution Index (CPI) was calculated based on the assessment of single factor index and combined effect of all factors evaluated. CPI is used for evaluating pollution degrees of the water body in various locations.
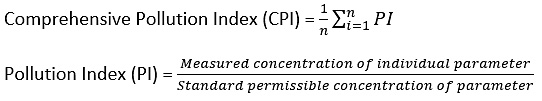
CPI<0.8: Qualified; 0.8-1: Basically quantified; 1-2: Polluted, CPI>2: Seriously polluted.19
Table 1: Portrait of sampling stations with salient features
|
Sample ID |
Sampling stations |
Latitude and Longitude |
Remarks |
|
S1 |
Aryanad Bridge |
N 08â° 34’37.8”, E 77â° 05’12.6” |
Thick riparian vegetation |
|
S2 |
Uzhamalakkal |
N 08â° 35’12.4”, E 77â°03’48.1” |
Rubber plantation |
|
S3 |
Koovakudi Bridge |
N 08â° 34’26.1”, E 77â° 02’14.8” |
Rubber plantation, upstream of dam |
|
S4 |
Aruvikkara Dam |
N 08â° 34’14.8”, E 77â°01’17.3” |
Agriculture, dam, tourism |
|
S5 |
Irumba |
N 08â°33’47.1”, E 77â°00’15.6” |
Illegal sand mining |
|
S6 |
Vellaikkadavu |
N 08â°31’51.6”, E 77â°00’44.9” |
Agriculture, sewage discharge, sand mining |
|
S7 |
Kundamankadavu Bridge |
N 08â°30’57.2”, E 77â°00’03.4” |
Waste dumping visible, sand mining |
|
S8 |
Karamana Bridge |
N 08â°28’39.3”, E 76â°58’12.4” |
Automobile effluents, less flow of river, thickly populated banks |
|
S9 |
Madhupalam |
N 08â°27’48.0”, E 76â°57’28.0” |
Fish kill visible, river velocity very less |
|
S10 |
Kalladimukham |
N 08â°27’11.9”, E 76â°57’36.2” |
Killiyar confluences with Karamana river |
|
S11 |
Thiruvallam |
N 08â°26’25.0”, E 76â° 57’16.0” |
Parvathi Puthanar Canal confluences with Karamana river, Faecal contamination, velocity very low. |
|
S12 |
Poonthura |
N 08â°25’35.0”, E 76â° 57’32.1” |
Estuary, Tourism activities |
 |
Figure 1: Location map of the study area Click here to view Figure |
Results and Discussion
The results of surface water chemistry variables for Non Monsoon (NON) and Monsoon (MON) are summarized in Table 2 and 3. Spatio-temporally, pH ranged from slightly acidic to alkaline.
Table 2: Physico-chemical parameters of Karamana River, Non-monsoon.
|
Parameters |
S1 |
S2 |
S3 |
S4 |
S5 |
S6 |
S7 |
S8 |
S9 |
S10 |
S11 |
S12 |
Mean |
|
Temp (â°C) |
30.1 |
30.4 |
30.2 |
29.3 |
30.2 |
30.4 |
31.6 |
32.3 |
32.6 |
32.3 |
32.8 |
33 |
31.3 |
|
pH |
6.5 |
6.2 |
6.3 |
7.31 |
7.2 |
7.42 |
7.29 |
7.32 |
7.53 |
7.7 |
7.86 |
7.96 |
7.2 |
|
DO (mg/L) |
7.6 |
7.3 |
6.8 |
6.6 |
6 |
6.7 |
6.2 |
5.8 |
3.6 |
1.1 |
0.2 |
0.8 |
4.9 |
|
BOD (mg/L) |
0.6 |
0.8 |
1.1 |
2.4 |
2.9 |
3.8 |
3.6 |
7.3 |
12.8 |
46.2 |
52.3 |
48.2 |
15.2 |
|
COD (mg/L) |
4.1 |
5.9 |
6.3 |
14.3 |
11.2 |
18.7 |
21.2 |
26 |
47 |
88.2 |
127.8 |
119.1 |
40.8 |
|
TH (mg/L) |
14 |
30 |
14 |
19 |
24 |
50 |
62 |
88 |
127 |
153 |
182 |
221 |
82 |
|
Ca (mg/L) |
8.8 |
20.2 |
12.2 |
16.2 |
18.3 |
43.4 |
54 |
73.5 |
109 |
130.2 |
154.3 |
190 |
69.2 |
|
Mg (mg/L) |
0.85 |
8.17 |
0.36 |
1.39 |
0.7 |
4.51 |
6.36 |
10.7 |
15.37 |
20.61 |
24.32 |
29.02 |
10.2 |
|
Na (mg/L) |
1.4 |
1 |
1 |
0.9 |
1.2 |
1.4 |
52.1 |
163 |
221 |
824 |
1569 |
2530 |
447.2 |
|
K (mg/L) |
0.5 |
0.4 |
0.6 |
0.6 |
1.4 |
2.2 |
1.1 |
5.6 |
7.8 |
16.2 |
38.6 |
78.3 |
12.8 |
|
Cl (mg/L) |
12 |
19 |
28.3 |
34.5 |
78.9 |
112 |
219.83 |
290.74 |
336.84 |
758.1 |
912 |
1012.2 |
317.9 |
|
SO4 (mg/L) |
3.3 |
14 |
7.7 |
9.2 |
14.3 |
19.3 |
17.6 |
28.2 |
59.3 |
77.8 |
162.2 |
376.2 |
65.7 |
|
NO3 (mg/L) |
1.2 |
2.6 |
4.2 |
2.3 |
2.2 |
3.7 |
10.2 |
27 |
39 |
46.2 |
49 |
52 |
19.9 |
|
NO2 (mg/L) |
0.17 |
0.27 |
0.3 |
0.22 |
0.28 |
0.37 |
0.46 |
0.61 |
0.62 |
0.68 |
0.71 |
0.75 |
0.4 |
|
NH3 (mg/L) |
0.01 |
0.04 |
0.03 |
0.02 |
0.1 |
0.09 |
0.12 |
0.21 |
0.17 |
0.73 |
0.65 |
0.24 |
0.2 |
|
DIN (mg/L) |
1.38 |
2.91 |
4.53 |
2.54 |
2.58 |
4.16 |
10.78 |
27.82 |
39.79 |
47.61 |
50.36 |
52.99 |
20.6 |
|
DIP (mg/L) |
0.2 |
0.3 |
0.4 |
0.3 |
0.2 |
0.2 |
0.5 |
0.7 |
0.9 |
0.6 |
1.1 |
0.9 |
0.5 |
DO-Dissolved Oxygen, BOD-Biochemical Oxygen Demand, COD-Chemical Oxygen Demand, TH- Total Hardness, DIN-Dissolved Inorganic Nitrogen, DIP-Dissolved Inorganic Phosphorus
Table 3: Physico chemical parameters of Karamana River, Monsoon
|
Parameters |
S1 |
S2 |
S3 |
S4 |
S5 |
S6 |
S7 |
S8 |
S9 |
S10 |
S11 |
S12 |
Mean |
|
Temp (â°C) |
28.4 |
28.8 |
29.3 |
27.2 |
28 |
28.4 |
29.6 |
29.4 |
29.5 |
29 |
30.2 |
29.2 |
28.9 |
|
pH |
6.1 |
6.1 |
6.2 |
7.1 |
6.8 |
6.9 |
6.89 |
7.1 |
7.2 |
7.76 |
7.77 |
7.89 |
6.9 |
|
DO (mg/L) |
8.8 |
9.2 |
8.4 |
8.2 |
7.9 |
7.3 |
7 |
6.6 |
5.4 |
3.7 |
0.8 |
1.2 |
6.2 |
|
BOD (mg/L) |
0.4 |
0.5 |
0.9 |
1.2 |
1.1 |
2.3 |
2.7 |
4.6 |
8.9 |
33.7 |
44.1 |
42.5 |
11.9 |
|
COD (mg/L) |
3 |
4.6 |
5.1 |
7.8 |
9.3 |
13.4 |
17.3 |
23.2 |
43.5 |
81 |
115.9 |
112.3 |
36.4 |
|
TH (mg/L) |
6 |
20 |
8 |
12 |
22 |
43 |
54 |
75 |
112 |
132 |
146 |
213 |
70.2 |
|
Ca (mg/L) |
4.3 |
11.4 |
6.2 |
10.4 |
17.6 |
37.2 |
43.9 |
61.5 |
93.8 |
121 |
128.3 |
182.6 |
59.8 |
|
Mg (mg/L) |
0.8 |
8 |
0.43 |
0.39 |
1.8 |
4.09 |
8.49 |
9.88 |
16.15 |
10.44 |
16.03 |
26.4 |
8.6 |
|
Na (mg/L) |
2.6 |
0.9 |
7.8 |
7.6 |
8.3 |
8.8 |
27.8 |
50.2 |
186.5 |
322.9 |
752 |
1067.8 |
203.6 |
|
K (mg/L) |
0.2 |
0.8 |
0.2 |
0.3 |
2.2 |
3.5 |
3.2 |
2.3 |
4.3 |
9.7 |
11.2 |
15.2 |
4.4 |
|
Cl (mg/L) |
16 |
22 |
22.1 |
30.2 |
72.2 |
108 |
202.4 |
213.25 |
221 |
339.3 |
543.2 |
776.9 |
213.8 |
|
SO4 (mg/L) |
2.2 |
9.8 |
4.3 |
8.2 |
10 |
16.2 |
12.2 |
22.1 |
51.2 |
69.7 |
106.6 |
121 |
36.1 |
|
NO3 (mg/L) |
2.5 |
3.3 |
3.1 |
1.8 |
1.9 |
4.6 |
14.5 |
33.2 |
40.2 |
48.3 |
51.2 |
48.2 |
21.1 |
|
NO2 (mg/L) |
0.21 |
0.34 |
0.4 |
0.54 |
0.55 |
0.6 |
0.72 |
0.82 |
0.77 |
0.79 |
0.81 |
0.87 |
0.6 |
|
NH3 (mg/L) |
0.15 |
0.09 |
0.09 |
0.13 |
0.09 |
0.05 |
0.06 |
0.05 |
0.07 |
0.9 |
0.59 |
1.48 |
0.3 |
|
DIN (mg/L) |
2.86 |
3.73 |
3.59 |
2.47 |
2.54 |
5.25 |
15.28 |
34.07 |
41.04 |
49.99 |
52.6 |
50.55 |
21.9 |
|
DIP (mg/L) |
0.8 |
1 |
1.2 |
0.6 |
0.4 |
0.4 |
0.8 |
0.8 |
1 |
0.9 |
2.1 |
1.2 |
0.9 |
DO-Dissolved Oxygen, BOD-Biochemical Oxygen Demand, COD-Chemical Oxygen Demand, TH- Total Hardness, DIN-Dissolved Inorganic Nitrogen, DIP-Dissolved Inorganic Phosphorus
DO in KR were found to be less than the standard limit (6 mg/L)35 in downstream during both seasons, which is due to the input from nutrient rich Killi river and TS Canal (Fig.1). BOD values exceeded the standard limit (2 mg/L)35 from middle stream towards downstream (i.e., S6 to S12), which shows a strong signature of anthropogenic influence. The BOD signature reflects high loading of organic compounds enhancing microbial growth, thus by reducing the level of DO in the water. The Cl level also showed an increasing trend from station 8 downwards, exceeding permissible limit (250 mg/L)35 for both seasons which shows marine influence. NO3 also exceeded the standard limit (45 mg/L)35 in the last three stations (S10-S12) in the downstream during both seasons (Table 2 and 3) which may be due to sewage input. The overall water quality was good in the upstream and middle stream stretches (S1 to S6); whereas it declined from middle stream (S7) and poor towards downstream, especially the last 4 km stretch of the lower reaches.
The general cation trend during NON was Na+>Ca2+>K+>Mg2+ (Mean=447.17, 69.17, 12.77 and 10.20 mg/L respectively) and Na+>Ca2+>Mg2+>K+ (203.6, 59.85, 8.57 and 4.42 mg/L respectively) during MON. However, the anion trend during NON and MON followed the same order as Cl->SO4->NO3->PO4->NO2- (NON mean=317.87, 65.75, 19.97, 0.52, 0.45 mg/L respectively; MON mean=213.88, 36.12, 21.06, 0.93 and 0.62 mg/L respectively).
From the study, it is evident that most of the attributes like TH, Ca, Mg, Na, K, Cl, NO3, NO2, SO4, BOD and COD exhibited an increasing trend from upstream downwards for both seasons. While, other variables like temperature, NH3 and DIP (Fig. 2) showed an erratic trend, the DO showed a declining trend from upstream to downstream for both seasons (Fig.2).
 |
Figure 2: Spatio-temporal variation of DO, Cl, DIN and DIP from upstream to downstream Click here to view Figure |
Environmetrics
Environmetrics, also known as multivariate statistical analysing techniques, viz.,Correlation and Principal Component analyses were carried out to identify the factors influencing water quality of KR.
Correlation Analysis
Pearson correlation was examined among the major ions and other physical parameters measured.
During NON, the SO4 showed weak correlation (0.408) and insignificant (p ≫ 0.05) correlation with NH3, significant (p < 0.05) and moderate correlation (r ≥ 0.60 to < 0.80) with NO3, DIN and DIP, which suggests that the source of these nutrients might be wastewater effluents discharged into the river, as leaching is not favoured during this dry period. Ca revealed strong significant relationship with Mg, Na, SO4 and Cl, which is an indication of seawater intrusion. During MON, the DO and DIN were significantly associated with strong negative correlation (-0.920), and DIN due to a permutation of both anthropogenic as well as atmospheric inputs. NH3 was in moderate correlation (0.643) and insignificant (p ≫ 0.05). As Mg significantly (p < 0.05) and strongly (r ≥ 0.80) correlated with Na, K and Cl, while K was found to be correlated with Cl and SO4, all implies that the origin of these nutrients are most likely to be the same and the source might be that of leaching. Moderate correlation of SO4 with NO3, NO2 and DIP indicates mixing of nutrient rich sewage with freshwater.
Principal Component Analysis (PCA):
The results of PCA during NON and MON are shown in Table 4 and 5.
In order to determine the factors affecting hydrochemical regime of study area, Principal Component Analysis (PCA) was applied and the analysis during Non monsoon revealed three Principal Components (PCs) effective in explaining the variations in water quality (Table 4).
Table 4: Principal component matrix for KR, Non monsoon
|
Rotated Component Matrixa |
|||
|
Parameters |
Components |
||
|
1 |
2 |
3 |
|
|
Temp |
.868 |
.328 |
.325 |
|
DIP |
.826 |
.367 |
.304 |
|
NO2 |
.805 |
.363 |
.440 |
|
NO3 |
.720 |
.448 |
.512 |
|
DIN |
.719 |
.444 |
.517 |
|
Ca |
.657 |
.590 |
.462 |
|
TH |
.655 |
.590 |
.466 |
|
Mg |
.626 |
.594 |
.465 |
|
SO4 |
.355 |
.917 |
.173 |
|
K |
.336 |
.913 |
.223 |
|
Na |
.346 |
.865 |
.356 |
|
Cl |
.516 |
.625 |
.581 |
|
COD |
.472 |
.623 |
.612 |
|
NH3 |
.386 |
.127 |
.902 |
|
BOD |
.389 |
.585 |
.706 |
|
DO |
-.519 |
-.518 |
-.664 |
|
pH |
.493 |
.372 |
.516 |
|
Eigen Value |
14.63 |
1.09 |
.61 |
|
% of variance |
86.04 |
6.40 |
3.57 |
|
Extraction Method: Principal Component Analysis. Rotation Method: Varimax with Kaiser Normalization. |
|||
|
a. Rotation converged in 6 iterations. |
|||
PC I during Non Monsoon explained 86.04% of total variance (Table 4) with high loadings for temperature, temperature, DIP and NO2 showed strong positive loading (>0.750) whereas, factors such as NO3, DIN, Ca, Mg, total hardness showed moderately positive loading (<0.750) which suggests that nitrification is affected by increase in water temperature, 36and adsorption of DIP into river sediments is increased water temperature conditions 37 during dry season. The NO3, DIN, Ca, TH and Mg showed moderately positive loading, which suggests that NO3 as the major source of DIN in KR. The combination of Ca, Mg and TH revealed that these parameters are influenced by a single source likely seawater intrusion. The results also indicated that there is a continuum mixing between nutrient-rich sewage effluent and seawater. PC II accounts for 6.40% of total variance (Table 4). SO4, K and Na were found to have strong positive loading and this reflects weathering and saline water ingression. The sum of absolute contributions of parameters on PC III yields only 3.57%. Among those factors, NH3 had the strongest loading (0.902), whereas BOD, DO and pH exhibited moderate loading, highlighting anthropogenic pollution. BOD and DO are in a moderate negative relationship.
Principal Component Analysis (PCA) during monsoon revealed three PCs effective in explaining the variations in the water quality, and these factors explained 95.56% of total variance (Table 5).PC I accounted for 85.51% of total variance (Table 5) with a strong positive loading of NH3, Na, K, BOD, SO4, COD and Cl. While DO displayed moderate negative loading; Ca, TH and Mg showed moderate positive loading. This component evinces an influence of marine spray, leaching of secondary salts and surface runoff. The sum of absolute contributions of parameters on PC II yielded only 7.24%. NO2 and pH revealed strong positive loading, whereas; NO3 and DIN had moderate positive loading. The relationship between nitrification and pH has been studied by many researchers38, 39, 40, 41. PC III explained 5.47% of total variance. Temperature and DIP were the parameters having strong positive loading in this component (Table 5). This could have been due to the facts that, phosphate release from sediment increases with increase in temperature, as a result of mineralization.42, 43,44The release of phosphorus at the sediment-water interface results in an increase in dissolved inorganic phosphorus in the overlying water. 43, 45, 46, 43
Table 5: Principal component matrix for KR, Monsoon
|
Rotated Component Matrixa |
|||
|
Parameters |
Component |
||
|
1 |
2 |
3 |
|
|
NH3 |
.928 |
.265 |
.045 |
|
Na |
.879 |
.319 |
.310 |
|
BOD |
.829 |
.391 |
.347 |
|
K |
.825 |
.492 |
.231 |
|
SO4 |
.804 |
.469 |
.350 |
|
COD |
.784 |
.473 |
.377 |
|
Cl |
.776 |
.518 |
.299 |
|
DO |
-.725 |
-.556 |
-.373 |
|
Ca |
.710 |
.636 |
.280 |
|
TH |
.700 |
.638 |
.290 |
|
Mg |
.598 |
.578 |
.375 |
|
NO2 |
.290 |
.923 |
.149 |
|
pH |
.590 |
.761 |
.029 |
|
NO3 |
.508 |
.706 |
.438 |
|
DIN |
.519 |
.704 |
.430 |
|
Temp |
.064 |
.376 |
.888 |
|
DIP |
.445 |
.002 |
.855 |
|
Eigen Value |
14.03 |
1.23 |
0.93 |
|
% of Variance |
85.51 |
7.24 |
5.47 |
|
Extraction Method: Principal Component Analysis. Rotation Method: Varimax with Kaiser Normalization. |
|||
|
a. Rotation converged in 4 iterations. |
|||
Pollution Indices
The results of Organic Pollution Index (OPI), Eutrophication Index (EI) and Comprehensive Pollution Index (CPI) of Karamana River for non monsoon and monsoon 2015 are shown in Table 6 and 7 respectively.
Table 6: Variation of Pollution Indices in Karamana River during Non Monsoon (2015)
|
Sites |
OPI |
Status |
EI |
Status |
CPI |
Status |
|
S1 |
-1.24 |
Excellent |
0.00 |
No Eutrophication |
0.36 |
Qualified |
|
S2 |
-1.04 |
Excellent |
0.00 |
No Eutrophication |
0.37 |
Qualified |
|
S3 |
-0.86 |
Excellent |
0.00 |
No Eutrophication |
0.37 |
Qualified |
|
S4 |
-0.49 |
Excellent |
0.00 |
No Eutrophication |
0.43 |
Qualified |
|
S5 |
-0.54 |
Excellent |
0.00 |
No Eutrophication |
0.45 |
Qualified |
|
S6 |
-0.27 |
Excellent |
0.00 |
No Eutrophication |
0.56 |
Qualified |
|
S7 |
0.16 |
Good |
0.02 |
No Eutrophication |
0.58 |
Qualified |
|
S8 |
0.89 |
Good |
0.11 |
No Eutrophication |
0.85 |
Basically Quantified |
|
S9 |
2.68 |
Lightly |
0.38 |
No Eutrophication |
1.15 |
Polluted |
|
S10 |
5.36 |
Heavily |
0.56 |
No Eutrophication |
3.06 |
Seriously Polluted |
|
S11 |
7.68 |
Heavily |
1.57 |
Eutrophication |
3.48 |
Seriously Polluted |
|
S12 |
7.14 |
Heavily |
1.26 |
Eutrophication |
3.42 |
Seriously Polluted |
Table 7: Variation of Pollution Indices in Karamana River during Monsoon (2015)
|
Sites |
OPI |
Status |
EI |
Status |
CPI |
Status |
|
S1 |
-1.39 |
Excellent |
0.00 |
No Eutrophication |
0.41 |
Qualified |
|
S2 |
-1.33 |
Excellent |
0.00 |
No Eutrophication |
0.44 |
Qualified |
|
S3 |
-1.11 |
Excellent |
0.00 |
No Eutrophication |
0.43 |
Qualified |
|
S4 |
-1.07 |
Excellent |
0.00 |
No Eutrophication |
0.43 |
Qualified |
|
S5 |
-0.98 |
Excellent |
0.00 |
No Eutrophication |
0.43 |
Qualified |
|
S6 |
-0.59 |
Excellent |
0.00 |
No Eutrophication |
0.50 |
Qualified |
|
S7 |
-0.04 |
Good |
0.05 |
No Eutrophication |
0.57 |
Qualified |
|
S8 |
0.75 |
Good |
0.14 |
No Eutrophication |
0.73 |
Qualified |
|
S9 |
2.19 |
Lightly |
0.40 |
No Eutrophication |
0.99 |
Basically Quantified |
|
S10 |
4.59 |
Heavily |
0.81 |
No Eutrophication |
2.38 |
Seriously Polluted |
|
S11 |
7.21 |
Heavily |
2.84 |
Eutrophication |
2.94 |
Seriously Polluted |
|
S12 |
6.72 |
Heavily |
1.51 |
Eutrophication |
2.94 |
Seriously Polluted |
Organic Pollution Index (OPI) in the river index varied between -1.24 to 7.68 during NON and -1.39 to 7.21 during MON (Table 6 and 7), ranging from excellent to heavily polluted categories during both seasons. This range was found to be higher than OPI obtained in few other parts of the world. 47,48This high level of OPI in the downstream (L= 4km) is a clear indication of untreated sewage input and poor dilution capacity of river.3Surface water samples from the locations S1-S8 of KR (fig. 1) were representatives of excellent to good classification based on OPI results.
During NON, Eutrophication Index (EI) ranged from 0 to 1.57, and 0 to 2.84 during MON, which is a clear indication of eutrophication in downstream. Yadav et al. 201824 assessed water quality using EI in Chambal river (North India), and these EI values were lower compared to values obtained in KR. High EI values (>1) clearly indicated mixing of nutrient- rich water in lower stretch (L=3 km; S11 and S12). TS canal overloaded with pollutants49 confluences at this region, marking it as one of the major threatening point sources of pollution in KR (fig.3).
Comprehensive Pollution Index (CPI) values ranged from 0.36 to 3.48 during NON and 0.41 to 2.94 during MON, which could be classified from qualified to seriously polluted during both seasons. These values were much higher than CPI of few other Indian rivers, 24,50 but much lesser than CPI of Hindon river, North India, 51 which ranged from 2.68 to 7.12. The results of CPI followed almost same trend as OPI.
Compiling the results obtained from pollution indices and water quality assessment, it is evident that the final 4 km stretch of KR is severely polluted. Intriguingly, this stretch coincides with the zone identified as one of the most critically polluted Indian River stretches based on Criteria-I by CPCB. 52From these results, a distinct stretch of ~4km in the downstream up to estuary is identified as the “Zone of Pollution Influence (ZPI)” (Fig. 3).
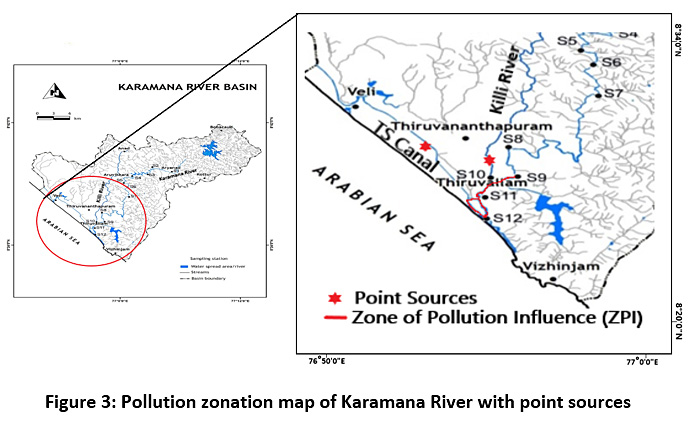 |
Figure 3: Pollution zonation map of Karamana River with point sources Click here to view Figure |
Conclusion
The results of study seem to provide evidence on the water quality variations in Karamana River-KR (Kerala, India). From the physico-chemical analyses of surface water samples for non-monsoon (NON) and monsoon (MON) seasons, it is interpreted that water quality is good from upstream to middle stream (L=45 km). Most of the parameters (pH, Cl, DO, BOD, NO3 etc.) exceeded CPCB 1995 desirable limits35 in the hindmost stretch of downstream region (L=4 km). The application of Environmetric analysis viz. Pearson Correlation Analysis and Principal Component Analysis (PCA) connote that hydrochemical attributes of KR is primarily governed by natural (weathering, atmospheric deposition, seawater intrusion) as well as anthropogenic (sewage inflow) perturbation. The above findings are corroborated by the Eutrophication Index (EI) values, and based on this; river is affected by eutrophication in the last ~ 3 km of lower reaches. Again, the results of Comprehensive Pollution Index (CPI) and Organic Pollution Index (OPI) indicate that the downstream ~ 4 km fluvial stretch, up to estuary is severely polluted. The identified zone of pollution influence (ZPI) in this river needs utmost attention by stakeholders and administrators for pollutant mitigation programmes. Application of environmetric and pollution index tools is an emergent technique in this river; consequently, very little work has been reported on relationship of physicochemical parameters and water pollution source apportionments in KR. These environmental tools provided a more objective interpretation of surface water physicochemical parameters and identification of pollution source as part of the effort toward sustainable management of this river basin.
References
- Agarwal S. K. Water pollution. 2005; 2. APH publishing.
- Mandal P, Upadhyay R, Hasan A. Seasonal and spatial variation of Yamuna River water quality in Delhi, India. Environ Monit Assess.2010; 170(1):661–670
- Wen Y, Schoups G, Van De Giesen N. Organic pollution of rivers: Combined threats of urbanization, livestock farming and global climate change. Scientific reports. 2017; 7, 43289.
- Hipel, K. W, McLeod A. I. Time series modelling of water resources and environmental systems.1994; 45 Elsevier.
- Buck O, Niyogi D. K, Townsend, C. R. Scale-dependence of land use effects on water quality of streams in agricultural catchments. Environ. Pollut.2004; 130(2):87-299.
- Prathumratana L, Sthiannopkao S, Kim K. W. The relationship of climatic and hydrological parameters to surface water quality in the lower Mekong River. Environ. Int.2008; 34(6):860-866.
- Yu S, Xu Z, Wu W, Zuo D. Effect of land use types on stream water quality under seasonal variation and topographic characteristics in the Wei River basin, China. Ecol. Indic.2016; 60:202-212.
- Shil S, Singh U. K, Mehta P. Water quality assessment of a tropical river using water quality index (WQI), multivariate statistical techniques and GIS. Appl. Water Sci. 2019; 9(7), 168.
- Iqbal K, Ahmad S, Dutta V. Pollution mapping in the urban segment of a tropical river: is water quality index (WQI) enough for a nutrient-polluted river?. Appl. Water Sci. 2019; 9(8), 197.
- Chatanga P, Ntuli V, Mugomeri E, Keketsi T, Chikowore N. V. Situational analysis of physico-chemical, biochemical and microbiological quality of water along Mohokare River, Lesotho. Egypt. J. Aquat. Res. 2019; 45(1), 45-51.
- Tripathi M, Singal S. K. Use of Principal Component Analysis for parameter selection for development of a novel Water Quality Index: A case study of river Ganga India. Ecol. Indic.2019; 430-436.
- Poonam T, Tanushree B, Sukalyan C. Water quality indices important tools for water quality assessment: a review. IJAC. 2013; 1(1), 15-28.
- Harkins R. D. An objective water quality index. J. Water Pollut. Control Fed. 1974; 588-591.
- Horton, R. K. An index number system for rating water quality. J. Water Pollut. Control Fed.1965; 37(3), 300-306.
- Brown R. M, McClelland N. I, Deininger R.A, O’Connor M. F. A water quality index—crashing the psychological barrier. In Indicators of environmental quality. 1972; pp. 173-182. Springer, Boston, MA.
- Cooper J, Rediske R, Northup M, Thogerson M, Van Denend J. Agricultural water quality index.Robert B Annis Water Resources Institute, Grand Valley State University, Allendale. 1998; p 75. WRI Publication, MR-98-1.
- Carlson R. E. A trophic state index for lakes. Limnol. Oceanogr.1977; 22(2), 361-369.
- Quan W. M, Shen X.Q, Han J.D, Chen Y.Q. Analysis and assessment on eutrophication status and developing trend in Changjiang Estuary and adjacent sea. Mar. Environ. Res.2005; 24(3), 13-16.
- Zhao Y, Xia X.H, Yang Z. F, Wang F. Assessment of water quality in Baiyangdian Lake using multivariate statistical techniques. Procedia Environ. Sci.2012; 13, 1213-1226.
- Zhang Y, Yu J, Jiang Z, Wang Q, Wang H. Variations of summer phytoplankton community related to environmental factors in a macro-tidal estuarine embayment, Hangzhou Bay, China. J. Ocean Univ. China. 2015; 14(6), 1025-1033.
- Osgood R.A. A Carlson-type Trophic State Index for nitrogen in Florida Lakes-Discussion. Water Resources Bull. 1982; 18(2), 343-343.
- Barnwal P, Mishra S, Singhal S. K. Risk assessment and analysis of water quality in Ramgarh Lake, India. J.Integ.Sci and Tech.2015; 3(1), 22-27.
- Krika A, Krika F. Assessment of surface water quality of Mencha River, Northeastern Algeria by index method. CJES.2017; 15(2), 157-164.
- Yadav N. S, Kumar A, Mishra S, Singhal S. (2018). Assessment of Water Quality using Pollution-Index in the study stretch of River Chambal, India. Integ. Res. Advances. 2018; 5(1), 20-25.
- Sheela A. M, Letha J, Joseph S. Environmental status of a tropical lake system. Environ. Monit. Assess. 2011; 180(1-4), 427-449.
- Kaur S, Singh I. Accelerated phosphate and nitrate level: factors to blame for eutrophication in Yamuna River, Delhi, India. Int J Plant Anim Environ Sci. 2012; 2, 183-187.
- Haritash A.K, Gaur S, Garg S. Assessment of water quality and suitability analysis of River Ganga in Rishikesh, India. Appl Water Sci.2016; 6, 383–392. doi:10.1007/s13201-014-0235-1
- Nguyen T.T, Némery J, Gratiot N, Strady E, Tran V.Q, Nguyen A.T, Aimé J, Peyne A. Nutrient dynamics and eutrophication assessment in the tropical river system of Saigon–Dongnai (southern Vietnam). Sci. Total Environ.2019; 653, 370-383.
- Glibert P.M. Harmful Algae at the Complex Nexus of Eutrophication and Climate Change. J.Colloid and Interface Sci.2019, 538, 34-44.
- CWRDM. Water atlas of Kerala. 1995. Centre for Water Resources Development and Management (CWRDM) Publication, Kozhikode, Kerala.
- APHA (American Public Health Association). Standard Methods for the Examination of Water and Wastewater. 2012. Clesceri L.S, Greenberg A.E, Eaton A.D, eds., 22nd ed. American Public Health Association, Washington, DC.
- Trivedy R. K, Goel P. K. Chemical and Biological methods for water pollution studies, Karad. Env. Publ. 1984; 1, 251.
- Helena B, Pardo R, Vega M, Barrado E, Fernandez J, Fernandez L. Temporal evolution of groundwater composition in an alluvial aquifer (Pisuerga River, Spain) by principal component analysis. Water Res. 2000, 34(3):807–816
- Cho K.H, Park Y, Kang J, Ki S.J, Cha S, Lee S.W, Kim J.H. Interpretation of seasonal water quality variation in the Yeongsan Reservoir, Korea using multivariate statistical analyses. J Hydroinform.2009,59(11):2219–2226
- CPCB, Central Pollution Control Board. Classification of Inland surface waters (CPCB Standards). Water Quality Parivesh. 1995; 1(4), 6.
- Wilczak A, Jacangelo J. G, Marcinko J. P, Odell L. H, Kirmeyer G. J. Occurrence of nitrification in chloraminated distribution systems. Journalâ€American Water Works Association. 1996; 88(7), 74-85.
- Sugiyama S, Hama T. Effects of water temperature on phosphate adsorption onto sediments in an agricultural drainage canal in a paddy-field district. Ecological engineering. 2013; 61, 94-99.
- Cooper A. B. Developing management guidelines for river nitrogenous oxygen demand. J WaterPollut Control Fed. 1986; 845-852.
- Bae W, Baek S, Chung J, Lee Y. Optimal operational factors for nitrite accumulation in batch reactors. Biodegradation. 2001; 12(5), 359-366.
- Grunditz C, Dalhammar G. Development of nitrification inhibition assays using pure cultures of Nitrosomonas and Nitrobacter. Water Res.2001; 35(2), 433-440.
- Xia X. H, Yang Z. F, Huang G. H, Zhang X. Q, Yu H, Rong X. (2004). Nitrification in natural waters with high suspended-solid content––A study for the Yellow River. Chemosphere. 2004; 57(8), 1017-1029.
- Jensen H. S, Andersen F. O. Importance of temperature, nitrate, and pH for phosphate release from aerobic sediments of four shallow, eutrophic lakes. Limnol. Oceanogr.1992; 37(3), 577-589.
- Watson S. J, Cade-Menun B. J, Needoba J. A, Peterson T. D. Phosphorus forms in sediments of a river-dominated estuary. Front. Mar. Sci.2018; 5, 302.
- Wang J, Chen J, Ding S, Guo J, Christopher D, Dai Z, Yang H. Effects of seasonal hypoxia on the release of phosphorus from sediments in deep-water ecosystem: A case study in Hongfeng Reservoir, Southwest China. Environ. Pollut.2016; 219, 858-865.
- Aydin I, Aydin F, Hamamci C. Phosphorus speciation in the surface sediment and river water from the Orontes (Asi) River, Turkey. Water Environ. Res. 2010; 82(11), 2265-2271.
- Hou D, He J, Lü C, Sun Y, Zhang F, Otgonbayar K. Effects of environmental factors on nutrients release at sediment-water interface and assessment of trophic status for a typical shallow lake, Northwest China. TSWJ. 2013.
- Benkhedda B, Belguermi A, Tayeb A, EL-Amine B. M, Fethi D, Youssouf M. Organic pollution assessment and biological quality of the River Oued Rhiou (Algeria). Int J Sci Basic Appl Res. 2014; 18(1), 33-44.
- Nireti, L. R. A. Characterization of Ouémé River Quality in Upper Delta Using Water Evaluation Indices and Multivariate Analysis.Eur Sci J. 2017; 13 (17), 170-182.
- Karthika V.S, Harsha Mahadevan, Viswadas V, Vinu V.Dev, Anoop Krishnan K. An integrated approach on evaluation of hydrochemical parameters of riverine systems in Trivandrum urban area slong with phosphate removal studies. BPAS. 2018; 37C (1), 126-130.
- Chaudhary M, Mishra S, Kumar A. Estimation of water pollution and probability of health risk due to imbalanced nutrients in River Ganga, India. Int. J. River Basin Manag. 2017; 15(1), 53-60.
- Mishra S, Kumar A, Shukla P. Study of water quality in Hindon River using pollution index and environmetrics, India. Desalin. Water Treat.2016; 57(41), 19121-19130.
- CPCB, Central Pollution Control Board. More river stretches are now critically polluted: CPCB. The Hindu (News article). 2018.


