Analysis of Ambient Air Quality Based On Exceedance Factor and Air Quality Index for Siliguri City, West Bengal
Subham Roy1
*
 and Nimai Singha2
1
Department of Geography and Applied Geography,
University of North Bengal,
Siliguri,
734013
WestBengal
India
2
Department of Geography,
Cooch Behar Panchanan Barma University,
Coochbehar,
736101
West Bengal
India
http://dx.doi.org/10.12944/CWE.15.2.11
Bad air is one of the key concerns for most of the urban centres today, and Siliguri is no exceptions to this. In order to assess the air quality of Siliguri, Exceedance factor (EF) method was applied based on the average annual concentration of the pollutants named as; NO2, SO2, PM2.5 and PM10 and it is found that PM2.5 and PM10 are the major pollutants that pose a severe threat for the city. After applying the EF method, it is found that the values of PM2.5 was between moderate to high pollution level and for PM10 it falls under high to critical pollution level. On the other hand, the concentration of NO2 and SO2 falls under moderate to low pollution level. Through trend analysis of the various pollutants, it is found that their concentration was varying in nature. In case of PM10, the trend shows high concentration which exceeds national standard; whereas PM2.5 shows its concentration near towards violating the national standard soon if not checked. In contrast, trends of NO2 and SO2 were recorded lower than the national standard. The present situation of ambient air of Siliguri was analyzed based on Air Quality Index which reveals that air quality of the city can be classified into two seasons, i.e. clean air period (from April to October) and polluted period (from November to March). Lastly, the annual trends of PM2.5 and PM10 were constructed as they are the major pollutants, and it shows their skewed nature during winter months which results in smog episodes. It unveils how critical the situation of air quality of Siliguri became especially during winter months which seek immediate attention. Thus the study tries to present a vivid scenario about the present air quality of Siliguri, which concludes with some of the suggestions to restrain the air quality.
Copy the following to cite this article:
Roy S, Singha N. Analysis of Ambient Air Quality Based On Exceedance Factor and Air Quality Index for Siliguri City, West Bengal. Curr World Environ 2020; 15(2). DOI:http://dx.doi.org/10.12944/CWE.15.2.11
Copy the following to cite this URL:
Roy S, Singha N. Analysis of Ambient Air Quality Based On Exceedance Factor and Air Quality Index for Siliguri City, West Bengal. Curr World Environ 2020; 15(2). Available from: https://bit.ly/2zKImwd
Download article (pdf)
Citation Manager
Publish History

Introduction
In the past few years, a significant enhancement in the process of prevention and management of air pollution was seen, instead of this advancement, air pollution has continued to be foremost environmental health vulnerability to humans. In many third world countries, the intensity of air pollution goes beyond the maximum boundary as set by the guidelines of the World Health Organization.1 Due to the rapid urbanization and industrialization, air pollution has become the foremost environmental trouble in equally developed and developing countries.2 About 60 % of air pollution is contributed by automobile exhaust emission in Indian cities.2 Further, vehicular emission contains more than 450 different organic chemical compounds.2 Rapidly growth of motor vehicles with time has resulted in traffic congestion, air pollution and noise problems.3 However, the Transportation sector is associated with the emission for about 50% of nitrogen oxide (NOx) and 90% of the carbon monoxide (CO).4
Air pollution has been portrayed as a “great killer of our age” and as “key hazard to human wellbeing” as because it can extremely damage to human health irrespective of sex and ages5. According to the UN Environment Programme calculates approximately worldwide, about 1.1 billion people suffer from breathing problems due to detrimental air conditions.6 Also, report has been compiled from Medical science investigation, which revealed that the concentration of air particles are interrelated with varieties of impact on individual health, specifically on cardio and respiratory system.6
Thus the study attempt to investigate the condition of air quality and its prospective threat to the expanding city of Siliguri by applying the Exceedance factor method. After using the EF method, it reveals the menace related to the pollutants which need to be averted soon; either Siliguri will quickly become a noxious city to live. Furthermore, to comprehend the concentration of the various pollutants, Trend analysis was done, which portrays that how PM10, followed by PM2.5, was the dominant warning for the city. Moreover, Air Quality Index method was applied for assessing the present scenario of ambient air quality of Siliguri. It fascinatingly uncovers that the air quality of the city can be divided into two seasons, i.e., the period of clean air quality and the polluted period. The study also reveals that PM10 and PM2.5 was the primary threat to the city. Therefore these two pollutants were examined further for the year 2019, and interestingly it reveals the nature of these pollutants and how it varied seasonally.
According to our knowledge, there are very few studies done over the ambient air quality of Siliguri. Thus to fill this gap, we conducted our study over ambient air quality of Siliguri based on available literature and data. The purpose of this study was to; 1) assess the air quality status along with pollution level based on Exceedance factor for Siliguri, 2) analyze the concentration and trends of various pollutants (from 2014-2018), 3) to know about the present situation of air quality of the city based on Air Quality Index (AQI) and 4) identify the current trends of PM2.5 and PM10 as a noteworthy pollutant. Hence this study tries to highlight the past and present situation of air quality of Siliguri and shows how it became getting deteriorate with time so that adequate measures can be taken to prevent the air quality before it gets worsen.
Study Area
Siliguri is a gateway of North-east India, which is a swiftly growing city with a strong base of trade and commerce as a significant economic activity. In the present study, the Siliguri municipality was selected which was spread over 41.9 sq.km with more than 5 lakh population. The objective behind the selection of the study area was its strategic location, which makes it a base for trade and commerce, tourism activity, a center of rapid population growth, the nucleus of employment, and also necessary supply to the whole north-east region. All these lead to massive traffic congestion, which ultimately causes enormous air pollution and disturbed the ambient air quality of the city. Siliguri is popularly called ‘gateway’ or ‘the chicken neck’ of north-east India since it’s connected between the north-eastern states with entire India. The city expands over two districts of Darjeeling and Jalpaiguri under the state of West Bengal. The coordinate of the city is from 26°43’N and 88°26’E at the base of Himalaya. The river Mahananda is a trans-boundary river that crosses through the heart of the city.
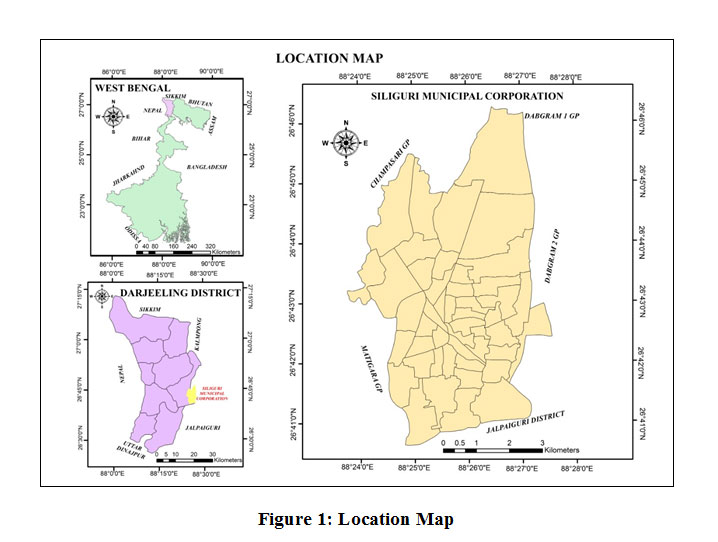 |
Figure 1: Location Map Click here to View Figure |
Data and Methodology
For the evaluation of air quality of Siliguri, all the information was collected and analyzed based on the data available from the Central Pollution Control Board (CPCB) and West Bengal Pollution Control Board (WBPCB). At present, Siliguri has only one automatic air monitoring station located at ward no.32, Babupara (near Tinbatti more). In order to evaluate the pollution intensity and air quality status, Exceedance Factor (EF) method given by CPCB has been applied. EF is the “proportion of the yearly average concentration of a pollutant and its particular standard”.6
The Exceedance Factor method was calculated below; .6
Exceedance Factor (EF) = Yearly average concentration of the pollutant
Yearly standard for that particular polluant
Based on the equation, air pollution can be classified into four criteria;
- Critical pollution (C): EF is above 1.5;
- High pollution (H): EF is between 1.0–1.5;
- Moderate pollution (M): EF between 0.5–1.0; and
- Low pollution (L): EF is below 0.5.
For trend analysis of various air pollutants and their concentration, manual data (2014-2018) has obtained from WBPCB with given National Ambient Air Quality Standards (NAAQS), which has shown through clustered column graph. The targeted frequency of manual data collection was bi-weekly, so it could achieve a minimum of 104 days in a year as set by NAAQS. However, 104 days of data were not available as totaled for the year 2014, 2015, 2016 and 2018, in that case, 40 or additional days of monitoring annually was consider ample for data evaluation.7 As summed up, twice a day in the week from the manual dataset of WBPCB from 2014 to 2018, it was 102 days for 2013, 99 days for 2015, 103 days for 2016, 104 days for 2017 and 103 days for 2018 respectively. In order to know about the present scenario of the air quality of Siliguri, AQI data of 2019 was prepared based on the automatic station of Siliguri, which was presented through the master table with different colors accordingly to their health impact and pollution level for the ease of understanding. This master table shows a clear picture about the present air quality of Siliguri for the year 2019. For the preparation of this master table of AQI data of 2019, daily mean average data of 24 hours was collected and noted for analysis from AQI bulletin of CPCB. Lastly, for understanding the trends of PM2.5 and PM10, a trend line was constructed; this trend line was prepared based on data collected from automatic station thrice a month at a regular interval of the first week, second week and third week of a month. This trend line shows a sudden peak during the winter months and its reason has been discussed below.
Air Quality Index
Air Quality Index is a tool designed for an efficient statement of air quality conditions to the public in expressions, which are simple to comprehend. It converts difficult air quality records of a variety of pollutants into a distinct value classification and color.8 At present, there are six types of Air Quality index which are simple to understand and every type has a specific color that is interrelated with human health impacts. These types are categorized as Good, Satisfactory, Moderately polluted, Poor, Very Poor, and Severe. According to Indian National Air Quality Standards as notified by CPCB set 12 consideration which are nitrogen dioxide (NO2), carbon monoxide (CO), sulfur dioxide (SO2), PM2.5, PM10 (Particulate matter include small than 2.5 microns and 10 microns), Ozone (O3), Lead (Pb), Ammonia (NH3), Benzene (a) Pyrene (BaP), Benzene (C6H6), Arsenic (As), and Nickel (Ni). The primary eight constraints have both short-range of about 1, 8 and 12 hours and yearly standards, excluding for carbon monoxide and Ozone while remaining four constraints comprise only yearly standards.9 Every single one of these pollutants could not be noted at every location. Generally, AQI is given only if at least three pollutants recode are available among which one ought to be either PM2.5 or PM10. Otherwise, analyzing AQI is not possible, correspondingly a minimum 16 hours of data is compulsory required for calculating sub-index.10, 11
Results and Discussion
Air Quality Status and Pollution Level
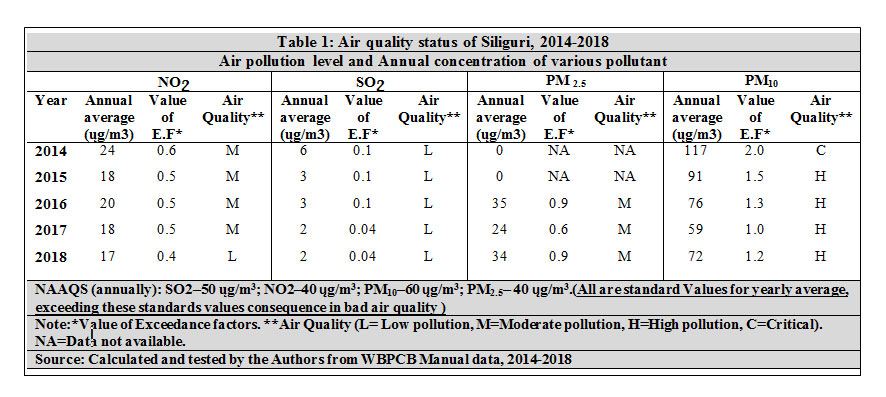 |
Table 1: Air quality status of Siliguri, 2014-2018) Click here to View Table |
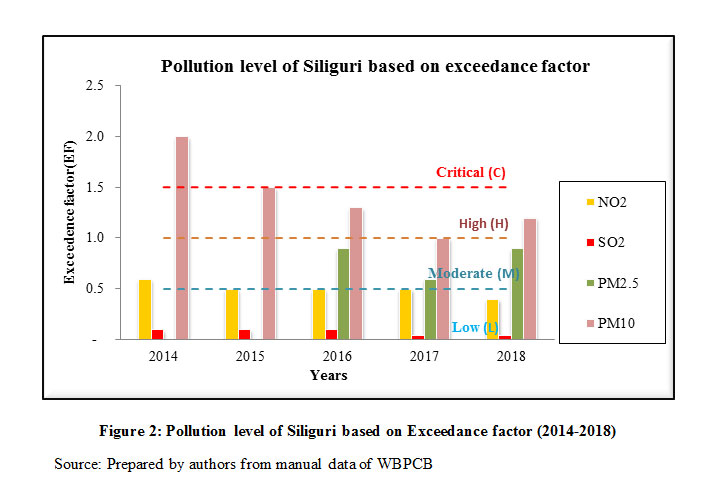 |
Figure 2: Pollution level of Siliguri based on Exceedance factor (2014-2018) Click here to View Figure |
To analysis, the status of air quality and pollution level, the Exceedance factor (EF) method was applied as shown in table 1, which revealed that SO2 (Sulfur dioxide) recorded low in all the years. On the other hand, the concentration of NO2 (Nitrogen dioxide) shows a moderate level from the year 2014 to 2017, and it came down to low during 2018. On average, the pollution level from NO2 was at a moderate level in Siliguri. The Exceedance value for the NO2 in all consecutive years, i.e., from 2014 to 2017, was within 0.5 to 0.6, which is a moderate level, excluding the year 2018. The data for PM2.5 was not available for the years 2014 and 2015, but from 2016 to 2018, it shows a significant amount of concentration in the city, as the range of PM2.5 range between moderate to high between these years. The concentration of PM2.5 based on the Exceedance factor method was 0.9 for 2016, falls to 0.6 for 2017, and again suddenly spike to 0.9 for 2018. Thus it is undeniable that in the near future, it will surpass the moderate limit to high as well as to critical value indeed. In contrast, the level of PM10 was severe in all the years, as it ranged from critical to a high level from 2014 to 2018. For the year 2014, the value of PM10 is 2.0, which is above the critical value, followed by 1.5 for the year 2015, 1.3 for 2016, 1.0 for the year 2017, and 1.2 for 2018. So it is clear and lucid from the table that PM10 was the primary warning for the city because it can cause severe damage to the respiratory system as well as evoke many health complications. Thus it may be presumed that PM2.5 and PM10 are the significant pollutants for Siliguri, which seeks immediate action to restraint these particulate matters. It indicates that the ambient air quality of Siliguri has become treacherous, and it must not be considered as a city for healthy living. Many health implications arises mainly cardiovascular and respiratory problems due to these particulate matters as the air becomes detrimental to breathe day by day, which poses a severe threat for the people residing in the city.
The diagram below portrayed based on table 1, also clearly portrays that among all the pollutants, PM10 is the foremost pollutants as because it lies among critical to a high level in all successive years. Furthermore, PM2.5 trail with PM10 as it positioned between a high to a moderate level and soon exceeds the limit of high to critical if not prevent yet. Similarly, for the case of NO2, this is the most suitable time to restrain it, or either it will also infringe the limit of moderate to high and became hazardous pollutants for the city in no time. Besides, SO2 remains within a low controlled level.
With rapid trends of urbanization and population growth, Siliguri tends to be a haphazard city, also due to increases in the number of vehicles day by day intensify the congestion of the city. Emissions from diesel-run city autos are considered as the primary culprit behind the hike in the pollution level of Siliguri apart from that; large scale construction work of roads and multistory buildings also contribute to the pollution level in the city.12 Thus it clears the fact that combustion from vehicles as well as construction works contributes as a major source for PM2.5 and PM10 in the city.
Trends of Pollutants and its Concentration
 |
Figure 3:Trends of pollutants and |
In order, to understand the tendency of air quality and concentration of a variety of pollutants, trend analysis was done from 2014 to 2018 based on pollutants; named as SO2, NO2, PM2.5, and PM10 which has been shown in figure 3 below. Among all the pollutants, SO2 has recorded the lowest annual average based on the criteria set by NAAQS, which is 50ųg/m3. For the year 2014, the annual average for SO2 in Siliguri was 6 ųg/m3, followed by 3ųg/m3 for the year 2015 and 2016, which even fall to 2 ųg/m3 for the year 2017 and 2018 respectively. Hence it is clear that the concentration of SO2 in Siliguri was low and further declining in nature. Also, in the case of NO2, the annual concentration recorded was lower than the annual standard criteria set by NAAQS, which is 40ųg/m3. The annual concentration of NO2 for the year 2014 was 24ųg/m3, followed by 18 ųg/m3 for the year 2015, 20ųg/m3 for 2016, again 18 ųg/m3 in 2017 and fall to 17ųg/m3 in 2018. So the trend of NO2 in Siliguri was fluctuating in nature and it is within a tolerable limit. Whereas PM2.5 also shows uneven nature, as the average annual concentration was 35 ųg/m3 for 2016, which came down to 24 ųg/m3 in 2017 and again rises to 34ųg/m3 in 2018 (data for 2014 & 2015 was not available). Moreover, the annual concentration of PM2.5 was almost to violate the annual standard criteria set by NAAQS, which is 40ųg/m3. In contrast to all these three pollutants which show lower annual concentration than the annual standard set by NAAQS, the concentration of PM10 was recorded higher for all the years except 2017. For the year 2014, the average annual concentration of PM10 was 117ųg/m3, followed by 91ųg/m3 in 2015, 76ųg/m3 in 2016, again drop to 59ųg/m3 in 2017 (which is lower than NAAQS annual average standard of 60ųg/m3) and again increases to 72ųg/m3 in 2018. So it can be said that the trends of various pollutants in Siliguri was varying in nature. According to the figure above, the only pollutants that violating the national standard set by NAAQS is PM10, along with the concentration of PM2.5 is near about the national standard and it can be presumed that it would infringe the limit soon within a couple of years or in a little while.
Present Situation of Air Quality of Siliguri Based on AQI
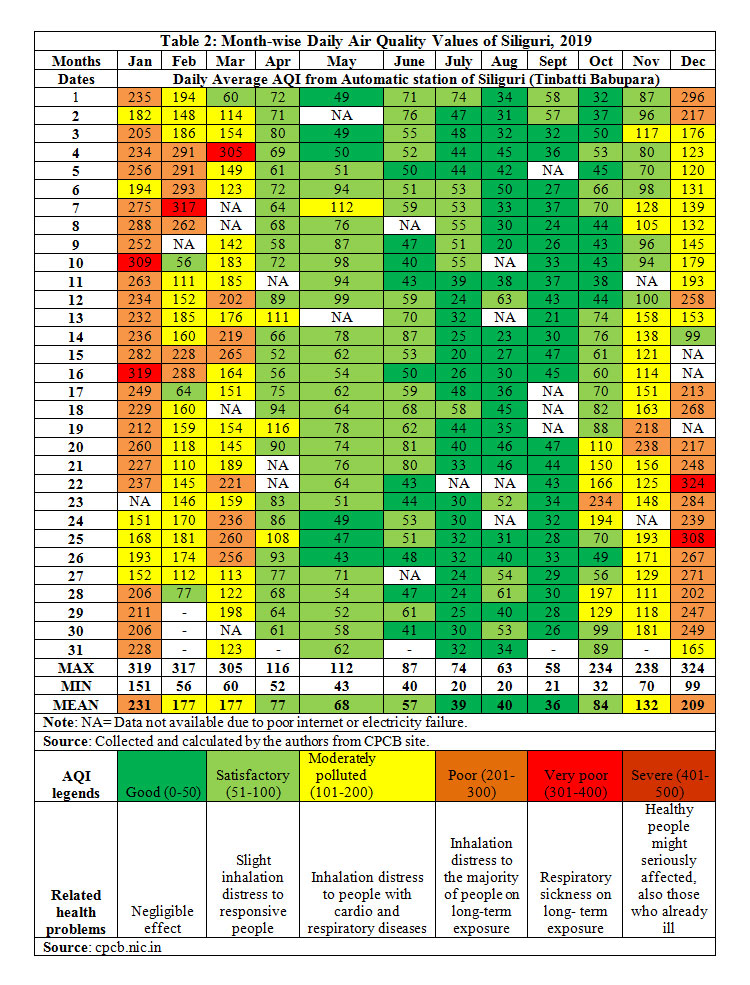 |
Table 2: Month-wise Daliy Air Quality Value of Siliguri, 2019 |
Based on the master table 2 below, which has been prepared based on the daily average data of AQI. From this table, it vividly portrays that the Siliguri air quality can be divided into two seasonal variations viz, the period of clean air quality (from April to October) and polluted period (November to March). This type of variations mainly takes place due to seasonal effect as because the location of Siliguri falls under Northern India, and during winter month’s vertical winds over Siliguri drops as high pressure prevails on the ground which results in the concentration of pollutants at the surface for a more extended period and so recording the high pollution levels. The table revealed that January and December were the months when the air quality of Siliguri became worst as the monthly mean for January and December are 231 and 209, respectively which revealed that these months undergo poor air quality which may lead to the distress of breathing for the majority of people. The month of December recodes with a maximum value of AQI, which is 324, and it represents inferior air quality during that day. While January also recodes very poor values of air quality, i.e., 319 and 309. Whereas February, March, and November were the months when air quality became moderately polluted as the monthly averages for these months are 177, 177 and 132 respectively. However, still in this situation, breathing discomfort may take place to heart patients, children’s and older people. On the other hand, April to October registers the clean period with minimal air pollution levels. Among these month’s July to September record the safest air quality and it is due to the monsoonal effect over northern India that suppress the pollutants material. The monthly mean for July, August, and September are 39, 40 and 36 respectively which clearly shows that these three months are the cleanest and safest months among all. It is well predicted that pollution troubles are even worse by a constant atmospheric situation, such as sinking and creation of inversion layers during the pre-monsoon season, or at some stage in monsoon break periods. Through the monsoon period, intense rainfalls wash out aerosols and uncontaminated the air. New studies have recommended that excessive air pollutants in the atmosphere have a direct impact on the hydrological cycle by considerably changing the energy stability in the atmosphere.13 So it can be said that the air quality of Siliguri shows seasonal variation as during winter it became an unpleasant city to live, in contrast during summer the nature of air quality became amiable.
Trends of PM2.5 and PM10
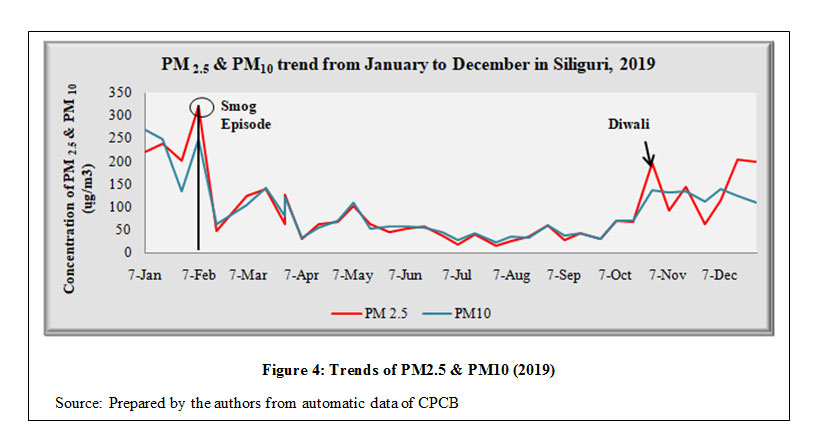 |
Figure 4: Trends of PM2.5 & PM10 (2019) Click here to View Figure |
The figure above clearly revealed that the peak of both PM2.5 and PM10 was high during the winter months of January to February, also smog episode have been noticed on the same period during early February and during Diwali. On the other hand, the concentration of PM2.5 and PM10 was started to drop from the beginning of March and came down to the standard average during the monsoon period of June to September. The phenomenon of Smog episodes for the period of winter months like November to February is primarily due to restricted intensification of air pollution because inauspicious meteorological conditions make this happen; like modest wind conditions and temperature inversion. These consequences in the extremely inadequate spreading of air pollution, which ultimately results in amplifying the smog episodes.14 As we know, Diwali is considered as the occasion of the illumination and fireworks which has been celebrated at some point in the months of October to November in our country. During these Diwali nights, ignition of firecracker is very common and these firecrackers contain a huge amount of potassium nitrate followed by carbon and sulfur. As a result the ignition consequences in liberating a massive amount of pollutants like NO2, PM10, and SO2 in the atmosphere for a short period, which can correlate with a sudden peak of smog in the surrounding environment and can extremely, deteriorate the ambiance of air.15 So it is clear that trends of PM2.5 and PM10 became atrocious in the winter season and also during Diwali season, which came to normal during summer due to monsoonal effect.
Conclusion
The significance of the study was to understand the concentration of major ambient air pollutants and their trends in the Siliguri city. Also, the AQI of Siliguri gives a coherent picture of the present condition of the ambient air quality of the city. The concentrations and trends of SO2 and NO2 in the ambient air of Siliguri were below the standard set by NAAQS. In contrast, the concentration of PM10 found to be infringed the acceptable limit set by NAAQS. However, PM2.5 was considered as a moderate pollutant presently under the acceptable limit, but very soon it tends to violate the national standard. Also, recent AQI study of 2019 reveals that the air quality of Siliguri became worst during winter seasons which may lead to serious health issues. It may lead to many health issues like breathing problems, headache and irritation of eyes, especially during these winter months. Also, smog episodes were frequent during these winter months as the city was covered by a thick blanket of smog sporadically. So it is comprehensible that the ambient air quality of Siliguri was under critical condition and immediate necessary actions should need to take in order to mitigate the concentration of pollutants.
Emission from vehicles, especially diesel-run city autos should be considered as major causes for such inferior air quality and high concentration of PM10 and PM2.5 in the city. An immediate introduction of alternative fuel like compressed natural gas (CNG) and also electric vehicles should be necessary in order to minimize the pollution level. More real-time air monitoring stations should be equipped promptly at various locations of the city. Adoption of BS4 engine (Bharat stage 4) to BS6 for all two and three-wheelers should be mandatory to curb the emancipation of particulate matter. Pollution under control (PUC) certificates should be short term validity so people would renew it at regular intervals and also aggregate of vehicles owned by households should be minimized. Emission of dust particles from construction sites also needs to be reduced soon. Upgradation of the public transport system should also be relevant by improving the efficiency of roads and services. In the case of solid waste management, an advanced method like a bio-methanation plant, scientific landfill and compositing should be adopted. Besides, public awareness should be the utmost importance in order to make Siliguri better in terms of air quality. Furthermore, choosing public transport, cycling, carpooling, maintenance of vehicles and their proper servicing are some minor steps for the betterment of the environment of Siliguri.
Acknowledgement
The Authors would like to thanks West Bengal pollution control board (WBPCB) and Central pollution control board (CPCB) for their detailed data without which it is not possible to complete the findings.
Funding Source
The author(s) received no financial support for the research, authorship, and/or publication of this article.
Conflict of Interest
The authors do not have any conflict of interest
References
- Sun Z, Zhu D. Exposure to outdoor air pollution and its human health outcomes: A scoping review. Plos One. 2019; 14(5). DOI:10.1371/journal.pone.0216550.
- Chaurasia S., Dwivedi P., Singh R., Gupta A.D. Assessment of ambient air quality status and air quality index of Bhopal city, Madhya Pradesh. International Journal of Current Science. 2013; 9:96-101.
- Mishra R.K., Shukla A., Parida M. and Pandey G. Urban roadside monitoring and prediction of CO, NO2 and SO2 dispersion from on-road vehicles in megacity Delhi. Transportation Research. 2016; 46:157–165.
- Nagurney A. Congested urban transportation networks and emission paradoxes. Transportation Research Part: Transport and Environment. 2000; 5(2):145–151. DOI: 10.1016/s1361-9209(99)00031-0.
- Sawalha AF. Outdoor air pollution and respiratory health: a bibliometric analysis of publications in peer-reviewed journals (1900 – 2017). Multidisciplinary Respiratory Medicine. 2019; 13(1). DOI:10.4081/mrm.2018.146
- Haque S, Singh RB. Air Pollution and Human Health in Kolkata, India: A Case Study. Climate. 2017;5(4):77. DOI: 10.3390/cli5040077.
- Guidelines for Ambient Air Quality Monitoring. http://www.indiaairquality.info/wp-content/uploads/docs/2003_CPCB_Guidelines_for_Air_Monitoring.pdf. Accessed December 23, 2019.
- NATIONAL AIR QUALITY INDEX - indiaenvironmentportal.org.in. http://www.indiaenvironmentportal.org.in/files/file/Air Quality Index.pdf. Accessed January 17, 2020.
- Atmakuri K.C. A Survey Paper on Spatial-Temporal Outliers Influencing Air Quality. International Journal of Engineering Research and Development.2018; 14(1): 39–43.
- National Air Quality Index. Arthapedia. http://arthapedia.in/index.php?title=National_Air_Quality_Index. Accessed January 17, 2020.
- National Air Quality Index. https://app.cpcbccr.com/ccr_docs/How_AQI_Calculated.pdf. Accessed January 17, 2020
- Call to solve Siliguri pollution problems. The Statesman. https://www.thestatesman.com/cities/call-solve-siliguri-pollution-problems-1502623872.html. Published April 17, 2018. Accessed February 5, 2020.
- Bhaskar BV, Mehta VM. Atmospheric Particulate Pollutants and their Relationship with Meteorology in Ahmedabad. Aerosol and Air Quality Research. 2010; 10(4):301-315. DOI:10.4209/aaqr.2009.10.0069
- When do smog episodes arise? — English - irceline.be. http://www.irceline.be/en/documentation/faq/when-do-smog-episodes-arise. Accessed January 22, 2020.
- Sati AP, Mohan M. Analysis of air pollution during a severe smog episode of November 2012 and the Diwali Festival over Delhi, India. International Journal of Remote Sensing. 2014; 35(19):6940-6954. DOI:10.1080/01431161.2014.960618.


